
| Phil Steele Blog • August 13, 2016 |
|---|
Stock Market Indicator.
Metrics, Metrics, Metrics. Almost every system I come up with first looks at college football and then I check to see if the success translates to the NFL. This system is the exception as it made my NFL magazine first, under the title Slipping and Sliding. However, when I tried to plug this system in for college football, it did not have the same results as it did in the NFL, as teams’ records fluctuate more and there is not as much parity. The college system I devised was built taking into account a longer term. What I did was take a 2-year result record vs the previous year’s win total and that got me to the NFL-type success percentages.
For example, in 2012 Ohio St had a Stock Market Indicator (SMI) of +5.5, which would be a Bull Market. The +5.5 was calculated by taking their average win total from 2009-2010, which was 11.5 (11-2 in ’09, 12-1 in ’10) and then subtracting their wins from ‘11 (just 6) which produced the +5.5. The +5.5 means that after two great seasons in ’09-‘10, the Buckeyes clearly underperformed in ‘11 and were poised for a big bounce back lthe next year (Bull Market). My Stock Market Indicator proved to be spot on as the Buckeyes were the Most Improved Team in the country going 12-0 in ’12! In ‘13 Auburn was coming off a 3-9 season following two years of a combined 22-5. That earned them a +8 in my Stock Market Indicator and they got to the National Title game! In 2014 TCU was +5 in the Bull Market and went from 4-8 to 12-1 and was the Most Improved Team in the country!
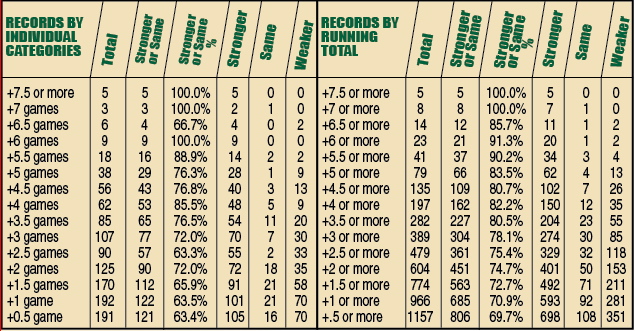
The Bull Market: After several years I expanded my research to take a look back at all records since 1990 and I was quite surprised. Since 1990 there have been a total of 23 teams that had a +6 Stock Market Indicator meaning that the prior year’s win total was 6 wins less than the average of the 2 years prior. Of those 23 teams, only 2 teams have had a weaker record, while 20 improved and 1 stayed the same. That improvement was dramatic going from a combined 63-203 (23.7%) to 116-159 (42.2%). I expected to see a drastic drop off in the numbers at the next level but surprisingly did not. Teams in the +5.5 category improved their record to 14-2-2. There have been 38 instances of teams being +5 in the SMI category and those teams were 28-9-1 (76.3%). The records for +4.5 went 40-13-3 (76.8%) and despite going down to +4 in my Stock Market Indicator, it surprisingly jumped back up to 48-9-5 (85.5%), which was superior to the individual +4.5 and +5 range. The numbers did drop back to 76.5% for a +3.5 net wins, 72.0% for +3 and down to 63.3% for +2.5. However, just when you thought the trend would get lower, surprisingly +2.0 had a 72.0% success rate. Even teams that had a +1.5 SMI from the prior two years, went up or stayed the same 63.5% of the time and teams that were either +1 & +0.5 combined for 63.4%!
Summing it all up, I will put it into 4 categories. Teams with a +6.0 SMI or higher were an almost perfect 20-2-1 (91.3%). Teams in the +4 to +5.5 range were 130-33-11 (81.0%) while teams in the +2 to +3.5 two-year SMI range were 251-118-38 (71.0%). Teams that were in the +.5 to +1.5 range were 297-198-58 (64.2%). Overall, of the 1157 teams s/’90 that had a +.5 SMI or higher, 698 improved their record, and 108 had the same record meaning 69.7% of the time, teams in that category improved or had the same record.
This year 4 teams fall into the top bracket of +6 or more on the two-year SMI. Also listed are teams with a +5 or more on my SMI.
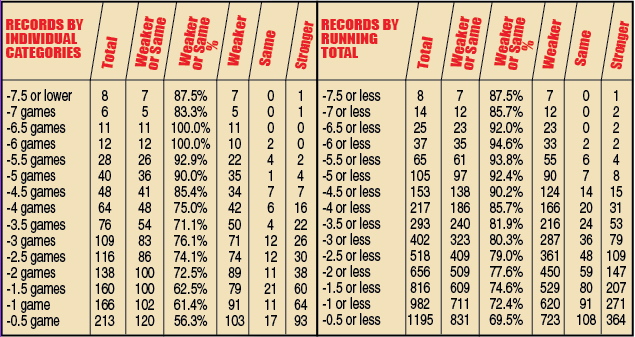
The Bear Market: Like all of my systems I put in my magazine, there is a two-way street to this Stock Market Indicator (SMI). I also reviewed the numbers since 1990, on the Bear side of the market, teams with a negative indicator, indicating that a team had likely over achieved the prior season, and the numbers were similar to the Bull side. In fact of 37 teams that had a -6.0 SMI or lower since 1990, only 2 managed to improve their record. In 2003 Navy which went from 8-5 to 10-2 and in 2000 South Carolina which went from 8-4 to 9-3. The biggest drop-offs came in 1998. Tulane had a -7.5 SMI and went from 12-0 to 3-8. Interestingly in 1998 I called for Washington St to go from a Rose Bowl to last place in the Pac-10, which they did and in the 2 year SMI they were -6.0 and went from 10-2 to just 3-8.
A look at the 2 year SMI shows a power trend of basically 78% if teams have a -2.0 SMI or less since 1990. Unlike the above positive Market Indicator, there were actually two teams that bucked the trend with a -7.5 or -7 and improved but overall the chart has higher percentages at the -6 & below level (33-2-2, 94.6%). Teams that had a Stock Market Indicator of -5 or lower had a weaker or the same record the next year 92.4% of the time with 90 having a weaker record, only 8 with a stronger record and 7 having the same record. Even teams with a SMI between -3.0 to -4.5 were in a 76.1% category having a weaker record 197 times and improving the record just 71 time and having the same record 29 times. The teams in the -2.0 to -2.5 Stock Market Indicator had a weaker or same record the next year 73.2% of the time. Unlike the positive Market Indicator, Teams in the -1 to -1.5 range had the same or weaker record only 62.0% of the time.
Bottom line is that a 92.4% trend of a weaker or same record occurs if teams have a -5 SMI or less, -3 to -4.5 is 76.1% and -2 to -2.5 is 73.2%. Overall, teams that had -2 SMI or lower had the weaker or the same record basically 77.6% of the time.
Last year of the 6 teams that rated a -4.5 or higher (in the box of this article), 5 had weaker record and one had the same. Here are the 8 teams with a -5.0 SMI or lower including 4 at -5.5 or higher.
Here is the complete list of the stock market indicator. Teams highlighted in green are the Bull Market. Teams highlighted in red are the Bear Market.
| BEAR MARKET | ||||
| UCF | 10.5 | MIDDLE TENNESSEE | 0 | |
| MISSOURI | 6.5 | IOWA ST | -0.5 | |
| GEORGIA TECH | 6 | MIAMI, FL | -0.5 | |
| SOUTH CAROLINA | 6 | VIRGINIA | -0.5 | |
| FRESNO ST | 5.5 | MISSISSIPPI ST | -0.5 | |
| NORTH TEXAS | 5.5 | HAWAII | -0.5 | |
| UL LAFAYETTE | 5 | UTEP | -0.5 | |
| BALL ST | 4.5 | CENTRAL MICHIGAN | -0.5 | |
| BOSTON COLLEGE | 4 | COLORADO | -1 | |
| ARIZONA ST | 4 | TEXAS TECH | -1 | |
| OREGON ST | 4 | GEORGIA | -1 | |
| MARYLAND | 4 | BYU | -1 | |
| RICE | 4 | BOWLING GREEN | -1 | |
| EAST CAROLINA | 4 | NEW MEXICO ST | -1 | |
| FLORIDA ST | 3.5 | UMASS | -1 | |
| NORTHERN ILLINOIS | 3.5 | GA SOUTHERN | -1 | |
| UTAH ST | 3.5 | INDIANA | -1.5 | |
| TEXAS ST | 3.5 | NOTRE DAME | -1.5 | |
| NEBRASKA | 3 | OKLAHOMA | -1.5 | |
| KANSAS | 3 | OKLAHOMA ST | -1.5 | |
| RUTGERS | 3 | PITTSBURGH | -1.5 | |
| OREGON | 3 | NC STATE | -1.5 | |
| AUBURN | 3 | MISSISSIPPI | -1.5 | |
| ULM | 3 | KENTUCKY | -1.5 | |
| CHARLOTTE | 3 | SAN JOSE ST | -1.5 | |
| KANSAS ST | 2.5 | OHIO | -1.5 | |
| WYOMING | 2.5 | NEVADA | -1.5 | |
| LOUISVILLE | 2.5 | ARKANSAS ST | -1.5 | |
| UTSA | 2.5 | AIR FORCE | -2 | |
| MINNESOTA | 2 | MIAMI, OH | -2 | |
| TEXAS | 2 | TOLEDO | -2 | |
| UCLA | 2 | WEST VIRGINIA | -2.5 | |
| ARIZONA | 2 | STANFORD | -2.5 | |
| VANDERBILT | 2 | ALABAMA | -2.5 | |
| COLORADO ST | 2 | MEMPHIS | -2.5 | |
| CINCINNATI | 2 | NAVY | -2.5 | |
| TULANE | 2 | LOUISIANA TECH | -2.5 | |
| OLD DOMINION | 2 | FIU | -2.5 | |
| USC | 1.5 | ARKANSAS | -3 | |
| WASHINGTON | 1.5 | TENNESSEE | -3 | |
| DUKE | 1.5 | TCU | -3 | |
| UNLV | 1.5 | UTAH | -3 | |
| ARMY WEST POINT | 1.5 | AKRON | -3 | |
| MARSHALL | 1.5 | IDAHO | -3 | |
| BUFFALO | 1.5 | CLEMSON | -3.5 | |
| FLORIDA ATLANTIC | 1.5 | TULSA | -3.5 | |
| OHIO ST | 1 | SAN DIEGO ST | -3.5 | |
| BAYLOR | 1 | NEW MEXICO | -3.5 | |
| SYRACUSE | 1 | WESTERN MICHIGAN | -3.5 | |
| SMU | 1 | CONNECTICUT | -3.5 | |
| EASTERN MICHIGAN | 1 | MICHIGAN | -4 | |
| BOISE ST | 1 | WKU | -4 | |
| SOUTH ALABAMA | 1 | IOWA | -4.5 | |
| TEXAS A&M | 0.5 | WASHINGTON ST | -4.5 | |
| VIRGINIA TECH | 0.5 | NORTH CAROLINA | -4.5 | |
| WAKE FOREST | 0.5 | FLORIDA | -4.5 | |
| KENT ST | 0.5 | NORTHWESTERN | -5 | |
| TROY | 0.5 | CALIFORNIA | -5 | |
| PENN ST | 0 | HOUSTON | -5 | |
| ILLINOIS | 0 | USF | -5 | |
| MICHIGAN ST | 0 | GEORGIA ST | -5.5 | |
| WISCONSIN | 0 | APPALACHIAN ST | -5.5 | |
| PURDUE | 0 | TEMPLE | -6 | |
| LSU | 0 | SOUTHERN MISS | -7 | |
| BULL MARKET | ||||
Three ways to get a copy of Phil Steele's 2016
College Football Preview or Pro Preview!
#1. Order now: The trucks have already arrived with the 2016 College Preview and the 2016 Phil Steele's Pro Preview. Order by early afternoon adn they will ship the same day. The 2016 Pro Preview will not be sold in stores. You can only get a copy by either calling us to order at 1-866-918-7711 or online at Phil Steele Store.
The cost for the 2016 College Magazine is $12.99 + $6.80 for shipping to take advantage of our 2 magazine special. Get a pair of Phil Steele's College Football Previews must be sent to the same address and pay just $28.99.
The cost for the 2016 Pro Preview is 9.99 + $6.80 for shipping ot take advantage of our 2 magazine special. Get a pair of Phil Steele's Pro Football Previews must be sent to the same address and pay just $21.99. Again the Pro Magazine will not be sold in stores.
Or get one of each magazine. One College reg price $12.99 + $6.80 and one Pro $9.99 + $6.80 for just $29.78 just one shipping cost. Must be sent to the same address.
#2. In Stores Now. The 2016 College Magazine will be available at these Seven retailers.
• Barnes & Noble • Books-A-Million • CVS • Publix • Target
• Walgreens & Now Returning to ALL Walmart Locations nationwide!
The Phil Steele's 2016 Pro Preview will not be in stores you can only order online at the Phil Steele Store or call 1-866-918-7711.
2016 College Football & Pro Preview
available right now on iTunes & Google Play!
#3. Available now: The digital copy on the Phil Steele 2016 College Football Preview and 2016 Pro Football Preview is now available on the iTunes app store and on your Android device thru the Google Play Store. Just search for the Phil Steele Football app in your respective devices store, download the app and purchase either the 2016 College Magazine or Pro Magazine there for just $9.99.
1). it will save you wear and tear on your printed magazine. If you get both you can use it as your mobile version of the magazine and that will keep your actual magazine from getting dog eared and torn up early in the year.
2). It’s easy to use and works for both the iPhone, iPad and any Android Devices. The download process may take up to 10-15 minutes but that’s because we have over 350 pages in the College magazine & 260 pages in the Pro Magazine jam-packed with information!
3). Non-U.S. Customers: The magazine will not be on the newsstands in Canada or internationally, the only way to get the 2016 College Football or Pro Preview is to order through our office and the cost could be close to $50 (includes shipping) or get it on iTunes or Google Play for just $9.99.
For exact cost for Canada & International shipping email customer service: Here
4). It’s only $9.99! On the newsstand, the magazine will cost you $12.99 + $6.80 shipping.
Please note: after downloading and purchasing the App, please make sure you search for 2016 if the old 2015 cover/edition comes up on your screen.