
TEXAS LONGHORNS |
|
STADIUM: Darrell K Royal Texas Memorial PLAYING SURFACE: FieldTurf • CAPACITY: 100,119 STARTERS RETURNING (O/D): 10*/6 LETTERMAN RETURNING: 41 (20,18,3) • LETTERMAN LOST: 21 (9,11,1) |
 |
|
| LOCATION: Austin, TX | |
| FOUNDED: 1883 | |
| ENROLLMENT: 40,916 | |
| COLORS: Burnt Orange & White | |
| MASCOT: Bevo XIV | |
| CONFERENCE: Big 12 | |
| HEAD COACH: Steve Sarkisian | |
| YEARS WITH TM: 3rd | |
| OVERALL REC: 59-47 | |
| RECORD WITH TM: 13-12 |
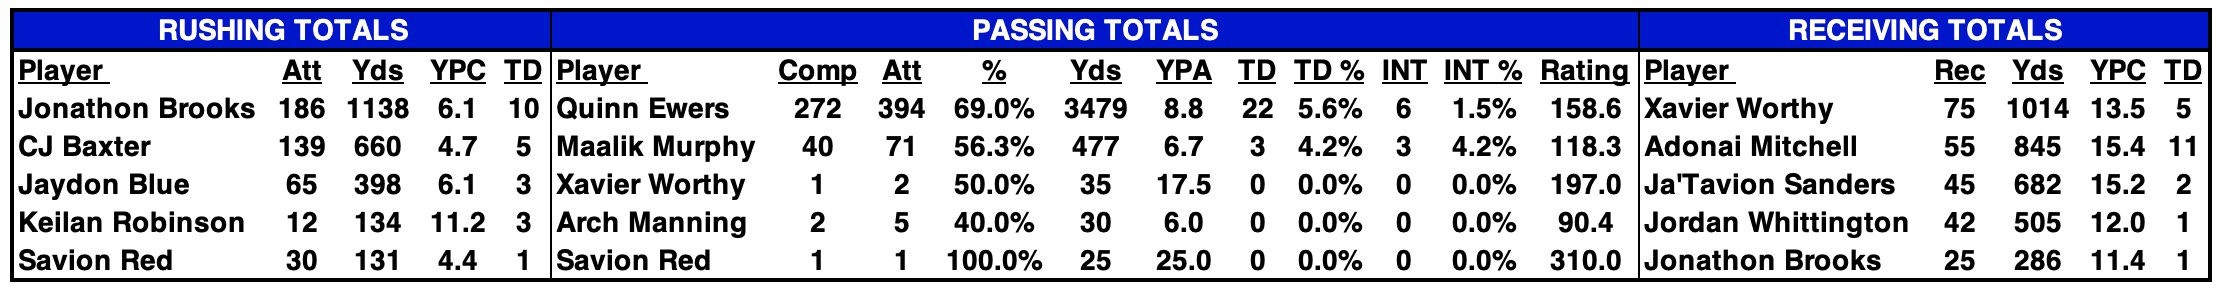
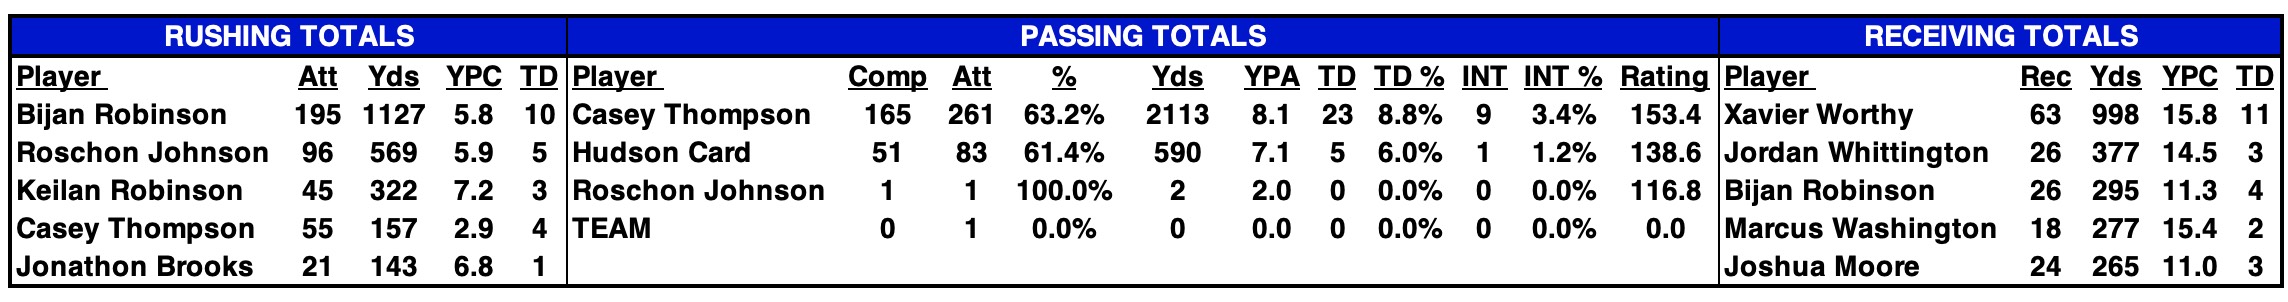
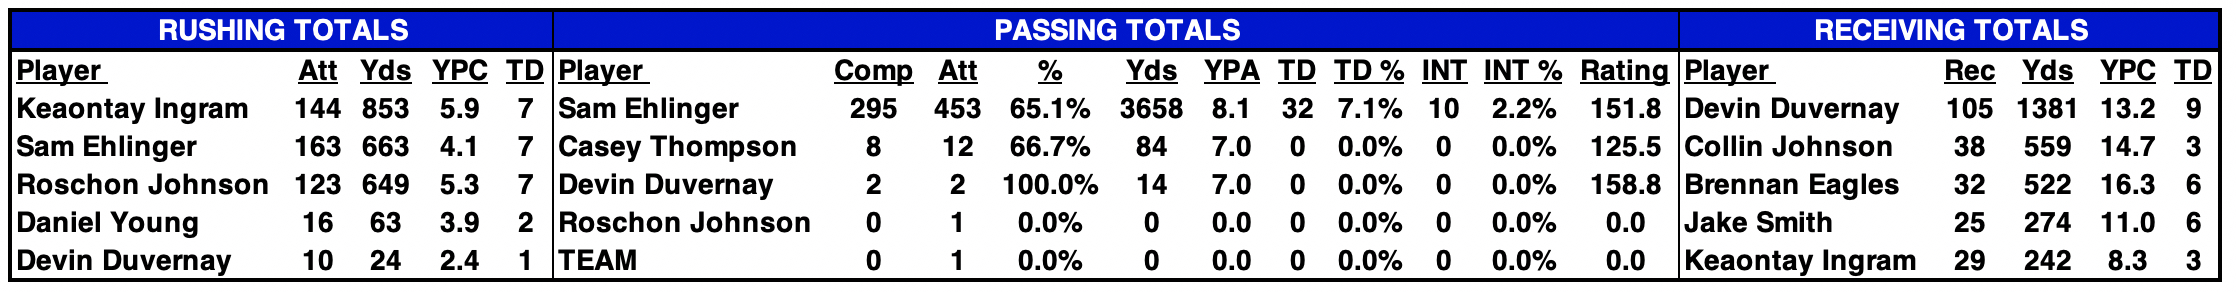
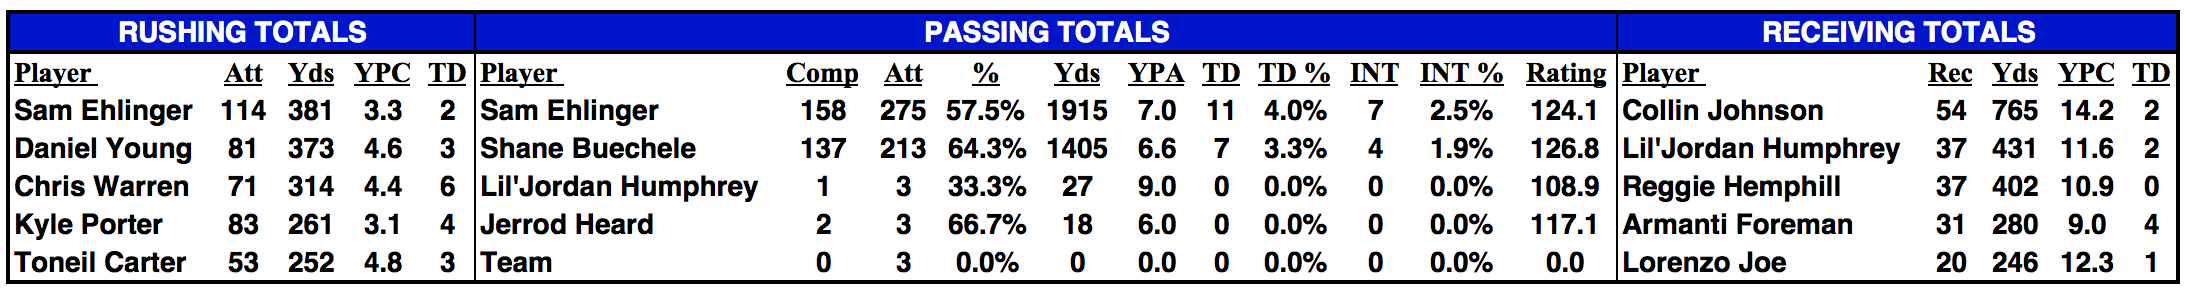
2023 STATISTICAL LEADERS |
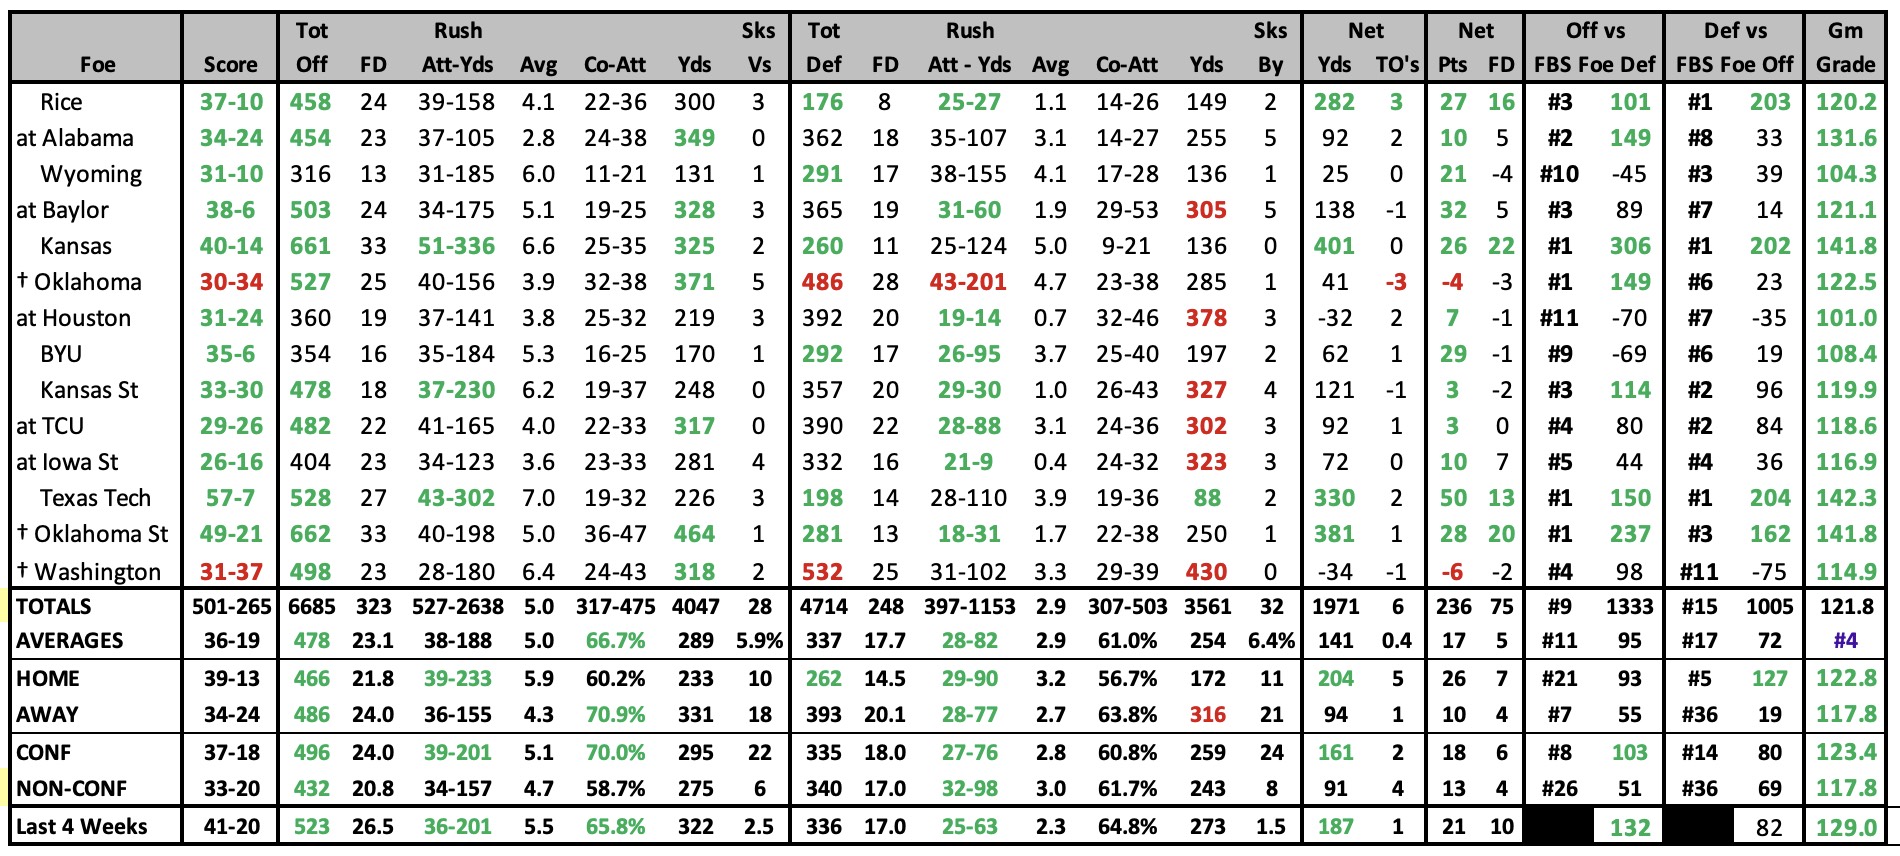
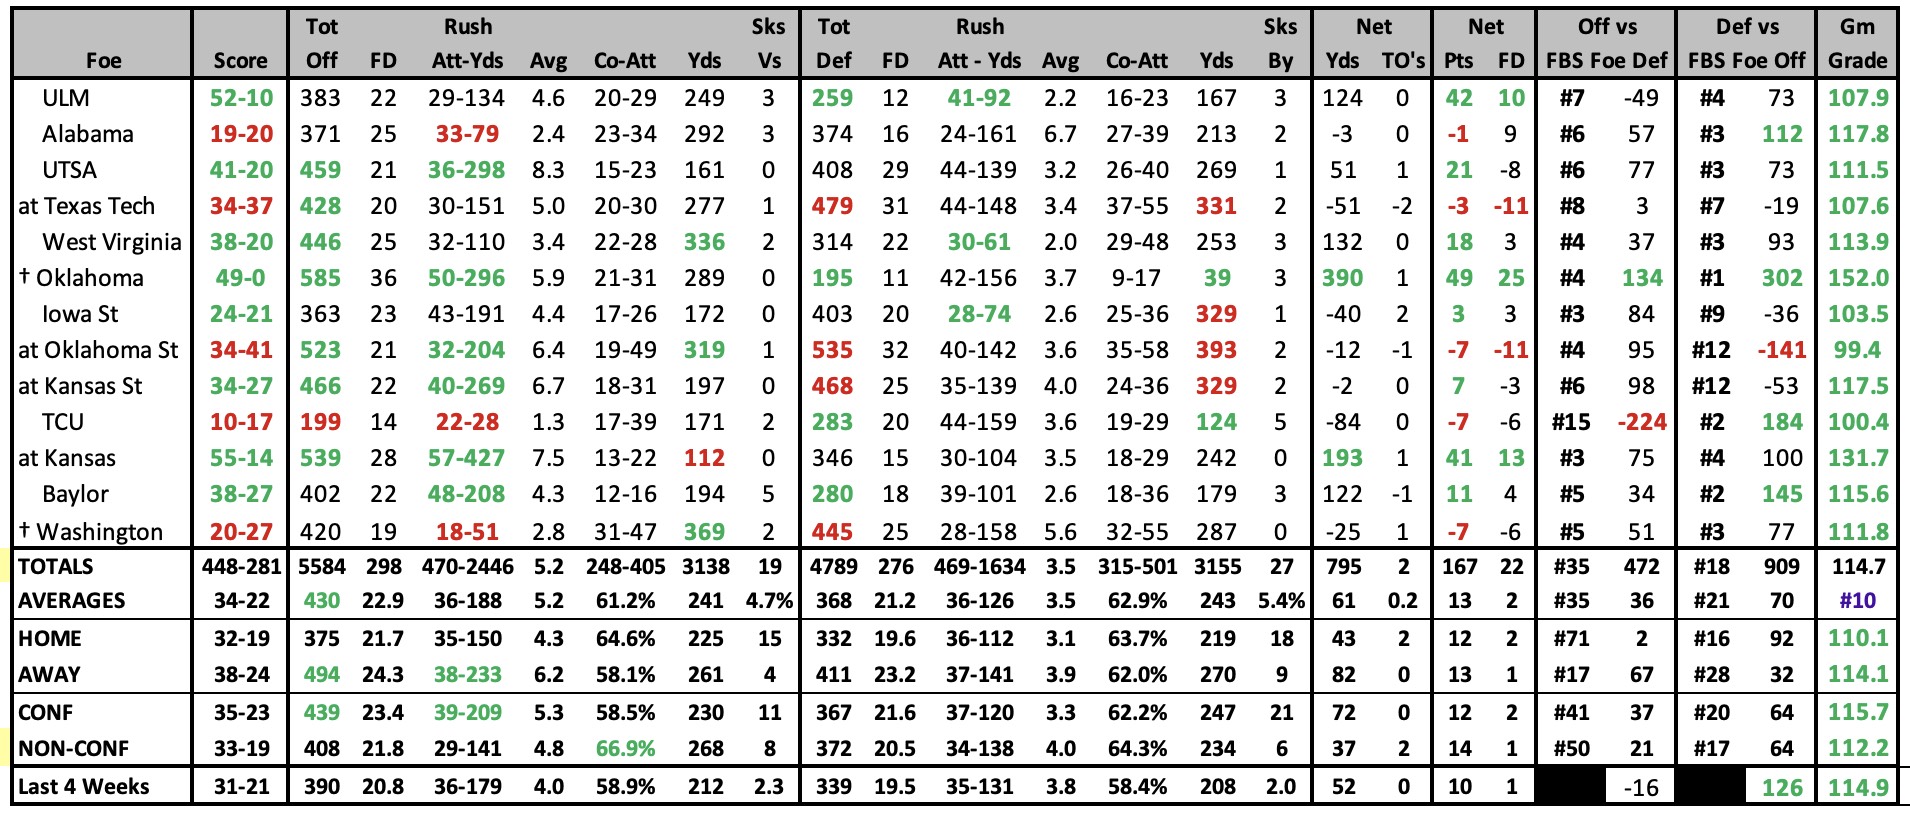
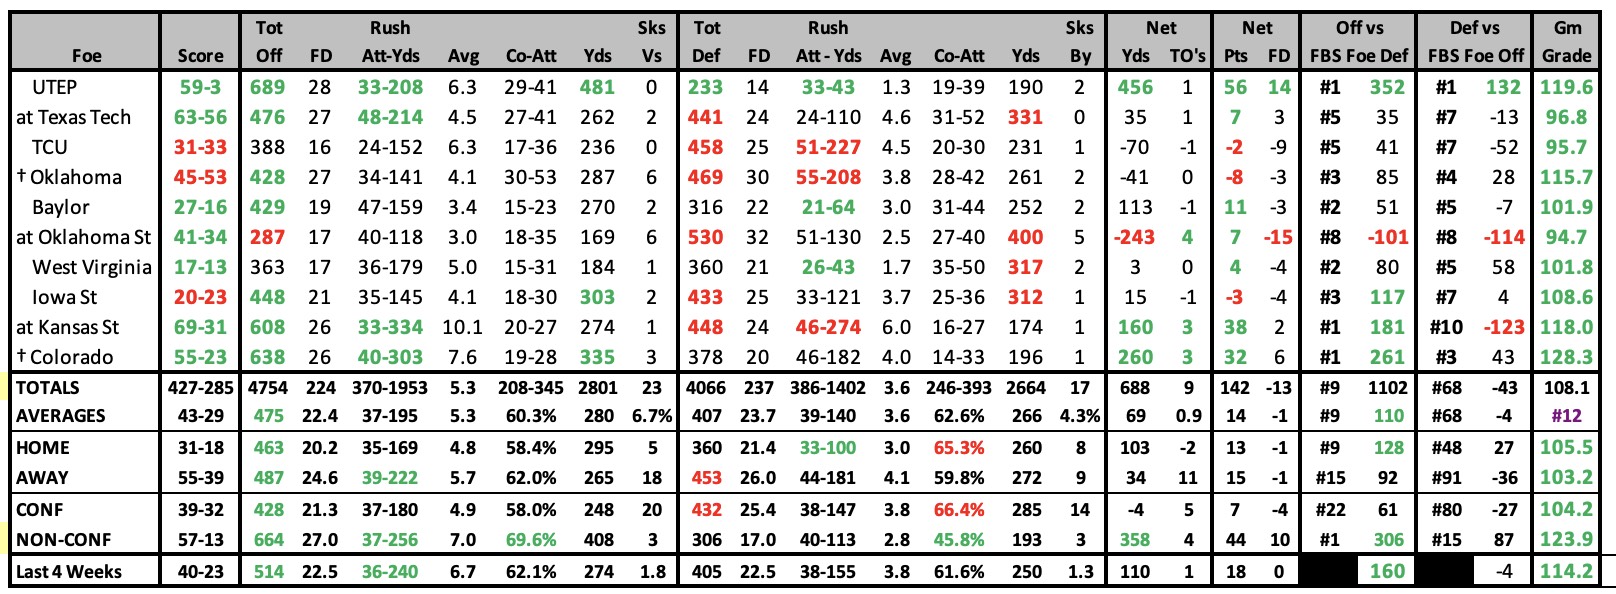
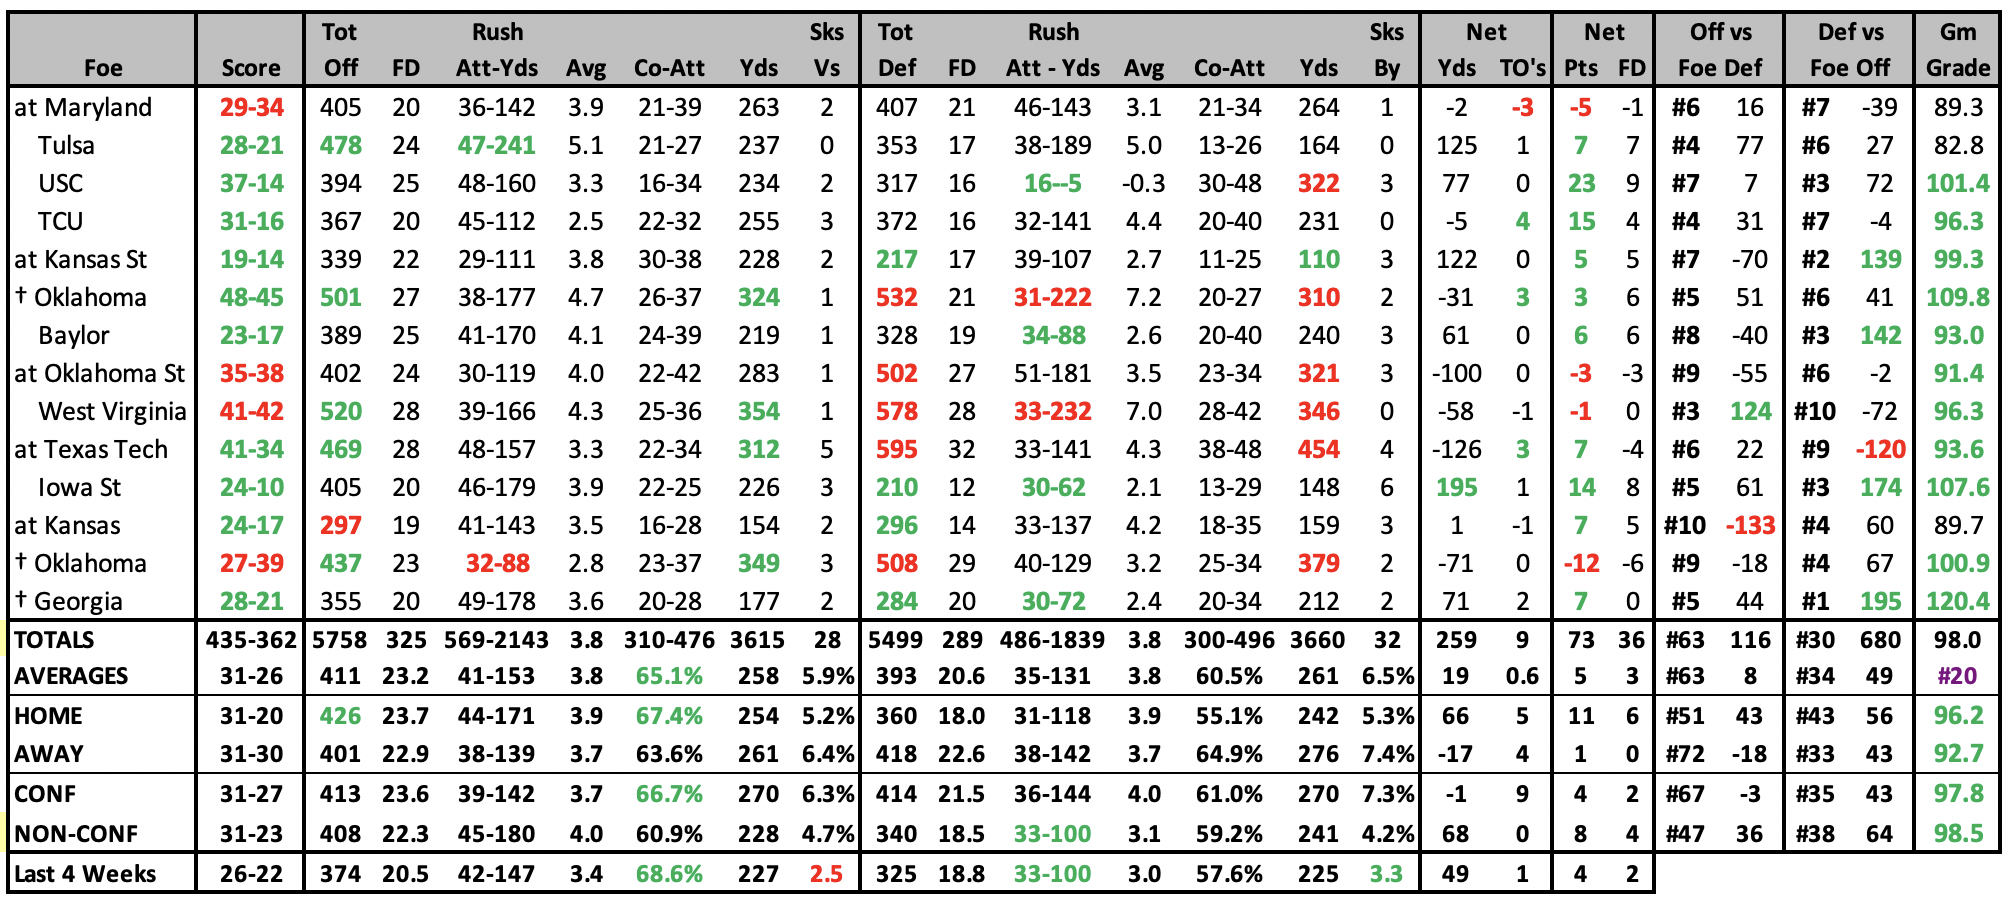
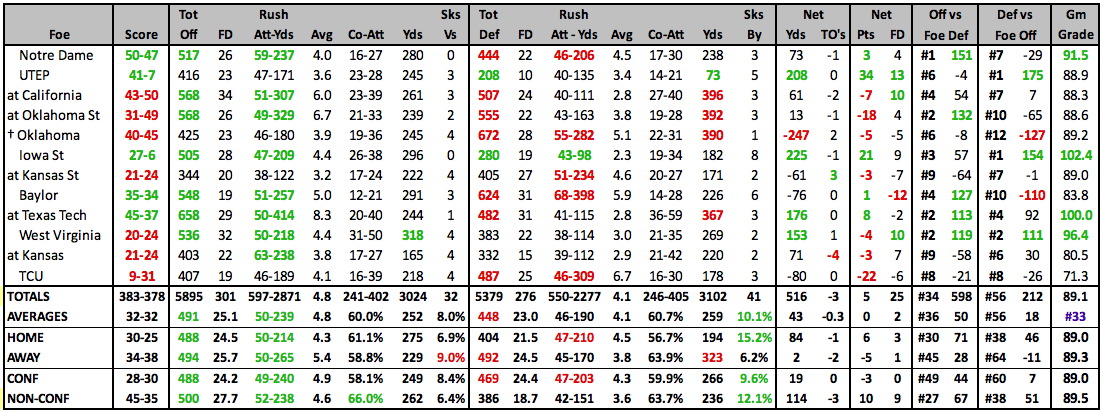
2023 GAME BY GAME STATS |
 |
2023 SCHEDULE |
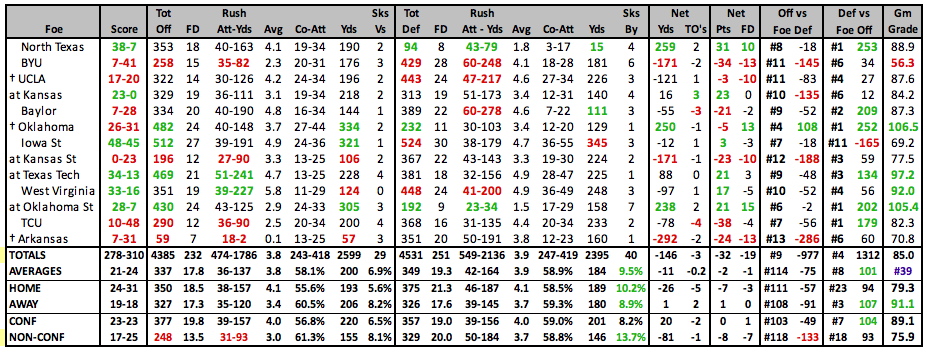
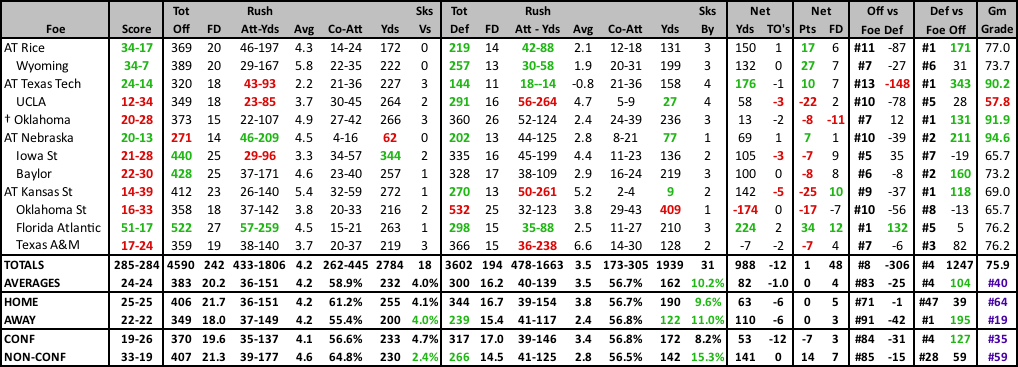
2022 RESULTS |
||||||||||||||||||||||||||||||||||||||||||||||||||||||||||||||||||||||||||||||||||||||||||||||||||||||||||||||||||||||||||||||||||||||||||||||||||||||||||||||||||||||||||||||||||||||||||||||||||||||||||||||||||
|
|
||||||||||||||||||||||||||||||||||||||||||||||||||||||||||||||||||||||||||||||||||||||||||||||||||||||||||||||||||||||||||||||||||||||||||||||||||||||||||||||||||||||||||||||||||||||||||||||||||||||||||||||||||
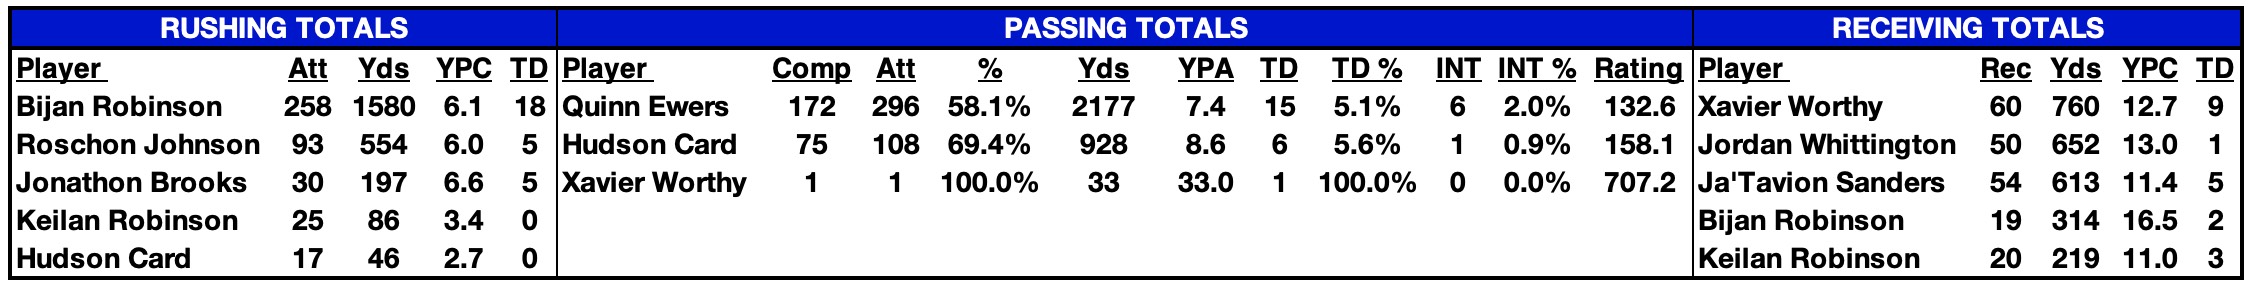
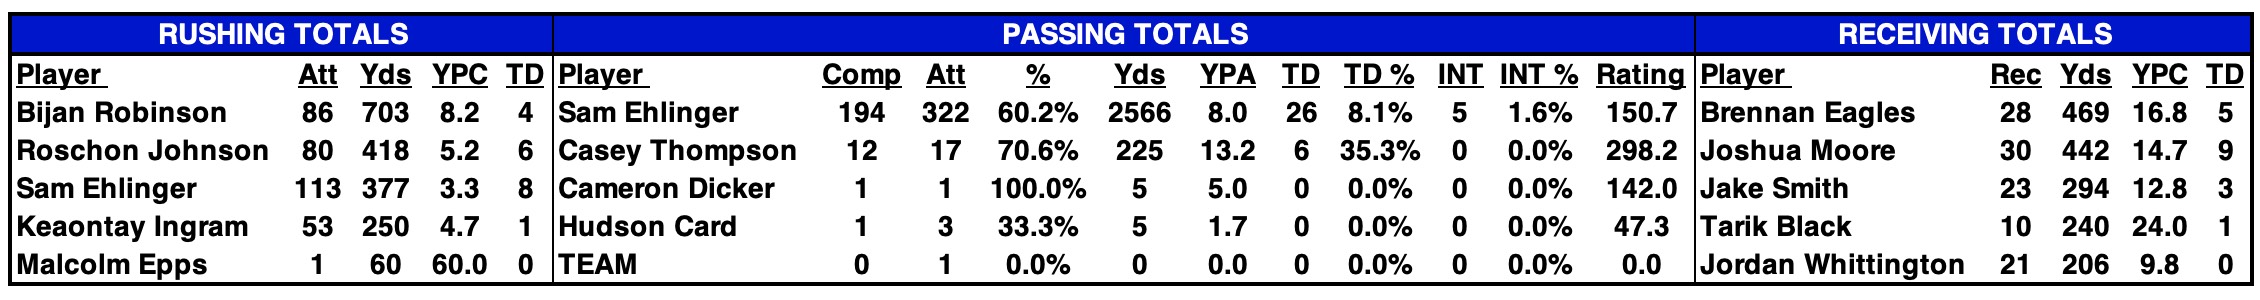
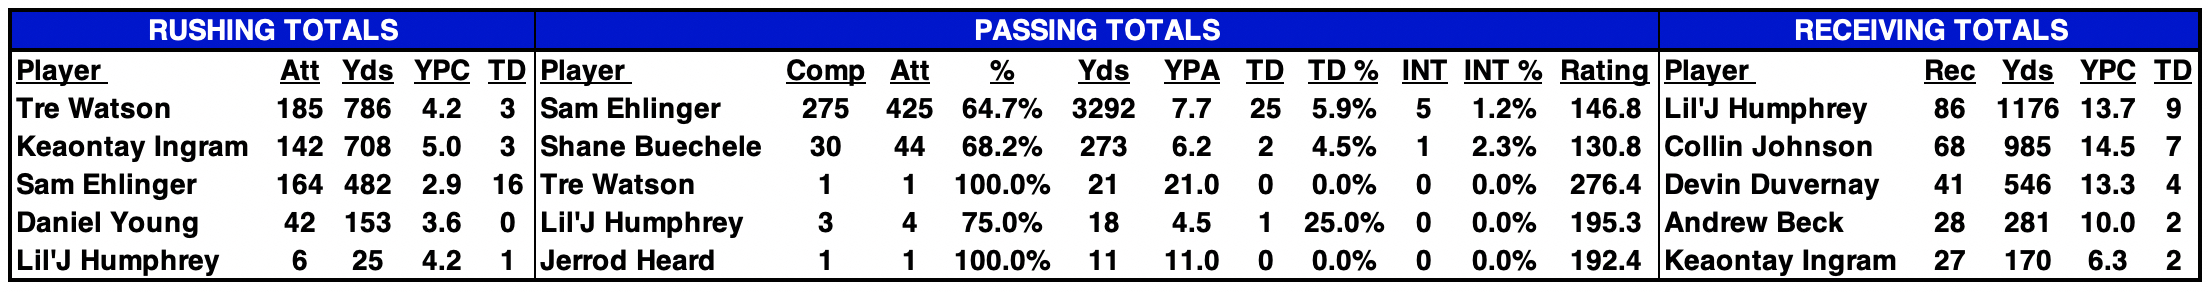
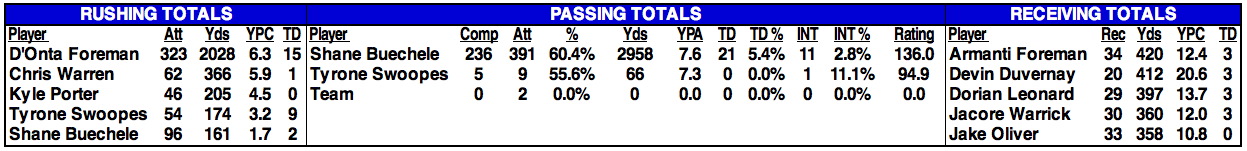
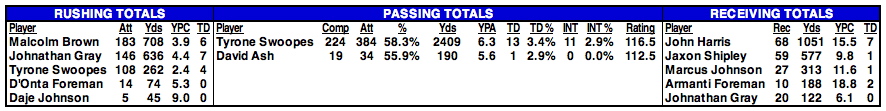
2022 STATISTICAL LEADERS |
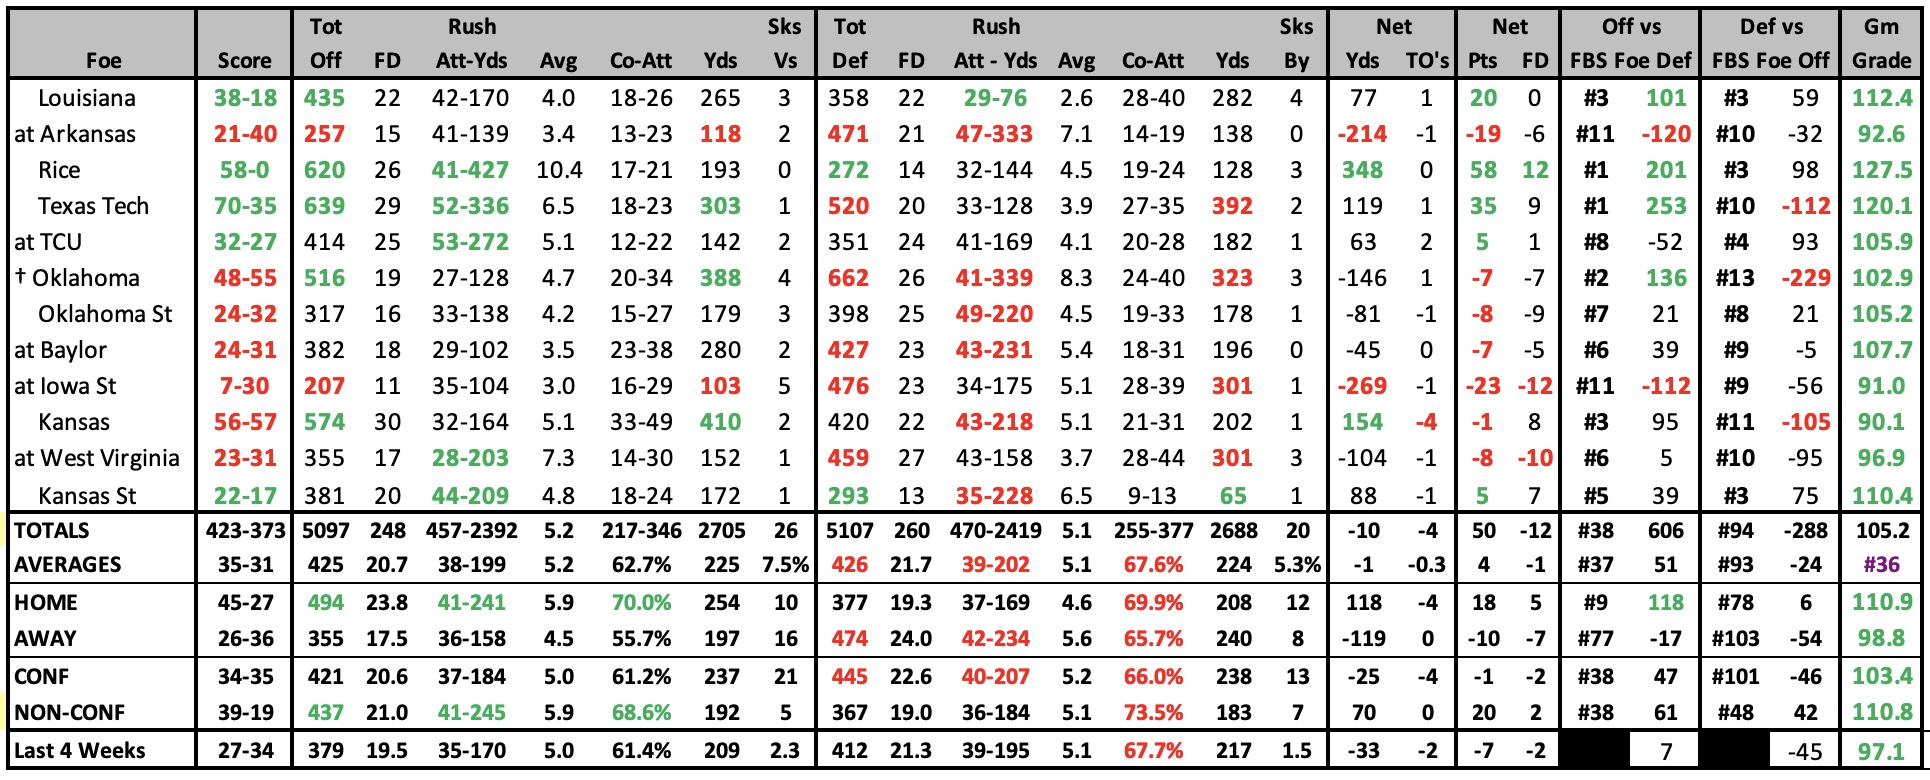
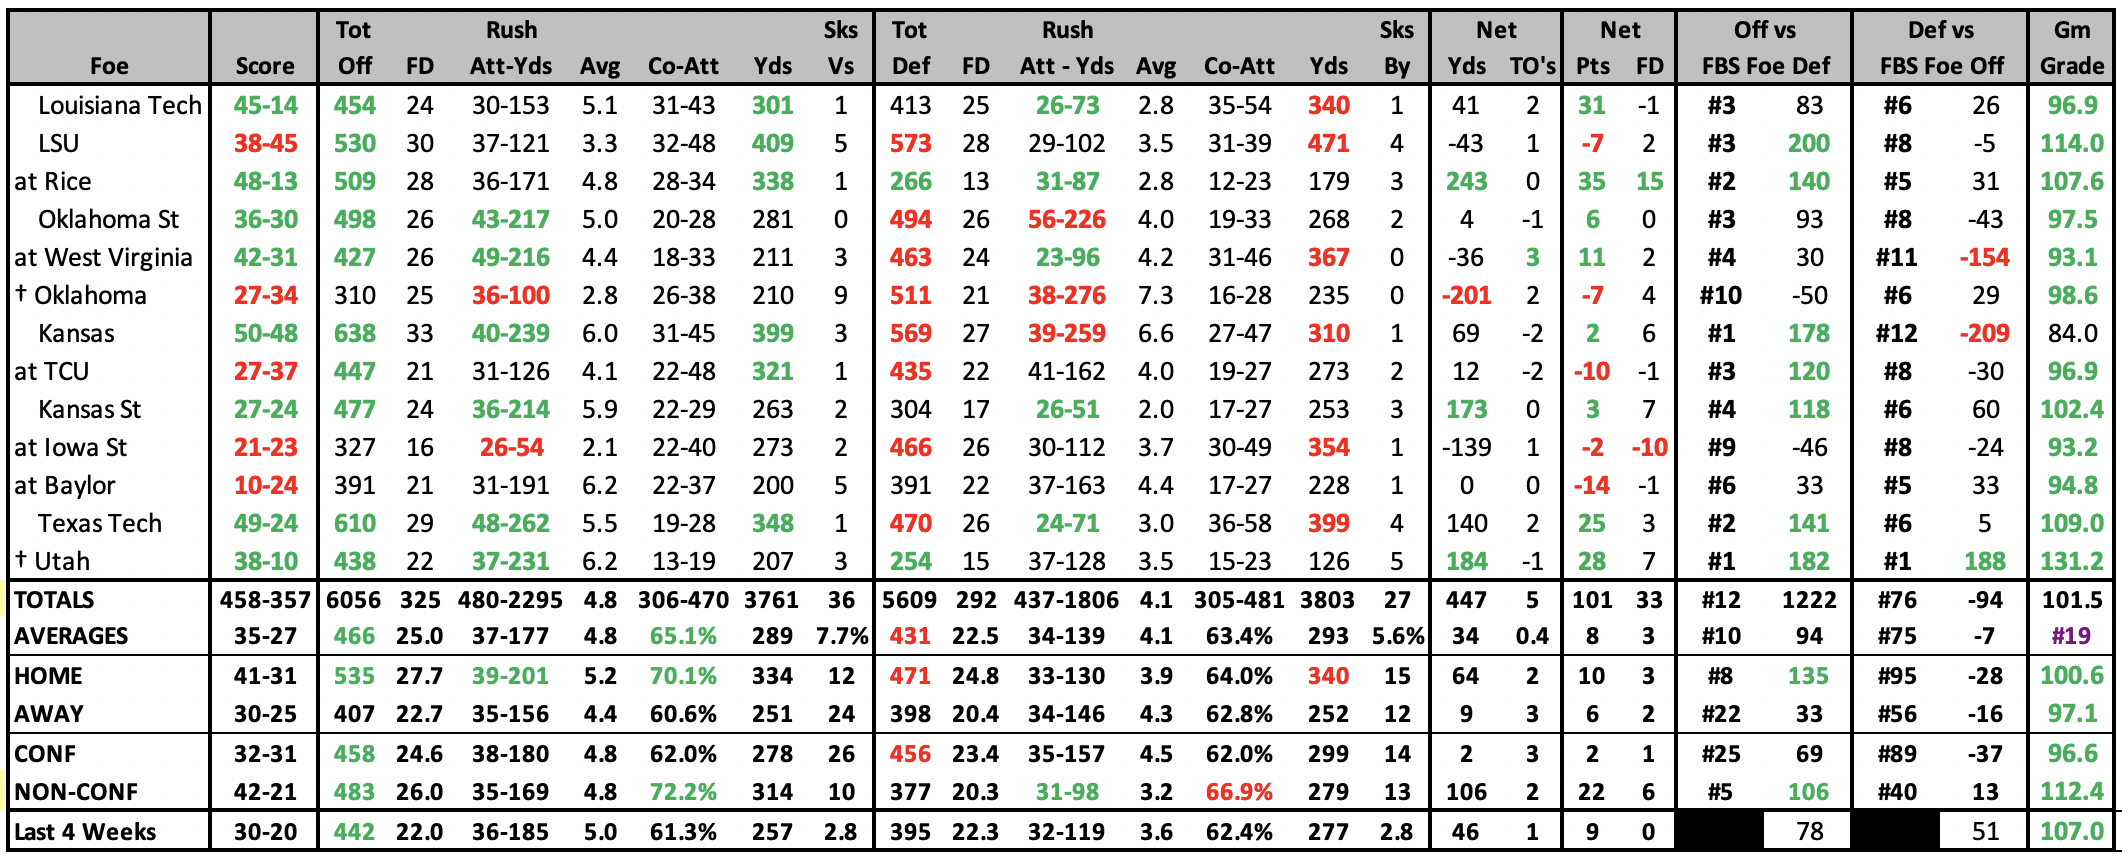
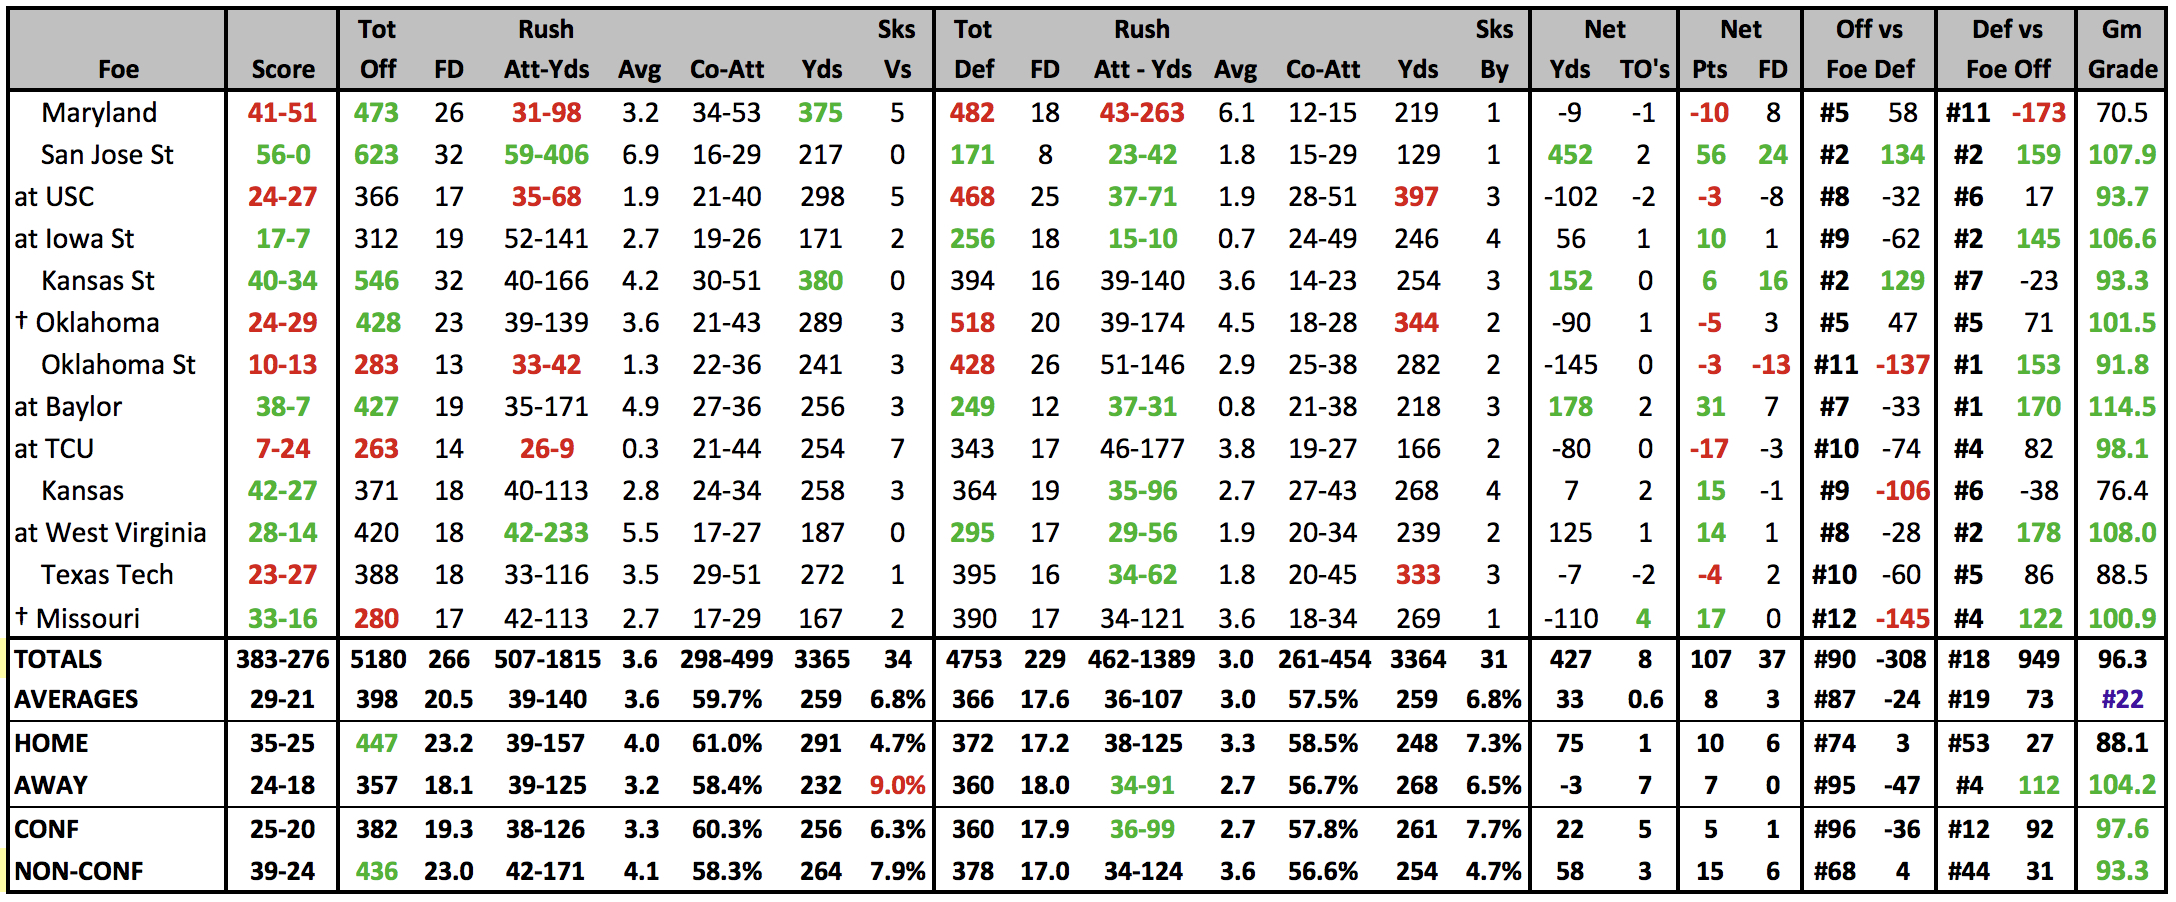
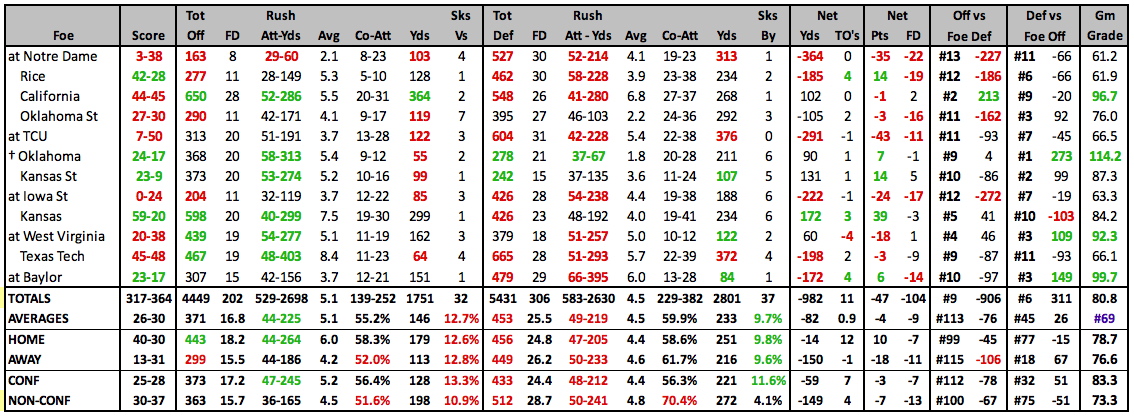
2022 GAME BY GAME STATS |
 |
2022 SCHEDULE |
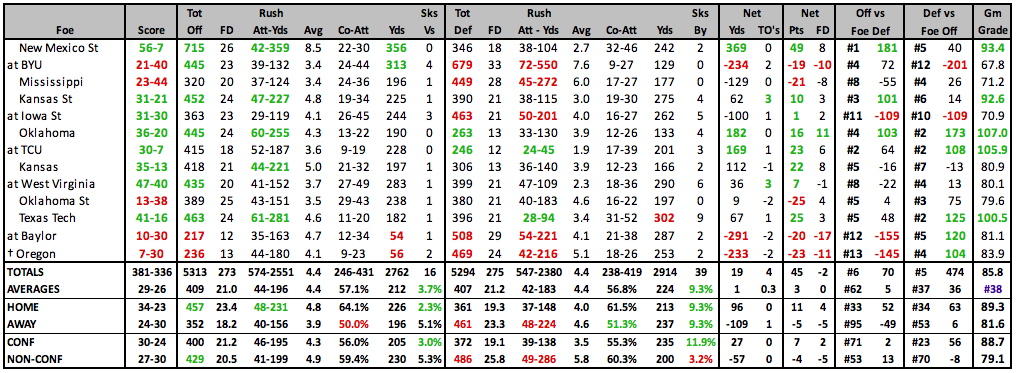
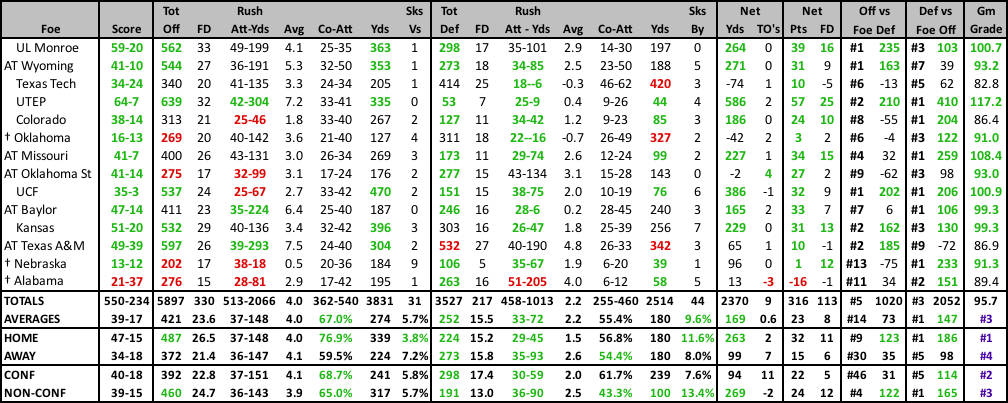
2021 RESULTS |
||||||||||||||||||||||||||||||||||||||||||||||||||||||||||||||||||||||||||||||||||||||||||||||||||||||||||||||||||||||||||||||||||||||||||||||||||||||||||||||||||||||||||||||||||||||||||||||||
|
|
||||||||||||||||||||||||||||||||||||||||||||||||||||||||||||||||||||||||||||||||||||||||||||||||||||||||||||||||||||||||||||||||||||||||||||||||||||||||||||||||||||||||||||||||||||||||||||||||
2021 STATISTICAL LEADERS |
2021 GAME BY GAME STATS |
 |
2021 SCHEDULE |
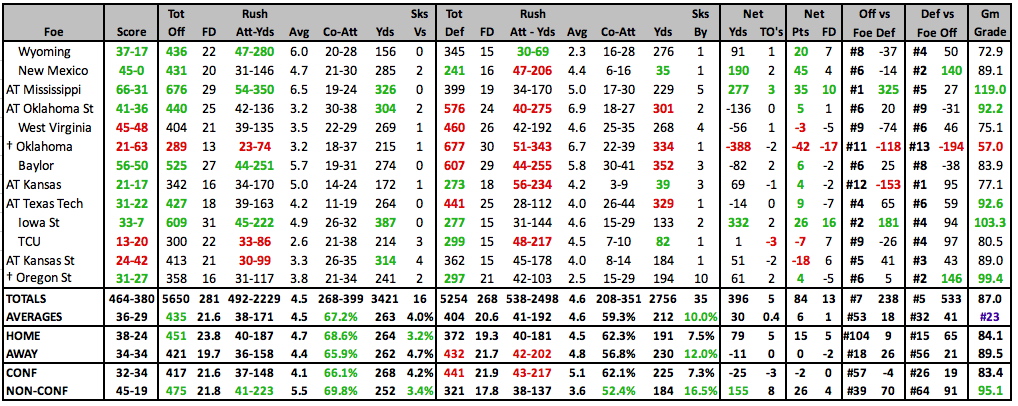
2020 RESULTS |
||||||||||||||||||||||||||||||||||||||||||||||||||||||||||||||||||||||||||||||||||||||||||||||||||||||||||||||||||||||||||||||||||||||||||||||||||||||||||||||||||||||||||||||||||||||||||
|
|
||||||||||||||||||||||||||||||||||||||||||||||||||||||||||||||||||||||||||||||||||||||||||||||||||||||||||||||||||||||||||||||||||||||||||||||||||||||||||||||||||||||||||||||||||||||||||
2020 STATISTICAL LEADERS |
2020 GAME BY GAME STATS |
 |
2020 SCHEDULE |
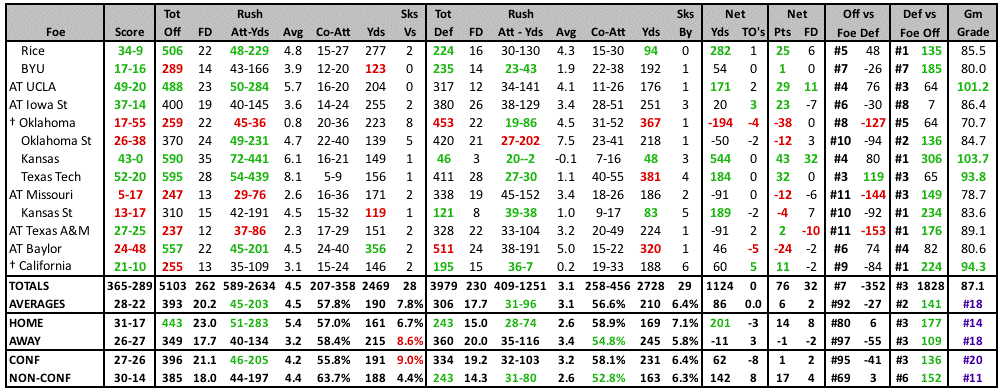
2019 RESULTS |
||||||||||||||||||||||||||||||||||||||||||||||||||||||||||||||||||||||||||||||||||||||||||||||||||||||||||||||||||||||||||||||||||||||||||||||||||||||||||||||||||||||||||||||||||||||||||||||||||||||||||||
|
|
||||||||||||||||||||||||||||||||||||||||||||||||||||||||||||||||||||||||||||||||||||||||||||||||||||||||||||||||||||||||||||||||||||||||||||||||||||||||||||||||||||||||||||||||||||||||||||||||||||||||||||
2019 STATISTICAL LEADERS |
2019 GAME BY GAME STATS |
 |
2019 SCHEDULE |
2018 RESULTS |
||||||||||||||||||||||||||||||||||||||||||||||||||||||||||||||||||||||||||||||||||||||||||||||||||||||||||||||||||||||||||||||||||||||||||||||||||||||||||||||||||||||||||||||||||||||||||||||||||||||||||||||||||||||||||||||||||||||||||
|
|
||||||||||||||||||||||||||||||||||||||||||||||||||||||||||||||||||||||||||||||||||||||||||||||||||||||||||||||||||||||||||||||||||||||||||||||||||||||||||||||||||||||||||||||||||||||||||||||||||||||||||||||||||||||||||||||||||||||||||
2018 STATISTICAL LEADERS |
2018 GAME BY GAME STATS |
 |
2018 SCHEDULE |
2017 RESULTS |
|||||||||||||||||||||||||||||||||||||||||||||||||||||||||||||||||||||||||||||||||||||||||||||||||||||||||||||||||||||||||||||||||||||||||||||||||||||||||||||||||||||||||||||||||||||||||||||||||||||||||||||||||||||||||||||||||||||||||||||||||||||
|
|
|||||||||||||||||||||||||||||||||||||||||||||||||||||||||||||||||||||||||||||||||||||||||||||||||||||||||||||||||||||||||||||||||||||||||||||||||||||||||||||||||||||||||||||||||||||||||||||||||||||||||||||||||||||||||||||||||||||||||||||||||||||
2017 STATISTICAL LEADERS |
2017 GAME BY GAME STATS |
 |
2017 SCHEDULE |
2016 RESULTS |
||||||||||||||||||||||||||||||||||||||||||||||||||||||||||||||||||||||||||||||||||||||||||||||||||||||||||||||||||||||||||||||||||||||||||||||||||||||||||||||||||||||||||||||||||||||||||||||||||||||||||||||||||||||||||||||||
|
|
||||||||||||||||||||||||||||||||||||||||||||||||||||||||||||||||||||||||||||||||||||||||||||||||||||||||||||||||||||||||||||||||||||||||||||||||||||||||||||||||||||||||||||||||||||||||||||||||||||||||||||||||||||||||||||||||
2016 STATISTICAL LEADERS |
2016 GAME BY GAME STATS |
 |
2015 STATISTICAL LEADERS |
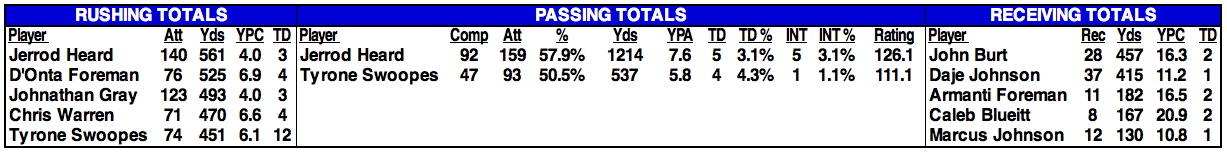
2015 GAME BY GAME STATS |
 |
2015 SCHEDULE |
2014 RESULTS |
|||||||||||||||||||||||||||||||||||||||||||||||||||||||||||||||||||||||||||||||||||||||||||||||||||||||||||||||||||||||||||||||||||||||||||||||||||||||||||||||||||||||||||||||||||||||||||||||||||||||||||||||||||||||||||||||||||||||||||||||
|
|
|||||||||||||||||||||||||||||||||||||||||||||||||||||||||||||||||||||||||||||||||||||||||||||||||||||||||||||||||||||||||||||||||||||||||||||||||||||||||||||||||||||||||||||||||||||||||||||||||||||||||||||||||||||||||||||||||||||||||||||||
2014 STATISTICAL LEADERS |
2014 GAME BY GAME STATS |
 |
2013 STATISTICAL LEADERS |
| Player | Att | Yds | YPC | TD | Player | Comp | Att | % | Yds | YPA | TD | INT | Rating | Player | Rec | Yds | YPC | TD |
| Malcolm Brown | 214 | 904 | 4.2 | 9 | Case McCoy | 187 | 329 | 56.8% | 1933 | 5.9 | 11 | 13 | 109.3 | Mike Davis | 51 | 727 | 14.3 | 8 |
| Jonathan Gray | 159 | 780 | 4.9 | 4 | David Ash | 53 | 87 | 60.9% | 760 | 8.7 | 7 | 2 | 156.3 | Jaxon Shipley | 56 | 589 | 10.5 | 1 |
| Joe Bergeron | 73 | 362 | 5.0 | 4 | Jaxon Shipley | 1 | 1 | 100.0% | 43 | 43.0 | 0 | 0 | 461.2 | Kendal Sanders | 37 | 361 | 9.8 | 1 |
2013 GAME BY GAME STATS |
 |
2013 RESULTS |
2012 RESULTS |
|||||||||||||||||||||||||||||||||||||||||||||||||||||||||||||||||||||||||||||||||||||||||||||||||||||||||||||||||||||||||||||||||||||||||||||||||||||||||||||||||||||||||||||||||||||||||||||||||||||||||||||||||||||||||||||||||||||||||||||||||||||||||||||||||||||||||||||||||||||||
|
|
|||||||||||||||||||||||||||||||||||||||||||||||||||||||||||||||||||||||||||||||||||||||||||||||||||||||||||||||||||||||||||||||||||||||||||||||||||||||||||||||||||||||||||||||||||||||||||||||||||||||||||||||||||||||||||||||||||||||||||||||||||||||||||||||||||||||||||||||||||||||
2012 STATISTICAL LEADERS |
| Player | Att | Yds | YPC | TD | Player | Comp | Att | % | Yds | YPA | TD | INT | Rating | Player | Rec | Yds | YPC | TD | ||
| Johnathan Gray | 149 | 702 | 4.7 | 3 | David Ash | 212 | 316 | 67.1% | 2679 | 8.5 | 19 | 8 | 153.1 | Mike Davis | 57 | 943 | 16.5 | 7 | ||
| Joe Bergeron | 126 | 569 | 4.5 | 16 | Case McCoy | 53 | 75 | 70.7% | 680 | 9.1 | 6 | 3 | 165.2 | Jaxon Shipley | 59 | 737 | 12.5 | 6 | ||
| Malcolm Brown | 58 | 324 | 5.6 | 4 | Jaxon Shipley | 0 | 3 | 0.0% | 0 | 0.0 | 0 | 0 | 0.0 | Marquise Goodwin | 25 | 299 | 12.0 | 3 |
| 2012 INDIVIDUAL PLAYER STATS • 2012 START CHART/STARTERS LOST |
|---|
2012 GAME BY GAME STATS |
 |
2011 STATISTICAL LEADERS |
| Player | Att | Yds | YPC | TD | Player | Comp | Att | % | Yds | YPA | TD | INT | Rating | Player | Rec | Yds | YPC | TD | ||
| Malcolm Brown | 172 | 742 | 4.3 | 5 | David Ash | 100 | 176 | 56.8% | 1075 | 6.1 | 4 | 8 | 106.5 | Mike Davis | 45 | 609 | 13.5 | 1 | ||
| Joe Bergeron | 72 | 461 | 6.4 | 5 | Case McCoy | 89 | 143 | 62.2% | 1045 | 7.3 | 7 | 4 | 134.2 | Jaxon Shipley | 44 | 607 | 13.8 | 3 | ||
| Fozzy Whittaker | 66 | 386 | 5.8 | 6 | Garret Gilbert | 15 | 31 | 48.4% | 247 | 8.0 | 1 | 2 | 113.1 | Marquise Goodwin | 34 | 429 | 12.6 | 2 |
| 2011 Individual Player Stats • 2011 START CHARTS/STARTERS LOST |
|---|
2011 GAME BY GAME STATS |
2011 RESULTS |
2010 RESULTS |
||||||||||||||||||||||||||||||||||||||||||||||||||||||||||||||||||||||||||||||||||||||||||||||||||||||||||||||||||||||||||||||||||||||||||||||||||||||||||||||||||||||||||||||||||||||
|
|
||||||||||||||||||||||||||||||||||||||||||||||||||||||||||||||||||||||||||||||||||||||||||||||||||||||||||||||||||||||||||||||||||||||||||||||||||||||||||||||||||||||||||||||||||||||
2010 STATISTICAL LEADERS |
| Player | Att | Yds | YPC | TD | Player | Comp | Att | % | Yds | YPA | TD | INT | Rating | Player | Rec | Yds | YPC | TD | ||
| Cody Johnson | 133 | 591 | 4.44 | 6 | Garrett Gilbert | 260 | 443 | 58.7% | 2743 | 6.2 | 10 | 17 | 110.5 | James Kirkendoll | 52 | 707 | 13.6 | 2 | ||
| Garrett Gilbert | 99 | 384 | 3.88 | 5 | F Whittaker | 2 | 2 | 100.0% | 40 | 20.0 | 0 | 0 | 268.0 | Mike Davis | 47 | 479 | 10.2 | 2 | ||
| Foswhitt Whittaker | 82 | 353 | 4.30 | 2 | Case McCoy | 0 | 1 | 0.0% | 0 | 0.0 | 0 | 0 | 0.0 | John Chiles | 29 | 417 | 14.4 | 1 |
| 2010 Individual Player Stats |
|---|
2010 GAME BY GAME STATS |
2009 STATISTICAL LEADERS |
| Player | Att | Yds | YPC | TD | Player | Comp | Att | % | Yds | YPA | TD | INT | Rating | Player | Rec | Yds | YPC | TD | ||
| Tre' Newton | 102 | 513 | 5.03 | 6 | Colt McCoy | 330 | 468 | 70.5% | 3512 | 7.5 | 27 | 12 | 147.5 | Jordan Shipley | 106 | 1363 | 12.9 | 11 | ||
| Colt McCoy | 128 | 348 | 2.72 | 3 | Garrett Gilbert | 15 | 26 | 57.7% | 124 | 4.8 | 0 | 0 | 97.8 | M Williams | 38 | 546 | 14.4 | 2 | ||
| Cody Johnson | 84 | 333 | 3.96 | 12 | Team | 0 | 4 | 0.0% | 0 | 0.0 | 0 | 0 | 0.0 | J Kirkendoll | 48 | 461 | 9.6 | 6 |
| 2009 Individual Player Stats |
|---|
2009 GAME BY GAME STATS |
2009 RESULTS |
2008 RESULTS |
||||||||||||||||||||||||||||||||||||||||||||||||||||||||||||||||||||||||||||||||||||||||||||||||||||||||||||||||||||||||||||||||||||||||||||||||||||||||||||||||
|
|
||||||||||||||||||||||||||||||||||||||||||||||||||||||||||||||||||||||||||||||||||||||||||||||||||||||||||||||||||||||||||||||||||||||||||||||||||||||||||||||||
| 2008 Individual Player Stats • 2007 Individual Player Stats |
|---|