
| UTEP MINERS |
|---|
|
STADIUM: Sun Bowl PLAYING SURFACE: Classic HD CoolPlay • CAPACITY: 51,500 STARTERS RETURNING (O/D): 8*/7 LETTERMAN RETURNING: 38 (15,21,2) • LETTERMAN LOST: 27 (12,14,1) |
 |
|
| LOCATION: El Paso, TX | |
| FOUNDED: 1914 | |
| ENROLLMENT: 21,646 | |
| COLORS: Dark Blue, Orange & Silver Accent |
|
| MASCOT: Paydirt Pete | |
| CONFERENCE: CUSA | |
| HEAD COACH: Dana Dimel | |
| YRS WITH TM: 6th | |
| OVERALL RECORD: 47-79 | |
| RECORD W/TM: 17-40 | |
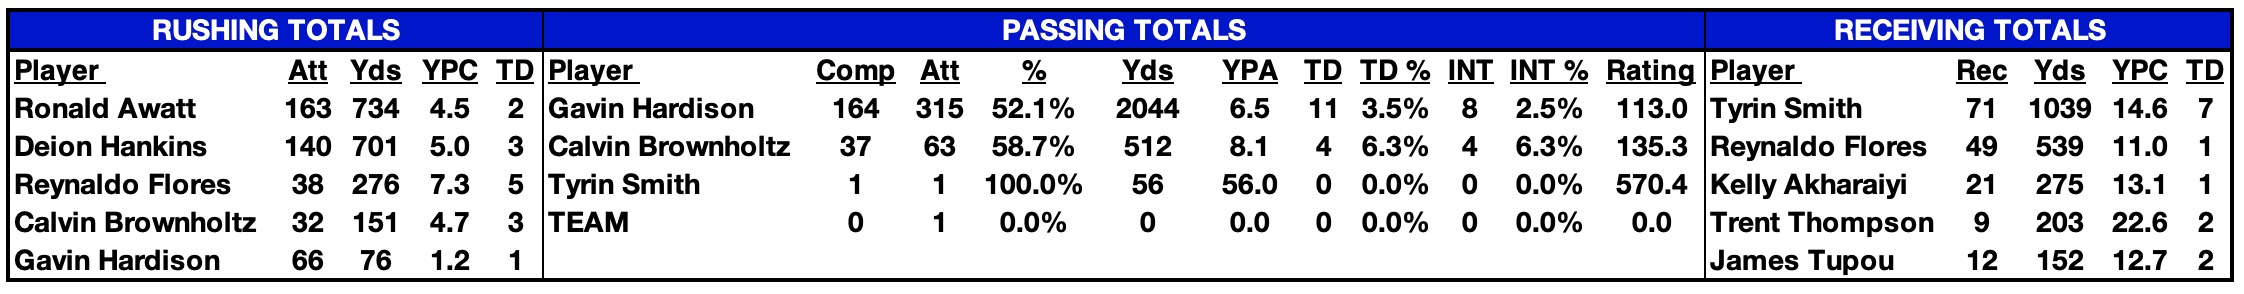
| 2023 STATISTICAL LEADERS |
|---|
|
|---|
2023 SCHEDULE |
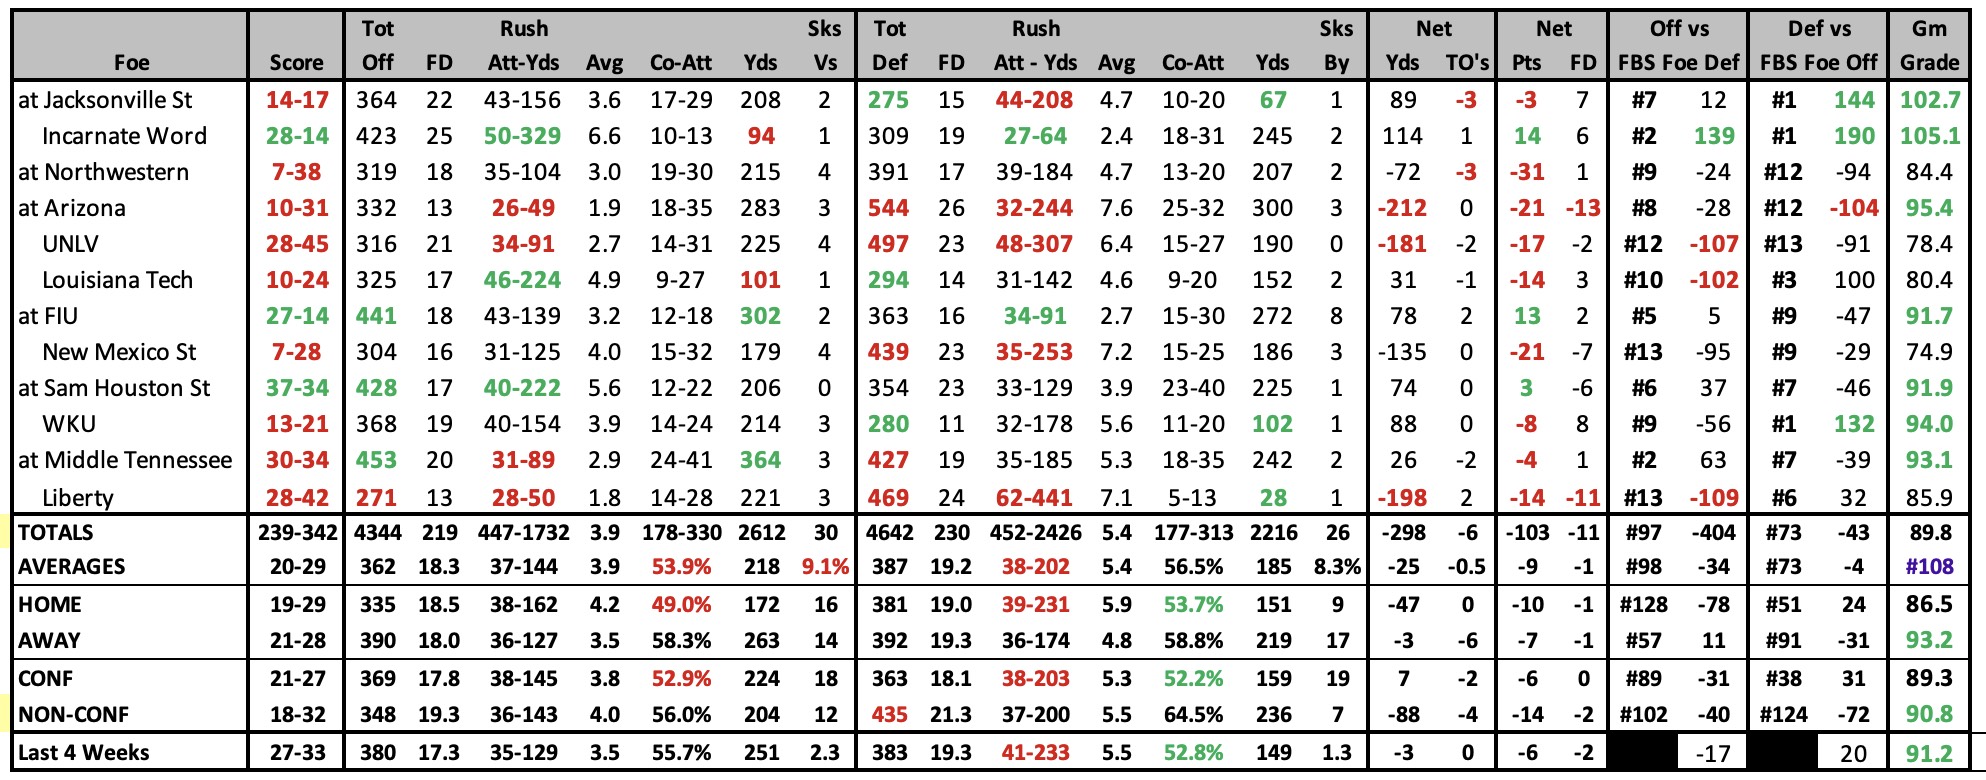
2022 RESULTS |
||||||||||||||||||||||||||||||||||||||||||||||||||||||||||||||||||||||||||||||||||||||||||||||||||||||||||||||||||||||||||||||||||||||||||||||||||||||||||||||||||||||||||||||||||||||||||||||||
|
|
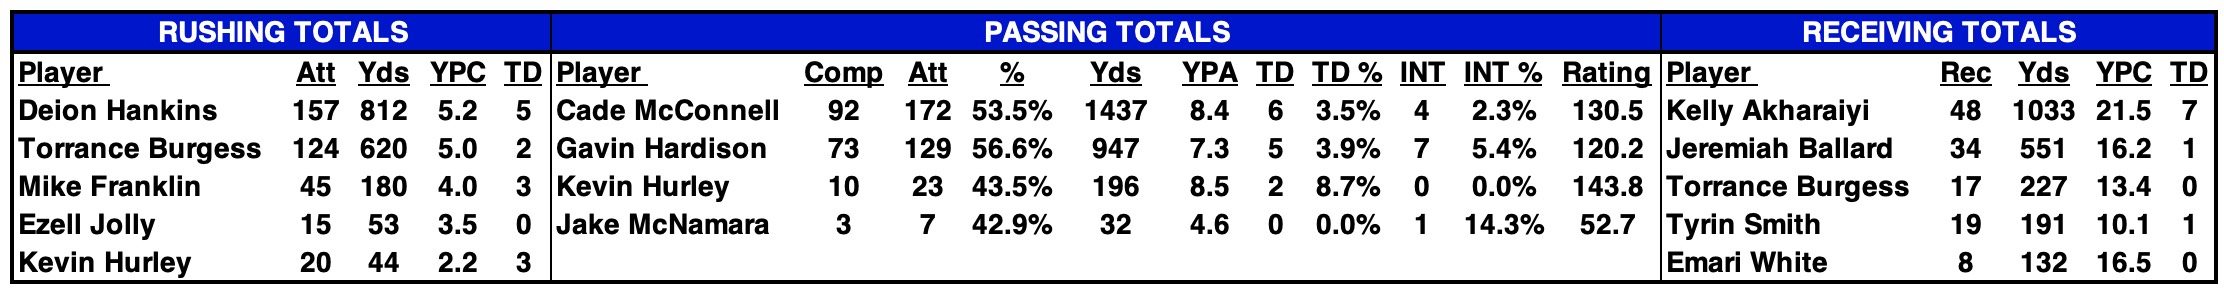
| 2022 STATISTICAL LEADERS |
|---|
|
|---|
2022 SCHEDULE |
2021 RESULTS |
||||||||||||||||||||||||||||||||||||||||||||||||||||||||||||||||||||||||||||||||||||||||||||||||||||||||||||||||||||||||||||||||||||||||||||||||||||||||||||||||||||||||||||||||||||||||||||||||||||||
|
|
||||||||||||||||||||||||||||||||||||||||||||||||||||||||||||||||||||||||||||||||||||||||||||||||||||||||||||||||||||||||||||||||||||||||||||||||||||||||||||||||||||||||||||||||||||||||||||||||||||||
| 2021 STATISTICAL LEADERS |
|---|
|
|---|
2021 SCHEDULE |
2020 RESULTS |
||||||||||||||||||||||||||||||||||||||||||||||||||||||||||||||||||||||||||||||||||||||||||||||||||||||||||||||||||||||||||||||||||||||||||||||||||||||||||||||||||||||||||||||||||||||||||||||||
|
|
||||||||||||||||||||||||||||||||||||||||||||||||||||||||||||||||||||||||||||||||||||||||||||||||||||||||||||||||||||||||||||||||||||||||||||||||||||||||||||||||||||||||||||||||||||||||||||||||
| 2020 STATISTICAL LEADERS |
|---|
|
|---|
2020 SCHEDULE |
2019 RESULTS |
||||||||||||||||||||||||||||||||||||||||||||||||||||||||||||||||||||||||||||||||||||||||||||||||||||||||||||||||||||||||||||||||||||||||||||||||||||||||||||||||||||||||||||||||||||||||||
|
|
| 2019 STATISTICAL LEADERS |
|---|
|
|---|
2019 SCHEDULE |
2018 RESULTS |
|||||||||||||||||||||||||||||||||||||||||||||||||||||||||||||||||||||||||||||||||||||||||||||||||||||||||||||||||||||||||||||||||||||||||||||||||||||||||||||||||||||||||||||||||||||||||||||||||||||||||
|
|
| 2018 STATISTICAL LEADERS |
|---|
| 2018 GAME-BY-GAME STATS |
|---|
 |
2018 SCHEDULE |
2017 RESULTS |
||||||||||||||||||||||||||||||||||||||||||||||||||||||||||||||||||||||||||||||||||||||||||||||||||||||||||||||||||||||||||||||||||||||||||||||||||||||||||||||||||||||||||||||||||||||||||||||||||||||||||||||||||
|
|
||||||||||||||||||||||||||||||||||||||||||||||||||||||||||||||||||||||||||||||||||||||||||||||||||||||||||||||||||||||||||||||||||||||||||||||||||||||||||||||||||||||||||||||||||||||||||||||||||||||||||||||||||
| 2017 STATISTICAL LEADERS |
|---|
| 2017 GAME-BY-GAME STATS |
|---|
 |
2017 SCHEDULE |
2016 RESULTS |
||||||||||||||||||||||||||||||||||||||||||||||||||||||||||||||||||||||||||||||||||||||||||||||||||||||||||||||||||||||||||||||||||||||||||||||||||||||||||||||||||||||||||||||||||||||||||||||||||||||||||||||||||
|
|
||||||||||||||||||||||||||||||||||||||||||||||||||||||||||||||||||||||||||||||||||||||||||||||||||||||||||||||||||||||||||||||||||||||||||||||||||||||||||||||||||||||||||||||||||||||||||||||||||||||||||||||||||
| 2016 STATISTICAL LEADERS |
|---|
| 2016 GAME-BY-GAME STATS |
|---|
 |
| 2015 STATISTICAL LEADERS |
|---|
| 2015 GAME-BY-GAME STATS |
|---|
 |
2015 SCHEDULE |
2014 RESULTS |
||||||||||||||||||||||||||||||||||||||||||||||||||||||||||||||||||||||||||||||||||||||||||||||||||||||||||||||||||||||||||||||||||||||||||||||||||||||||||||||||||||||||||||||||||||||||||||||||||||||||||||||||||||||||||||||||||||||||||||||
|
|
||||||||||||||||||||||||||||||||||||||||||||||||||||||||||||||||||||||||||||||||||||||||||||||||||||||||||||||||||||||||||||||||||||||||||||||||||||||||||||||||||||||||||||||||||||||||||||||||||||||||||||||||||||||||||||||||||||||||||||||
| 2014 STATISTICAL LEADERS |
|---|
| 2014 GAME-BY-GAME STATS |
|---|
 |
| 2013 STATISTICAL LEADERS |
|---|
| Player | Att | Yds | YPC | TD | Player | Comp | Att | % | Yds | YPA | TD | INT | Rating | Player | Rec | Yds | YPC | TD |
| Aaron Jones | 155 | 811 | 5.2 | 4 | Jameill Showers | 107 | 188 | 56.9% | 1263 | 6.7 | 11 | 4 | 128.4 | Jordan Leslie | 44 | 612 | 13.9 | 7 |
| Nathan Jeffery | 133 | 532 | 4.0 | 5 | Mack Leftwich | 44 | 75 | 58.7% | 458 | 6.1 | 2 | 2 | 113.4 | Ian Hamilton | 25 | 354 | 14.2 | 1 |
| Jameill Showers | 61 | 192 | 3.1 | 4 | Blaire Sullivan | 15 | 26 | 57.7% | 183 | 7.0 | 1 | 4 | 98.7 | Eric Tomlinson | 30 | 304 | 10.1 | 1 |
| 2013 GAME-BY-GAME STATS |
|---|
 |
2013 RESULTS |
2012 RESULTS |
||||||||||||||||||||||||||||||||||||||||||||||||||||||||||||||||||||||||||||||||||||||||||||||||||||||||||||||||||||||||||||||||||||||||||||||||||||||||||||||||||||||||||||||||||||||||||||||||||||||||||||||||||||||||||||||||||||||||||||||||||||||||||||||||
|
|
||||||||||||||||||||||||||||||||||||||||||||||||||||||||||||||||||||||||||||||||||||||||||||||||||||||||||||||||||||||||||||||||||||||||||||||||||||||||||||||||||||||||||||||||||||||||||||||||||||||||||||||||||||||||||||||||||||||||||||||||||||||||||||||||
| 2012 STATISTICAL LEADERS |
|---|
| Player | Att | Yds | YPC | TD | Player | Comp | Att | % | Yds | YPA | TD | INT | Rating | Player | Rec | Yds | YPC | TD | ||
| Nathan Jeffery | 185 | 896 | 4.8 | 7 | Nick Lamaison | 126 | 252 | 50.0% | 1686 | 6.7 | 12 | 7 | 116.4 | Jordan Leslie | 51 | 973 | 19.1 | 6 | ||
| Blaire Sullivan | 59 | 240 | 4.1 | 2 | Carson Meger | 46 | 76 | 60.5% | 504 | 6.6 | 1 | 3 | 112.7 | Michael Edwards | 51 | 820 | 16.1 | 9 | ||
| LaQuintus Dowell | 32 | 166 | 5.2 | 0 | Blaire Sullivan | 21 | 43 | 48.8% | 390 | 9.1 | 2 | 1 | 135.7 | Craig Wenrick | 12 | 150 | 12.5 | 1 |
| 2012 Individual Player Stats • 2012 Start Chart/Starters Lost |
|---|
| 2012 GAME-BY-GAME STATS |
|---|
 |
| 2011 STATISTICAL LEADERS |
|---|
| Player | Att | Yds | YPC | TD | Player | Comp | Att | % | Yds | YPA | TD | INT | Rating | Player | Rec | Yds | YPC | TD | ||
| Joe Banyard | 127 | 832 | 6.6 | 6 | Nick Lamaison | 130 | 223 | 58.3% | 1718 | 7.7 | 12 | 10 | 131.8 | Mike Edwards | 50 | 657 | 13.1 | 3 | ||
| Vernon Frazier | 61 | 434 | 7.1 | 3 | Carson Meger | 71 | 112 | 63.4% | 669 | 6.0 | 2 | 5 | 110.5 | Donavon Kemp | 23 | 456 | 19.8 | 1 | ||
| Leilyon Myers | 106 | 368 | 3.5 | 12 | Jay Hall | 20 | 55 | 36.4% | 281 | 5.1 | 0 | 2 | 72.0 | Jordan Leslie | 30 | 430 | 14.3 | 2 |
| 2011 Individual Player Stats • 2011 Start Chart/ Starters Lost |
|---|
| 2011 GAME-BY-GAME STATS |
|---|
2011 RESULTS |
2010 RESULTS |
||||||||||||||||||||||||||||||||||||||||||||||||||||||||||||||||||||||||||||||||||||||||||||||||||||||||||||||||||||||||||||||||||||||||||||||||||||||||||||||||||||||||
|
|
||||||||||||||||||||||||||||||||||||||||||||||||||||||||||||||||||||||||||||||||||||||||||||||||||||||||||||||||||||||||||||||||||||||||||||||||||||||||||||||||||||||||
| 2010 STATISTICAL LEADERS |
|---|
| Player | Att | Yds | YPC | TD | Player | Comp | Att | % | Yds | YPA | TD | INT | Rating | Player | Rec | Yds | YPC | TD | ||
| Joe Banyard | 109 | 623 | 5.72 | 8 | Trevor Vittatoe | 220 | 407 | 54.1% | 2756 | 6.8 | 22 | 13 | 122.4 | Kris Adams | 47 | 1070 | 22.8 | 14 | ||
| Donald Buckram | 81 | 335 | 4.14 | 1 | James Thomas | 6 | 15 | 40.0% | 135 | 9.0 | 1 | 0 | 137.6 | Marlon McClure | 30 | 343 | 11.4 | 1 | ||
| Vernon Frazier | 38 | 231 | 6.08 | 2 | Carson Meger | 1 | 3 | 33.3% | 10 | 3.3 | 0 | 0 | 61.3 | Evan Davis | 24 | 292 | 12.2 | 3 |
| 2010 GAME-BY-GAME STATS |
|---|
| 2009 STATISTICAL LEADERS |
|---|
| Player | Att | Yds | YPC | TD | Player | Comp | Att | % | Yds | YPA | TD | INT | Rating | Player | Rec | Yds | YPC | TD | ||
| Donald Buckram | 259 | 1594 | 6.15 | 18 | Trevor Vittatoe | 224 | 408 | 54.9% | 3308 | 8.1 | 17 | 13 | 130.4 | Jeff Moturi | 53 | 974 | 18.4 | 4 | ||
| Jason Williams | 40 | 126 | 3.15 | 5 | James Thomas | 2 | 3 | 66.7% | 12 | 4.0 | 0 | 0 | 100.3 | Kris Adams | 42 | 580 | 13.8 | 2 | ||
| Marlon McClure | 7 | 75 | 10.71 | 0 | Kyle Wright | 3 | 8 | 37.5% | 11 | 1.4 | 0 | 0 | 49.1 | Donald Buckram | 30 | 453 | 15.1 | 3 |
| 2009 Individual Player Stats |
|---|
| 2009 GAME-BY-GAME STATS |
|---|
2009 RESULTS |
2008 RESULTS |
|||||||||||||||||||||||||||||||||||||||||||||||||||||||||||||||||||||||||||||||||||||||||||||||||||||||||||||||||||||||||||||||||||||||||||||||||
|
|
|||||||||||||||||||||||||||||||||||||||||||||||||||||||||||||||||||||||||||||||||||||||||||||||||||||||||||||||||||||||||||||||||||||||||||||||||
| 2008 Individual Player Stats • 2007 Individual Player Stats |
|---|