| Daily Blog • December 28th |
|---|
Jump To: Independence Bowl • Russell Athletic Bowl • Meineke Car Care Bowl
|
|||||||||
Ohio vs ULM |
|||||||||
Rushing |
Passing |
Points |
TO’s |
ST |
A.O.R |
||||
| OHIO (8-4) | 151 | 234 |
26 |
+14 |
– |
92.1 | |||
| ULM (8-4) | 173 |
274 |
38 |
+8 |
••• |
98.4 | |||
2:00 pm • ESPN • Independence Stadium • Shreveport, LA |
|||||||||
First meeting. This is Ohio’s 7th all-time bowl appearance and 5th in HC Solich’s 8 years. Solich is now 3-6 in bowls and he led OU to its 1st ever bowl win in last year’s Idaho Potato Bowl. Ohio was 1-3 vs bowl teams this year, getting outscored 30-18 and outgained 401-391. Ohio has played my #123 schedule. HC Berry takes ULM to its 1st ever bowl game in his 3rd season. This is also Berry’s first bowl as an HC. ULM was 2-3 vs bowl elig teams this year, being outscored 38-33 and outgained 489-457. The Warhawks have played my #86 schedule.
Both teams due to injuries kind of faded down the stretch after they were the talk of the country among non-BCS teams in September. The similarities don't end there as both have experienced QB's and have two of the more underrated coaches in the country. This should be a high scoring entertaining game but in the end, I think the crowd edge along with the added mobility of ULM QB Browning will eventually lead the Warhawks to the win. |
|||||||||
PHIL’S FORECAST: ULM 35 OHIO 27 |
|||||||||
|
|||||||||
Rutgers vs Virginia Tech |
|||||||||
Rushing |
Passing |
Points |
TO’s |
ST |
A.O.R |
||||
| RUTGERS (9-3) | 107 | 154 |
19 |
+9 |
•• |
99.1 | |||
| VIRGINIA TECH (6-6) | 99 |
223 |
17 |
-4 |
– |
103.8 | |||
5:30 pm • ESPN • Florida Citrus Bowl • Orlando, FL |
|||||||||
In the driver’s seat for their first berth into a BCS bowl game, the Knights lost their final 2 games including a home matchup vs Louisville in the season finale to fall to here. This marks the 2nd consecutive trip to a bowl for Rutgers but the 1st under new HC Kyle Flood who was on this staff previously with Greg Schiano. The Scarlet Knights have played my #90 ranked schedule. VT saw its FBS leading streak of 8 straight 10 win seasons come to an end this year as the 6 losses are their most since ‘92! They barely squeaked by rival Virginia 17-14 just to gain bowl eligibility. Beamer is 8-11 in bowls. The Hokies have played my #47 ranked schedule.
Traditionally winning BCS programs that are 6-6, such as the Hokies, have a lot to play for to finish with a winning record. Rutgers has been an excellent bowl team in the past but the HC that got them those wins is now in the NFL. Let’s take a look at how these teams finished down the stretch. Rutgers was -46 ypg vs the #49 schedule and only avg’d 15 ppg while VT was +85 ypg vs the #36 schedule. While VT is a formidable foe, Rutgers players were thinking they were BCS bound going into their final game and look for VT to come away with the win here. |
|||||||||
PHIL’S FORECAST: VIRGINIA TECH 20 RUTGERS 17 |
|||||||||
|
|||||||||
Minnesota vs Texas Tech |
|||||||||
Rushing |
Passing |
Points |
TO’s |
ST |
A.O.R |
||||
| MINNESOTA (6-6) | 143 | 109 |
19 |
-3 |
– |
102.0 | |||
| TEXAS TECH (7-5) | 130 |
327 |
34 |
-12 |
• |
105.7 | |||
9:00 pm • ESPN • Reliant Stadium • Houston, TX |
|||||||||
This is the 2nd ever meeting between the schools with the first a 44-41 OT win for TT in the ‘06 Insight Bowl. In that game, the Raiders posted the biggest comeback in NCAA bowl history after trailing by 31 points in the 3Q which prompted UM to fire HC Mason. Minny has never been to this bowl but TT beat Navy 38-14 here in ‘03. UM HC Jerry Kill is 0-2 in bowls although he was 4-5 in the FCS playoffs at S IL. Raiders HC Tuberville was 7-3 in bowls in his career but shockingly left TT for the Cincy job and OL Chris Thomsen takes over for this one. Minny was 2-5 vs bowl squads this year being outscored 28-18 and outgained 386-274. TT was 3-5 being outscored 40-24 despite outgaining foes 457-438.
Minnesota showed its struggles down the stretch as they totaled only 283 yards and 18 FD’s in their final 2 games. Now their frosh QB plays in the bowl vs a secondary which is seasoned playing against Big 12 QB’s. TT’s offense hasn’t been slowed this year and while the D allowed 111 points its last 2 games, it was vs my #5 and #3 offenses and UM ranks my #106. |
|||||||||
PHIL’S FORECAST: TEXAS TECH 38 MINNESOTA 21 |
|||||||||


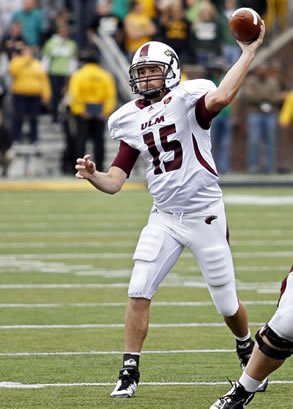
 ULM was the early season media darling after knocking off Arkansas and falling to Auburn in OT to open the season. The offense started on fire as the Warhawks had 500 or more yards of total off in 4 of their first 5 games. QB Browning is clearly the most important player on the team as he was injured early on vs Louisiana and missed Arkansas St, which were ULM’s 2 most lopsided defeats. Not only did he finish with a fantastic 27-7 ratio, but he is also the team’s leading rusher and finished #21 in the FBS in total offense. His favorite target is Leonard, who caught 7+ passes in 9 games, including 4 with 10+. His 97 rec’s ranks #6 in the FBS. ULM is down to its #3 RB from the start of training camp and Washington is avg just 33 rush ypg (3.3) since taking over the job. The OL avg 6’3” 301 with just 1 Sr starter and while their rush ypg dropped slightly from 153 (3.9) last year to 146 (4.3) this year their sacks allowed decreased from 34 (7.2%) to 22 (4.4%) this year. Overall ULM has my #71 offense. When team leader LB Cameron Blakes was lost for the season, things didn’t look good, but fellow LB RJ Young has responded well in becoming the leader of the D. My #81 D has struggled recently, however, as after allowing 352 total ypg the first 6, the Warhawks have been giving up 463 total ypg the last 6 including 607 vs UL! ULM has my #76 pass eff D, the worst under Berry, allowing 62% completions and a 27-15 ratio. ULM has my #43 ST’s unit, which is easily the highest it’s ever been. K Manton has attempted only 8 FG’s all season, as ULM’s efficient offense tends to put the ball into the EZ, especially when Browning is under center.
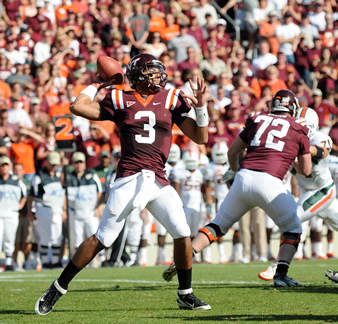
 Despite entering the season with an inexperienced offense, VT did bring back a legit Heisman candidate in QB Logan Thomas, but he has been a disappointment and the Hokies have struggled (my #65 unit). Thomas has just about the same amount of pass yards and td’s as last year, but his completion % has fallen from 59.8% last year to just 52.6% this year. A major reason for the struggles is the lack of a dominant RB. With David Wilson departing early last year, VT has seen 3 different RB’s draw starts this year. A 3 game stretch vs Duke, Clemson, and Miami saw the running game come to life avg 230 ypg (5.2) but they couldn’t match the consistency over their final 3 games avg 138 ypg (2.9). The OL (6’5” 305) had just 1 returning starter entering the season but he was injured and has missed the last 5 games. Their numbers are down as expected as they are rushing for 158 ypg (4.0) this year vs 187 ypg (4.4) last year while allowing 5.3% sacks this year compared to 4.2% last year. The defense (#20) is led by LB Jack Tyler and has progressed as the season has gone along. During the 1st 5 games vs FBS foes VT was allowing 424 total ypg, but over their last 6 games, the defense has stiffened to allowing just 299 total ypg. They held 3 teams to their season lows in total off including Clemson, which had just 295 total yards. Overall their rush ypg allowed has increased from 104 (3.2) last year to 140 (3.8) this year while they still have a respectable #13 ranking in my pass eff D (#6 last year). VT’s ST’s or “Beamerball” has always been consistent and even that is significantly down this year as the Hokies have my #86 ST’s ranking, which is the worst since we started producing my rankings nearly 20 years ago! The bright spots have been PR Jarrett who is #8 in the NCAA avg 13.9 ypr while KR Knowles is #15 in the NCAA avg 28.3 ypr.
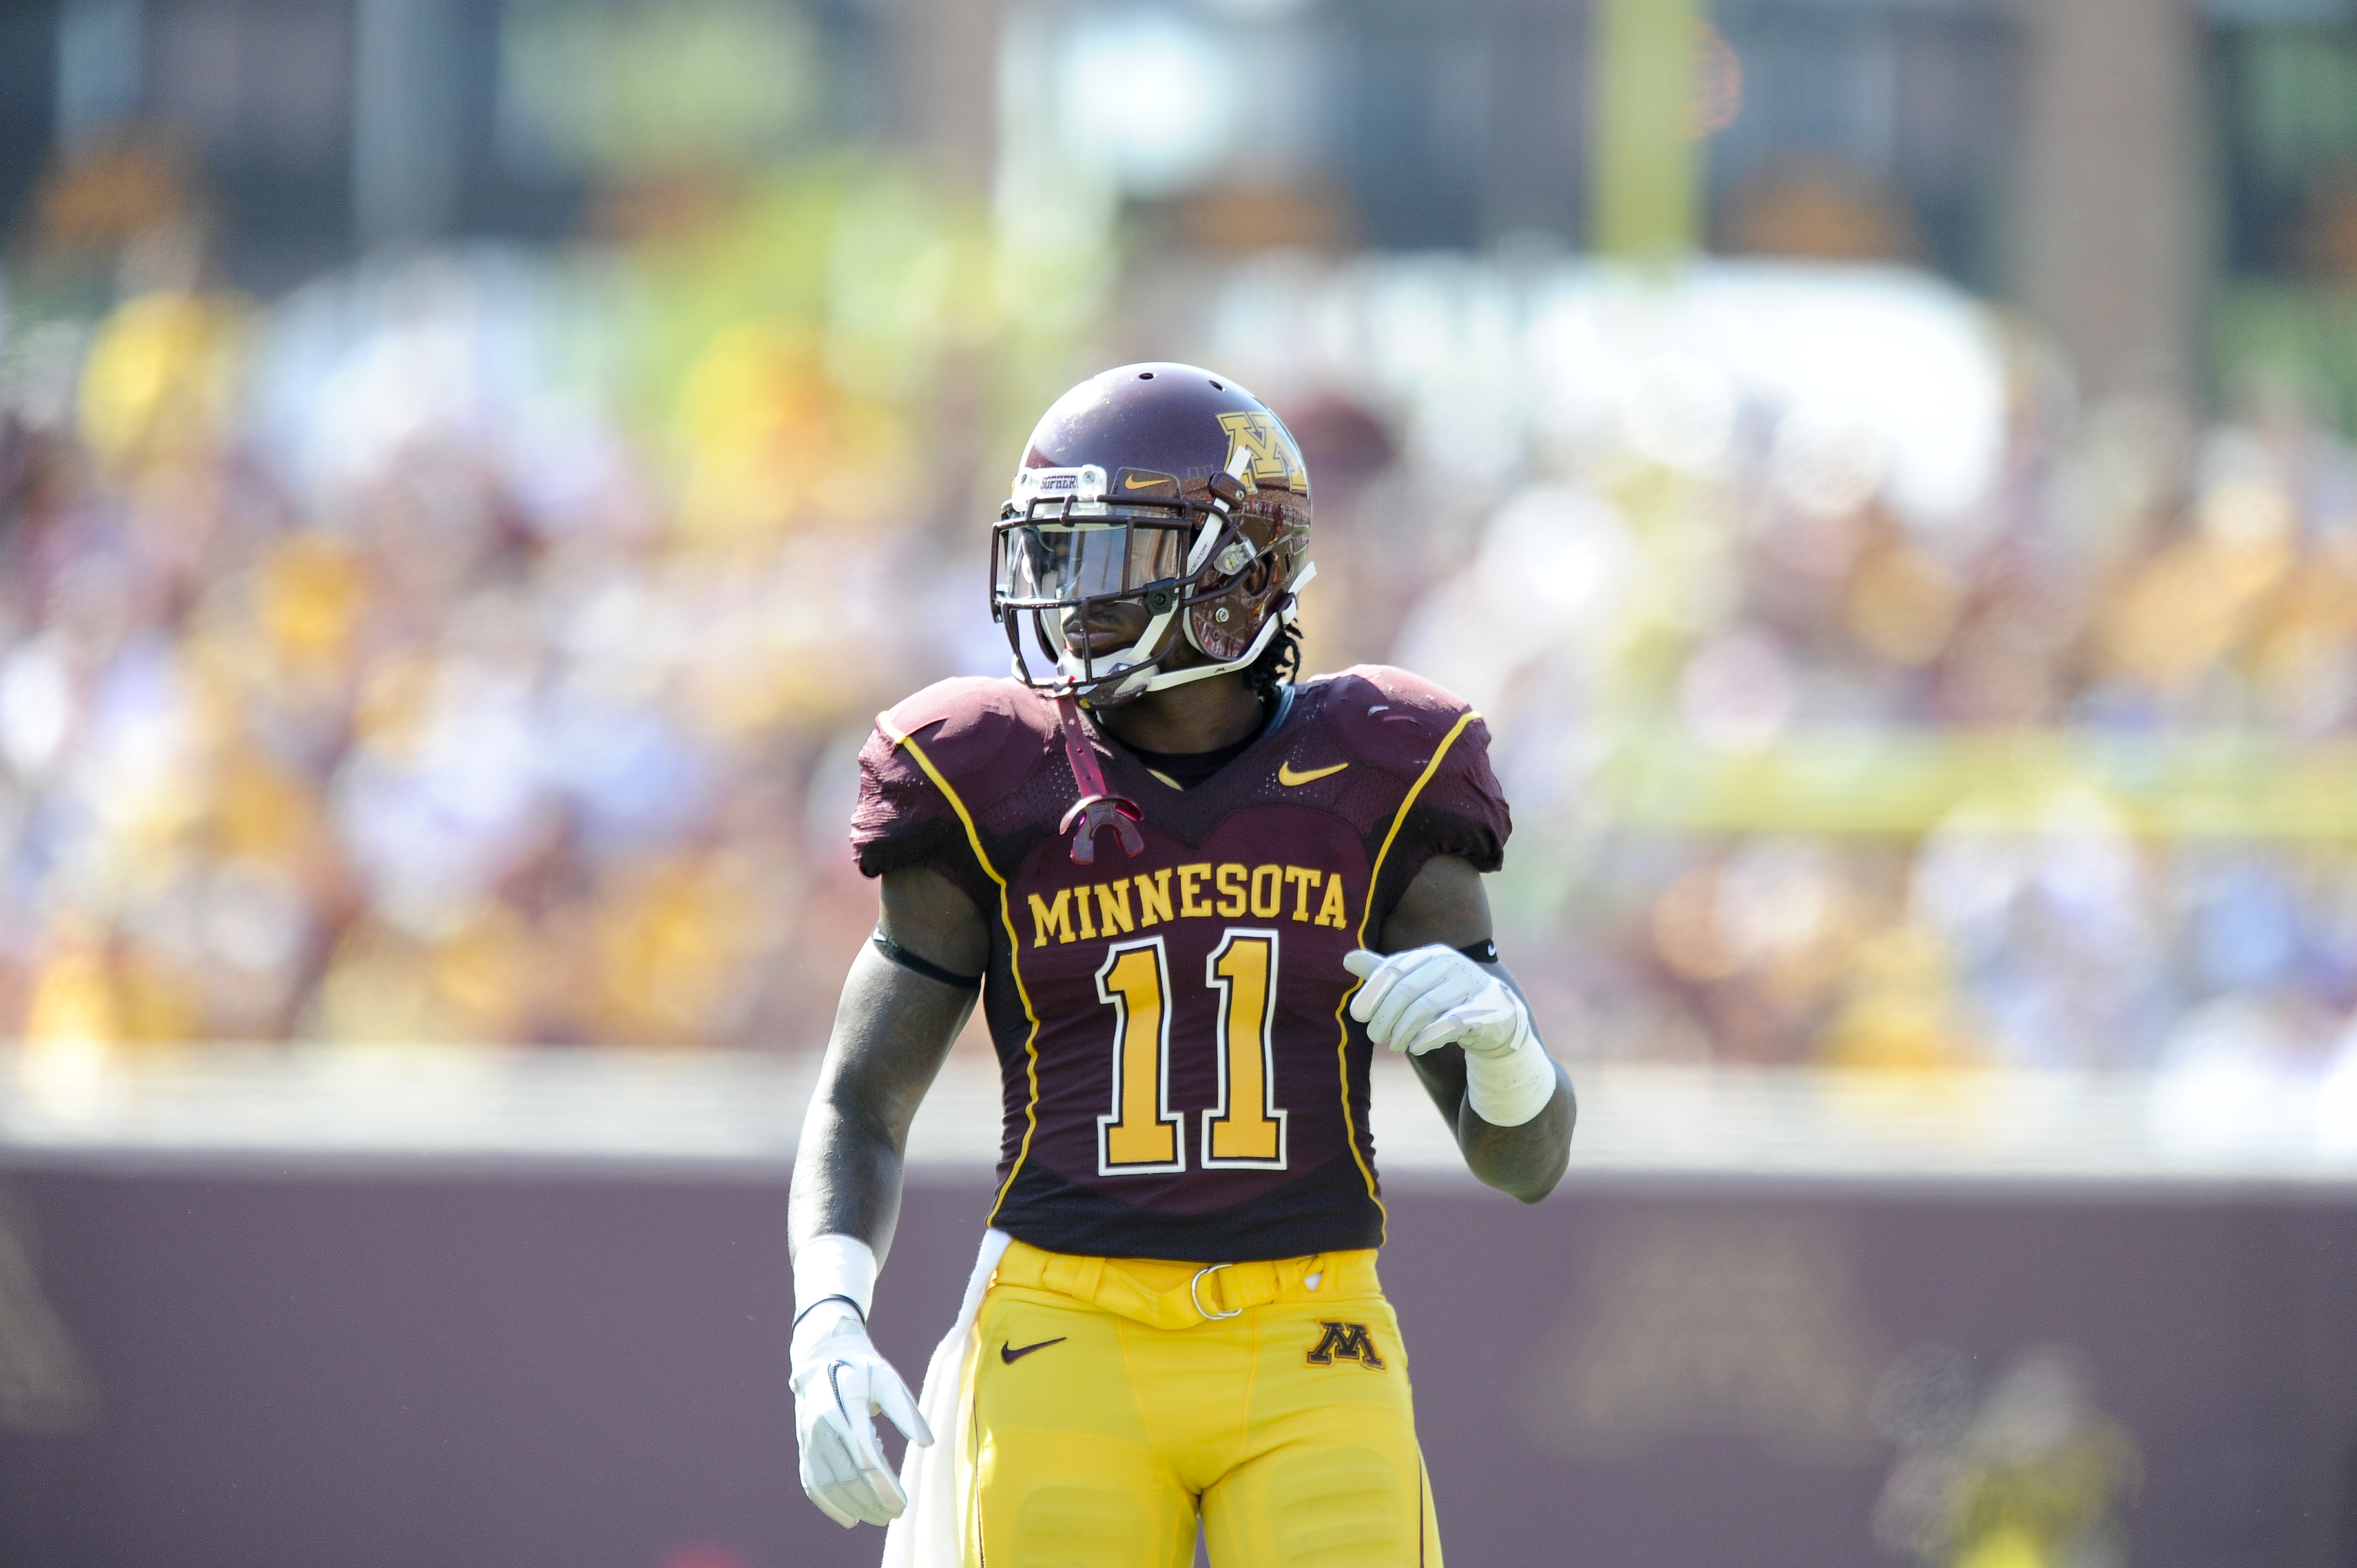
 UM began the season with a Sr starter in athletic 6’5” 250 Gray who QB’d the Gophers to wins in their first 2 before being suffering a high ankle sprain vs WM. Soph pocket QB Shortell finished the win throwing 3 td passes as UM’s 4 td tosses were their most in a game since ‘09. With Gray missing 2 games and his mobility limited, Shortell started the next 3, but the offense sputtered avg 327 ypg and 14 ppg. After back-to-back losses, Kill burned Nelson’s RS and moved Gray to WR. Nelson blistered Purdue for 283 yards and 4 td’s as the Gophers won 44-28 but struggled in the last 4 (85 ypg, 44%, 1-5) while Shortell transferred after the season. The run game relied on workhorse Kirkwood who still has a chance at becoming UM’s 1st 1,000 yard rusher since ‘06. After #1 rec Barker suffered an ankle inj vs Purdue and subsequently left the program, the Gophers pass game left with him. The team’s top WR Engel has just 267 (19.1). The OL (6’4” 304) suffered several injuries with only RT Campion starting every game at the same spot. UM has my #106 offense but my #46 D which is how they made it to the post season. The D improvement began up front as DE Wilhite finished #2 in the Big Ten with 8.5 sacks and keep in mind that the Gophers had 9 sacks as a team just 2Y ago. Last year’s top LB Tinsley shockingly died in the offssn so the team kept his spirit alive by rotating his #51 and Hill and Rallis led the unit in tackles. UM has my #32 pass eff D (179, 56%, 12-11) with CB Stoudermire leading the team in tackles. My #90 ST unit is led by Australian rugby specialist P Eldred. K Wettstein struggled hitting 13-21 FG’s although 3 misses were from 50+. The coverage units allow 17.9 on KR and 6.5 on PR.
  QB Doege had a strong start to the season with a 12-1 ratio after 3 games until he threw 3 int’s in the Oklahoma loss. He rebounded with 13 td passes in the next 2 games including the upset of then #5 WV and finished #15 in the FBS in pass eff. The run game had their best 3 game stretch in years to start the season in non-conf play but got bogged down vs tougher Big 12 competition avg 109 (3.8) in conference play. The WR unit struggled with injuries even though Moore and Ward combined for 1,922 yards (12.3) with 24 td’s. TE Amaro’s (ribs) absence in the final 6 games was continuously cited by Tuberville as a reason for their offensive struggles both running and passing. TT avg’d 41 ppg and 537 ypg in their first 6 games compared to 35 ppg and 466 ypg in the last 6. The OL (6’5” 313) allowed an impressive 18 sacks (3.2%) anchored by All-B12 LT Waddle. TT has my #17 offense and #53 D. The Raiders showed improvement under their 4th DC in the last 4 years in Art Kaufman. After a soft non-conference slate in which the Raiders were #1 in the FBS in total D (#114 last year) the grind of Big 12 play took its toll. The undersized DL (6’3” 269) is led by DT Hyder and DE Bush who combined for 24 tfl. TT mostly plays a 4-2-5 but the LB’s were a trouble spot with converted S Bullitt missing the final 2 after playing most of the year with an inj’d shoulder and the top LB tackler (Smith) had just 47. The Raiders are #45 in my pass eff D (196, 55%, 23-7) which is greatly improved from last year’s #102. S’s Davis and Johnson were the team’s top 2 tacklers but the Raiders missed top cover CB Douglas who didn’t play in 5 of the last 6 due to inj. In their 1-4 finish TT forced 0 TO’s with their 10 on the season ranking #118 in the FBS. My #77 ST’s unit needs work as they gave up several big plays for the 2nd season in a row including 2 blk’d P vs OSU. The coverage units allowed 21.0 on KR and 13.6 on PR with 2 td.