| Daily Blog •August 14, 2012 |
|---|
Turnovers can have a huge impact on games and on a team's season. They can also lead to many misleading final scores. During the season I list all of the previous week's misleading final scores on PhilSteele.com on my Monday Daily Blog. By reading about them each week you can uncover some underrated and overrated teams throughout the season. 
Here is a great example from last year. Utah benefitted from being +5 in TO's crushing their arch rival BYU 54-10 on the road, however the next week they were a 10 point home favorite vs Washington but were -4 in TO's and were beaten 31-14. Then the next week they were -5 in TO's to Arizona St and lost 35-14 at home!
In 2010 Iowa St benefitted in B2B weeks from a combined +8 in TO's beating Northern Iowa and Texas Tech by a combined 79-38. The next week they were even in TO's vs Utah and were pummeled at home losing 68-27.
West Virginia outgained Conn 414-278 and had a 24-16 FD edge but were -4 in TO's and lost 16-13. The next week they hammered Cincinnati 37-10 as a small favorite.
I could list many more examples, but as you can see, turnovers can determine the outcome of a gm. On my website, PhilSteele.com, I have many more examples listed. TO's can not only make a difference in a game but can make the difference between a winning and losing season.
Miami, Oh made this blog in B2B seasons. In 2010, they were my #1 "Going Up" team coming off a 1-11 season being -24 in turnovers. They finished 10-4 winning the MAC Championship. Last year they were listed as a "Going Down" team with +11 turnovers and as true to the formula fell back to 4-8.
Minnesota also made this blog in B2B seasons. In 2007 they were my #1 "Going Down" team coming off a 6-7 season being +18 in turnovers. They finished 1-11 and in 2008 were listed as a "Going Up" team with -15 turnovers. They did rebound and after just one win the previous year finished with a 7-5 reg season and earned a bowl bid.
Last year 18 teams were in the "Going Down" box and only 3 managed to slightly improve their records. The teams with the biggest drops offs were Maryland which went from 9-4 to 2-10 and Ohio St which went from 12-1 to 6-7, their first losing season since 1988 and their most losses in a single season since 1897 (in fact tied for their most loses ever in a single ssn)!
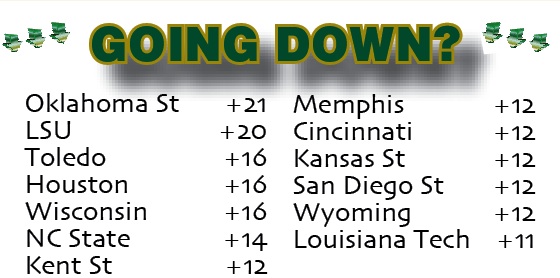
Teams that benefitted from double-digit turnovers the previous year rarely get a repeat of that good fortune. In the last 19 years, 281 teams have had plus double-digit turnovers. Of those 281, 182 have had weaker records the following year (64.8%). Only 65 teams (23.1%) have improved their record and the other 34 had the same record. Teams with a positive double-digit TO ratio had the same or weaker records 76.9% of the time since 1996. Also new for the past couple of years is limiting the teams to those that were +11 or more in turnovers. Every team now plays 12 games and most play an FCS team which should increase their TO total so I have raised the number.
Listed below are last year's most fortunate teams:

Let's take a look at some teams who had terrible luck (lots of turnovers) in one year then drastically improved the next year without those turnovers. Unlike the "Going Down" changes I kept the "Going Down" category at -10 or more because TO's even to an FCS team can cost you a game (VT -3 TO's in loss to James Madison in 2010).
Last year Cincinnati was near the top of the "Going Up" box as they were -15 in TO's in 2010 and finished 4-8. Last year they rebounded in a big way going 10-3 and were +12 in TO's. Eastern Michigan also made the box with -11 TO's in 2010 going 2-10. Last year they simply achieved their first .500 or better season since 1995 going 6-6! Of the 12 teams that made the box last year only 2 saw their record get worse. The 12 teams were a combined 57-98 (36.8%) in 2010 and improved to a combined 64-87 (42.4%) in 2011.
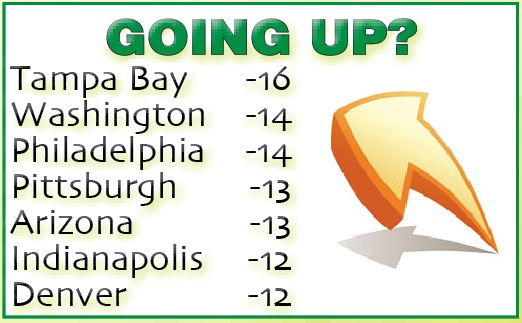
As previously stated, if a team received bad breaks the year before, they will usually be headed for better fortune the following year. In the past 19 years, there have been 232 teams that have finished the season minus double-digits in turnovers. Of those 232 teams, 159 (68.5%) have had better records the next year! Teams with a negative double-digit TO ratio had the same or stronger records 81% of the time since 1996. I have kept the "Going Up" box for teams with -10 or more TO's.
Which teams are headed for better fortunes and better seasons?

Turnovers have the same impact on the pro game. The NFL record for TO’s in a playoff game is 9 and that occurred in the Super Bowl. Buffalo outFD’d Dallas but of course was dominated on the scoreboard 52-17.
LY in wk#1 Pittsburgh had 7 TO’s and Baltimore had zero. The Ravens only had 17 FD’s (out FD’d by 3) but cruised to a 35-7 win.
Turnovers can not only make a difference in a game, but can make the difference between a winning and losing season and here are some NFL teams that were plus double-digit turnovers one year and saw their records plummet the next season:
In the 2010 season three teams had +12 or more TO’s and made my list in LY’s mag in NE, Pittsburgh and Atlanta. While the Steelers still matched their record, both the Patriots and the Falcons saw their reg ssn win total fall. In fact Atlanta was 13-3 in ‘10 with the #16 off & #16 def. LY despite improving (#10 off & #12 def) they finished 10-6 with 3 fewer reg ssn wins.
I figured that the NFL would not show as much of a turnaround, but was actually surprised to see the NFL has had MORE turnarounds. First of all, the NFL season is 16 games long as opposed to 12 or 13 for the colleges. With the extra NFL games, I upped the criteria from double-digit TO’s to plus or minus 12 turnovers or .75 per game. Here are the results from the last 20 years.
| Since 1991 NFL tms with +12 or more TO’s | |||
| Total | Weaker | Improved | Same |
| 70 | 51 (72.9%) | 11 (15.7%) | 8 (11.4%) |
This year there are only 3 teams on the list incl San Francisco with an amazing +28 in TO’s which matches the highest in the NFL the L10Y (NE in ‘10). In fact in the previous 9 seasons only FOUR teams have been +20 or more in TO’s but 2 reached the plateau LY.

Let’s take a look at some teams who had terrible luck (lots of turnovers) in one year then drastically improved the next year without those turnovers.
The 1996 NY Jets were a league low -20 in TO’s and not so amazingly they were just 1-15. The 1997 season brought in the disciplinarian coaching style of Bill Parcells and the team’s TO margin improved greatly going from -20 to +3. Did this have an impact on their win total? The 1997 Jets not only improved by EIGHT games in the win column, but finished with a winning record at 9-7!! Now that’s a Turnover=Turnaround story.
More recently in 2006 two teams were off seasons in which they finished -24 in TO’s. New Orleans was coming off a disastrous 3-13 season. In 2006 they were +7 in TO’s and they posted a 7 game turnaround finishing at 10-6.
In 2007 the Ravens had playoff expectations but with poor QB play they were -17 in TO’s and finished at 5-11. Despite a rookie QB at the helm the Ravens finished 9-7 in 2008. They were +13 in TO’s and thanks in part to a 30 TO difference from ‘07 to ‘08 they made it to the AFC Championship game.
After the 2009 season, 4 teams made my 2010 “Going Up” list with St Louis improving by 6 wins, Detroit by 4, Oakland by 3 and Cleveland staying the same.
Last year was certainly a rarity as Miami and Jacksonville both saw their records drop from 2010 (both HC’s let go) while Buffalo improved their win total by 2.
As I previously stated, if a team received bad breaks the year before, they will usually be heading for better fortune the following year.
Once again I was very surprised the NFL game yielded even higher percentages. I again made the adjustment to -12 or more TO’s and here are the results from the last 20 years.
| Since 1991 NFL tms with -12 or more TO’s | |||
| Total | Weaker | Improved | Same |
| 70 | 48 (68.6%) | 14 (20.0%) | 8 (11.4%) |
Seven teams were -12 or more in TO’s last season which is a new recent high as only 3 teams qualified LY and only a total of 9 teams in the last 3 seasons.

If you like this type of information, you will love the News and Notes section which is updated weekly at PhilSteele.com. I review such information as "Misleading Final Scores" and much, much more. Keep tabs on all of these teams this year and watch how turnovers WILL EQUAL turnaround in 2012!
