
| Daily Blog • August 28, 2012 |
|---|
My 2012 College Football Preview Magazine has so much information in it that it would take months to go thru it all. It is like 124 media guides rolled into one.
Magazine is a loose term for it as the Preview is more like a book with over 100 pages more than any other college football magazine. Not only does it have more pages but the magazine has 2 to 3 times the amount of information on each page! That gives my magazine 3 to 4 times the amount of information of any other magazine!
I mention all of this because there are even parts of the magazine that I myself forget about during the year. Every spring once I have finished my conference write ups, Top 40, All-American and All-Conference Teams I wrap up the “other” pages in the magazine. One of those pages that I find a lot of fun is the projected stats which is on page 340 and 343.
I have in-depth power ratings which rates each team’s rush offense, pass offense and points scored as well as all three categories for the defense. I have my computer match up each team vs all of their opponents and play the games out during the year. These projected statistics are not some random number I throw into the back of the magazine to fill up space (I never have ANYTHING in the magazine that is used for filler!). They take into account this year’s team vs this year’s schedule and they are remarkably accurate.
Let me give you a few examples from the last couple of years:
In 2009 Rice returned only 3 starters from a unit that avg’d 41.3 ppg in 2008 and the Owls went on to score a pedestrian 18.3 ppg. Two years ago they returned 9 starters and in my 2010 Preview I declared that they would have the Most Improved Offensive Points in the country and my computer predicted they would avg 28.6 ppg. Amazingly Rice would go on to score 28.7 ppg a 10.4 ppg improvement and my computer was just .1 PPG off!
On the defensive side in 2010 Miami, Oh was my #2 Most Improved Defensive Points allowed team in the country as they returned nine starters from a unit that allowed 34.2 ppg in 2009. My computer projected they would give up 28.0 ppg a 6.2 ppg improvement but even the RedHawks exceeded my expectations and allowed just 23.2 ppg a 11 ppg improvement last year!
I could go on and on with the examples because I find projecting statistics as fascinating as projecting wins and losses.
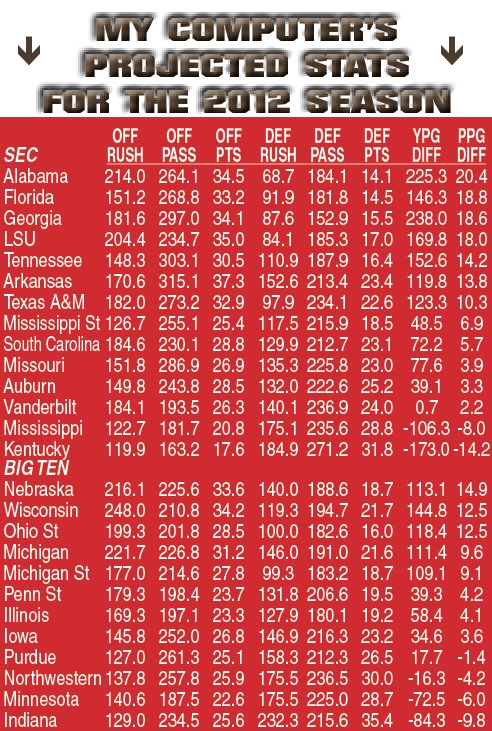
This year after the magazine was sent to press we found a slight issue with my projected stats as a couple of divisors were throwing off the stats slightly. That’s the bad news! The good news is I then took this as an opportunity to improve my projections ten fold! In the past my computer projections for rush yards and pass yards were only projected in 5-yard increments. Now if you look at the page below and also download the page for FREE you will find that each and every stat is now projected by my computer to the 1/10 of a yard/point! These computer projections I believe will be much more accurate than what I have published in the past and I encourage you to replace these new projections with the two pages that were published in the magazine (pages 340 and 343)!
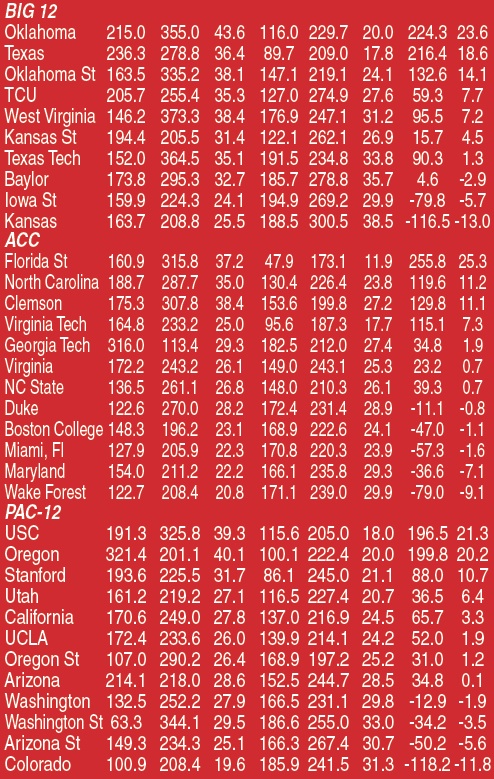
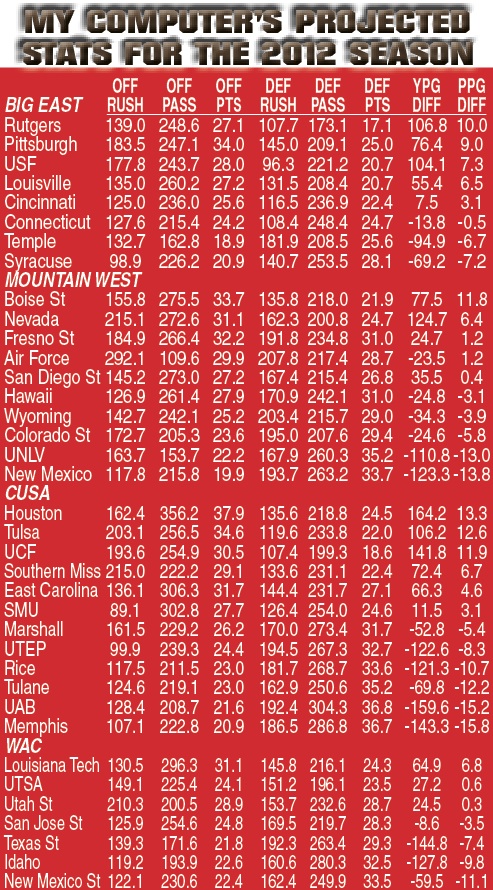
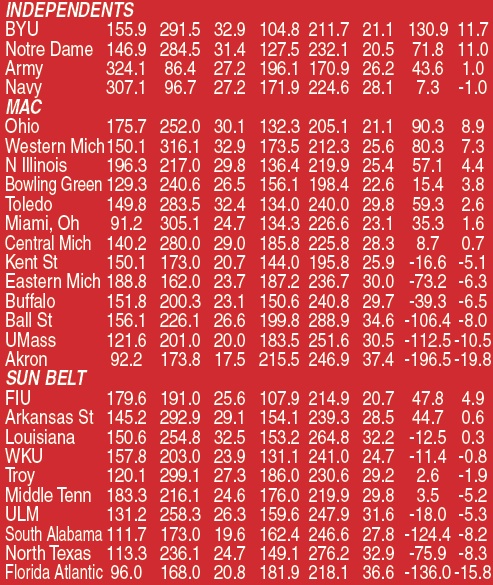
Today’s blog takes at look at my computer’s projections for every team! Each team has their rush off/def, pass off/def, and points off/def projected averages for the season as well as their ppg and ypg differences. Each conference is sorted by the ppg difference for the entire season and not just for conference games.
Also included in today’s blog are my 2012 Top Projected Rush Offenses/Defenses, Pass Offenses/Defenses, Scoring Offenses/Defenses, and Total Offenses/Defenses as well as the bottom five teams for each category.
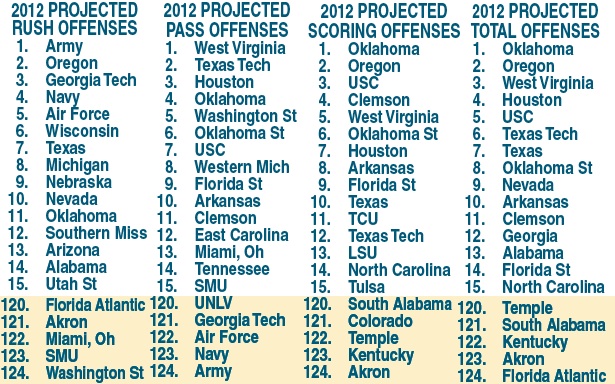
According to my computer Army with 324.1 rush ypg is projected as my Top Rushing Offense this year while Washington St (63.3 rush ypg) under Mike Leach’s new pass-happy offense is projected to be #124 in rushing. On the flip side Army is projected to have the #124 pass offense while West Virginia with QB Geno Smith and Dana Holgorsen’s high-flying offense is #1 with a computer projected 373.3 pass ypg! The top scoring offense this year will be Oklahoma according to my computer as they are projected to average 43.6 ppg this year while Akron comes in last. The top total offense also goes to Oklahoma with Florida Atlantic at the bottom.
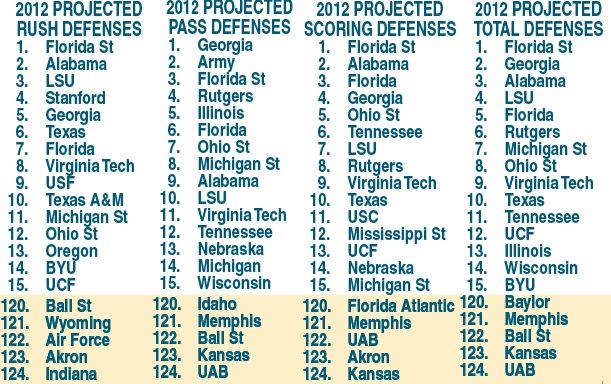
On the defensive side of the ball, my computer agrees with my assessment that Florida St has the best defense in the country this year. The Seminoles have my computer’s #1 Rush D (47.9 ypg), #1 Scoring D (11.9 ppg) and #1 Total D (221 ypg)! Georgia has my computer’s top projected pass D (152.9 ypg) while UAB and Kansas are projected at the bottom of several of the defensive categories.
Download the entire updated pg 340 of the
magazine for FREE!
Also included in today’s blog are my 2012 Top Projected Most Improved Rush Offenses/Defenses, Most Improved Pass Offenses/Defenses and Most Improved Scoring Offenses/Defenses as well as the bottom five teams for each category.
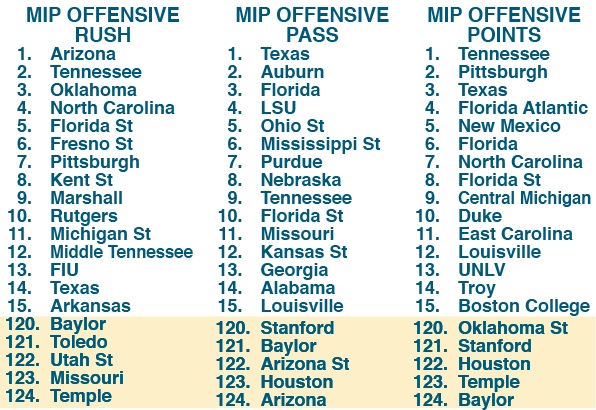
According to my computer Arizona is projected to have the most improved rush offense in the country this year as my computer projects the Wildcats to avg 214 rush ypg this year after avg only 95 rush ypg last year. New HC Rich Rodriguez inherits a running threat at the QB spot in Matt Scott to run his spread option offense and I think he will not have the same struggles that he had a Michigan as far as getting his offense going in his 1st season. At the bottom is Temple who takes a step up in competition this year and also loses RB Bernard Pierce who ran for 1,481 yds last year. The Most Improved Passing offense this year belongs to Texas who should get their best QB play since 2009. Arizona meanwhile comes in at the bottom of most improved pass offense as they do lose Nick Foles and are changing schemes. The Most Improved offensive points belongs to Tennessee (avg'd just 20.3 ppg last year) as they should have an explosive offense if Bray, Hunter and Rogers can all stay healthy . At the bottom is Baylor who avg'd 45.3 ppg last year (my computer projects 32.7 this year) but naturally they lose Heisman winner RGIII, RB Ganaway and WR Wright.
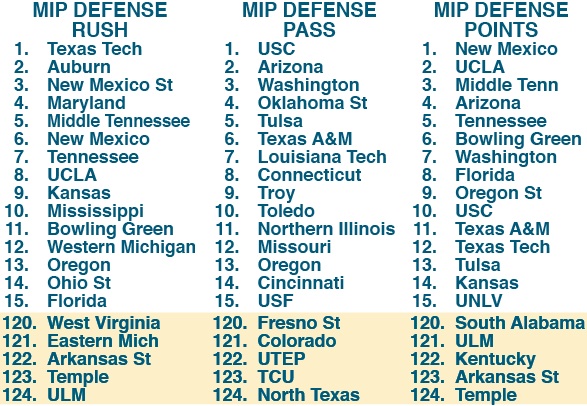
On the defensive side of the ball, my computer calls for Texas Tech to have the most improved rush defense in the country this year (a 68 ypg improvement) after being gashed for 259 ypg last year. ULM only gave up 100 rush ypg last year but my computer calls for them to give up 159.6 rush ypg this year. USC looks to have the most improved pass defense after allowing 263 pass ypg last year while North Texas is at the bottom. New Mexico thanks to new defensive minded HC Bob Davie will have the most improved defense in ppg allowed this year (allowed 41.7 ppg last year) with my computer calling for them to give up more than a TD less. At the bottom is Temple again who returns just 5 st'rs on D and will be taking on much tougher competition.
Download the entire updated pg 343 of the
magazine for FREE!
One of the many requests I get each year is to include a Projected W/L Record for each team in the Magazine. First let me explain why I do not include a W/L projection in my magazine. My evaluation of each team is based off my nine different sets of power ratings, these nine different sets give me nine different ways to project a season. One set of power ratings is based purely on talent level and may project a team to go 8-4 while another set of ratings is based off of my computer numbers which include rushing and passing offenses, defenses and special teams may project that team to go 10-2. When reading my forecast section for each team in my magazine you will notice that many times I will say that all nine sets of my power ratings call for a 12-0 season or two sets of power ratings call for a DD win season. This is as close to a projected record as I give in my magazine. Today I thought I would give you my computer’s projected stats and scores for each game for each the Preseason AP Top 25 Teams.
Remember these are not my own projections for each team because there is no computer that can figure situational edges and motivation/revenge factors but you can get a good idea on why I projected the teams where I did in my Preseason Poll.
My Computer's Projected Season
Stats/Records for AP Top 25
| #1 USC 12-0 (9-0) | ||||||||
| OFF | OFF | OFF | DEF | DEF | Def | Total | ||
| FOE | RUSH | PASS | PTS | RUSH | PASS | PTS | Yards | |
| Hawaii | 265 | 387 | 54 | 38 | 187 | 11 | 427 | |
| AT | Syracuse | 193 | 346 | 41 | 72 | 201 | 13 | 266 |
| AT | Stanford | 128 | 288 | 31 | 163 | 230 | 25 | 23 |
| California | 210 | 326 | 41 | 112 | 202 | 17 | 222 | |
| AT | Utah | 180 | 279 | 34 | 128 | 216 | 19 | 115 |
| AT | Washington | 204 | 295 | 41 | 113 | 255 | 23 | 131 |
| Colorado | 247 | 357 | 47 | 44 | 165 | 8 | 395 | |
| AT | Arizona | 210 | 321 | 42 | 189 | 214 | 22 | 128 |
| Oregon | 187 | 328 | 37 | 258 | 139 | 27 | 118 | |
| Arizona St | 231 | 369 | 47 | 100 | 196 | 16 | 304 | |
| AT | UCLA | 200 | 270 | 36 | 145 | 220 | 19 | 105 |
| Notre Dame | 178 | 359 | 35 | 109 | 237 | 23 | 191 | |
| Avg | 203 | 327 | 40 | 122 | 205 | 19 | 202 | |
| #2 Alabama 11-1 (7-1) | ||||||||
| OFF | OFF | OFF | DEF | DEF | Def | Total | ||
| FOE | RUSH | PASS | PTS | RUSH | PASS | PTS | Yards | |
| † | Michigan | 196 | 240 | 30 | 155 | 182 | 21 | 99 |
| WKU | 240 | 308 | 41 | 40 | 112 | 2 | 396 | |
| AT | Arkansas | 197 | 228 | 30 | 118 | 293 | 29 | 14 |
| Florida Atlantic | 272 | 303 | 53 | -21 | 90 | 2 | 505 | |
| Mississippi | 249 | 267 | 37 | 52 | 117 | 9 | 347 | |
| AT | Missouri | 181 | 219 | 28 | 108 | 269 | 20 | 23 |
| AT | Tennessee | 171 | 202 | 24 | 84 | 260 | 19 | 29 |
| Mississippi St | 205 | 260 | 30 | 27 | 183 | 10 | 255 | |
| AT | LSU | 134 | 201 | 22 | 152 | 210 | 26 | -27 |
| Texas A&M | 180 | 289 | 33 | 102 | 206 | 21 | 161 | |
| Western Carolina | 331 | 342 | 50 | -48 | 58 | -7 | 662 | |
| Auburn | 216 | 274 | 35 | 63 | 171 | 14 | 256 | |
| Avg | 214 | 261 | 34 | 69 | 179 | 14 | 227 | |
| #3 LSU 10-2 (6-2) | ||||||||
| OFF | OFF | OFF | DEF | DEF | Def | Total | ||
| FOE | RUSH | PASS | PTS | RUSH | PASS | PTS | Yards | |
| North Texas | 263 | 315 | 50 | -7 | 182 | 6 | 403 | |
| Washington | 229 | 236 | 39 | 63 | 210 | 17 | 192 | |
| Idaho | 266 | 293 | 47 | 12 | 130 | 6 | 417 | |
| AT | Auburn | 183 | 193 | 31 | 105 | 236 | 22 | 35 |
| Towson | 271 | 320 | 51 | 74 | 62 | 10 | 455 | |
| AT | Florida | 130 | 150 | 19 | 114 | 265 | 28 | -99 |
| South Carolina | 189 | 227 | 32 | 112 | 174 | 17 | 130 | |
| AT | Texas A&M | 147 | 208 | 30 | 144 | 271 | 29 | -60 |
| Alabama | 152 | 210 | 26 | 134 | 201 | 22 | 27 | |
| Mississippi St | 202 | 229 | 30 | 39 | 198 | 13 | 194 | |
| Mississippi | 246 | 236 | 37 | 64 | 132 | 11 | 286 | |
| AT | Arkansas | 195 | 199 | 30 | 130 | 307 | 31 | -43 |
| Avg | 206 | 235 | 35 | 82 | 197 | 18 | 161 | |
| #4 Oklahoma 12-0 (9-0) | ||||||||
| OFF | OFF | OFF | DEF | DEF | Def | Total | ||
| FOE | RUSH | PASS | PTS | RUSH | PASS | PTS | Yards | |
| AT | UTEP | 224 | 347 | 45 | 71 | 227 | 15 | 273 |
| Florida A&M | 290 | 438 | 56 | -11 | 61 | -4 | 678 | |
| Kansas St | 168 | 372 | 41 | 133 | 130 | 17 | 277 | |
| AT | Texas Tech | 221 | 313 | 45 | 122 | 346 | 27 | 66 |
| † | Texas | 122 | 291 | 29 | 189 | 243 | 26 | -19 |
| Kansas | 234 | 400 | 51 | 110 | 153 | 13 | 371 | |
| Notre Dame | 151 | 379 | 35 | 117 | 230 | 23 | 183 | |
| AT | Iowa St | 201 | 330 | 38 | 136 | 214 | 17 | 181 |
| Baylor | 234 | 388 | 49 | 129 | 242 | 22 | 251 | |
| AT | West Virginia | 181 | 327 | 41 | 122 | 360 | 31 | 26 |
| Oklahoma St | 189 | 343 | 38 | 97 | 262 | 24 | 173 | |
| AT | TCU | 150 | 327 | 37 | 178 | 245 | 28 | 54 |
| Avg | 197 | 354 | 42 | 116 | 226 | 20 | 210 | |
| #5 Oregon 11-1 (8-1) | ||||||||
| OFF | OFF | OFF | DEF | DEF | Def | Total | ||
| FOE | RUSH | PASS | PTS | RUSH | PASS | PTS | Yards | |
| Arkansas St | 354 | 260 | 49 | 56 | 213 | 13 | 345 | |
| Fresno St | 369 | 245 | 49 | 98 | 197 | 18 | 319 | |
| Tennessee Tech | 423 | 261 | 54 | 34 | 64 | 2 | 586 | |
| Arizona | 340 | 233 | 43 | 160 | 167 | 20 | 246 | |
| AT | Washington St | 349 | 185 | 43 | 37 | 345 | 25 | 152 |
| Washington | 332 | 204 | 42 | 85 | 210 | 20 | 241 | |
| AT | Arizona St | 304 | 186 | 39 | 128 | 244 | 23 | 118 |
| Colorado | 351 | 225 | 44 | 41 | 162 | 10 | 373 | |
| AT | USC | 258 | 139 | 27 | 187 | 328 | 37 | -118 |
| AT | California | 282 | 140 | 32 | 141 | 253 | 24 | 28 |
| Stanford | 260 | 204 | 33 | 132 | 179 | 22 | 153 | |
| AT | Oregon St | 303 | 137 | 33 | 85 | 288 | 22 | 67 |
| Avg | 327 | 202 | 41 | 99 | 221 | 20 | 209 | |
| #6 Georgia 11-1 (7-1) | ||||||||
| OFF | OFF | OFF | DEF | DEF | Def | Total | ||
| FOE | RUSH | PASS | PTS | RUSH | PASS | PTS | Yards | |
| Buffalo | 202 | 341 | 42 | 43 | 124 | 7 | 376 | |
| AT | Missouri | 119 | 258 | 25 | 101 | 270 | 22 | 6 |
| Florida Atlantic | 208 | 339 | 50 | -26 | 93 | 4 | 480 | |
| Vanderbilt | 161 | 325 | 32 | 90 | 134 | 15 | 262 | |
| Tennessee | 137 | 288 | 26 | 48 | 213 | 17 | 164 | |
| AT | South Carolina | 98 | 244 | 23 | 124 | 212 | 22 | 6 |
| AT | Kentucky | 176 | 306 | 35 | 64 | 149 | 13 | 269 |
| † | Florida | 86 | 244 | 18 | 79 | 226 | 25 | 25 |
| Mississippi | 185 | 303 | 33 | 46 | 120 | 11 | 322 | |
| AT | Auburn | 123 | 261 | 27 | 86 | 223 | 21 | 75 |
| Georgia Southern | 214 | 368 | 42 | 133 | 12 | 4 | 437 | |
| Georgia Tech | 201 | 301 | 36 | 218 | 42 | 16 | 242 | |
| Avg | 159 | 298 | 32 | 84 | 151 | 15 | 222 | |
| #7 Florida St 12-0 (8-0) | ||||||||
| OFF | OFF | OFF | DEF | DEF | Def | Total | ||
| FOE | RUSH | PASS | PTS | RUSH | PASS | PTS | Yards | |
| Murray St | 267 | 386 | 52 | -43 | 161 | 5 | 535 | |
| Savannah St | 267 | 402 | 52 | -70 | 17 | -7 | 722 | |
| Wake Forest | 175 | 332 | 41 | 24 | 136 | 6 | 347 | |
| Clemson | 168 | 313 | 41 | 78 | 236 | 23 | 167 | |
| AT | USF | 103 | 293 | 31 | 108 | 210 | 18 | 78 |
| AT | NC State | 140 | 275 | 35 | 69 | 235 | 17 | 111 |
| Boston College | 165 | 334 | 36 | 58 | 137 | 9 | 304 | |
| AT | Miami, Fl | 141 | 292 | 31 | 67 | 173 | 13 | 193 |
| Duke | 183 | 339 | 42 | 31 | 205 | 14 | 286 | |
| AT | Virginia Tech | 76 | 246 | 25 | 89 | 215 | 15 | 18 |
| AT | Maryland | 150 | 297 | 37 | 83 | 161 | 10 | 203 |
| Florida | 101 | 275 | 25 | 67 | 206 | 21 | 103 | |
| Avg | 161 | 315 | 37 | 47 | 174 | 12 | 256 | |
| #8 Michigan 8-4 (6-2) | ||||||||
| OFF | OFF | OFF | DEF | DEF | Def | Total | ||
| FOE | RUSH | PASS | PTS | RUSH | PASS | PTS | Yards | |
| † | Alabama | 155 | 182 | 21 | 196 | 240 | 30 | -99 |
| Air Force | 304 | 280 | 44 | 215 | 46 | 15 | 323 | |
| Massachusetts | 292 | 274 | 42 | 66 | 141 | 9 | 359 | |
| AT | Notre Dame | 173 | 216 | 23 | 155 | 288 | 32 | -54 |
| AT | Purdue | 215 | 227 | 33 | 114 | 253 | 22 | 75 |
| Illinois | 226 | 207 | 30 | 123 | 141 | 14 | 169 | |
| Michigan St | 182 | 217 | 27 | 137 | 159 | 20 | 103 | |
| AT | Nebraska | 200 | 180 | 25 | 207 | 226 | 31 | -53 |
| AT | Minnesota | 244 | 218 | 34 | 122 | 174 | 18 | 166 |
| Northwestern | 266 | 291 | 41 | 106 | 209 | 19 | 242 | |
| Iowa | 244 | 267 | 35 | 90 | 191 | 18 | 230 | |
| AT | Ohio St | 156 | 166 | 21 | 201 | 206 | 27 | -85 |
| Avg | 222 | 227 | 31 | 144 | 190 | 21 | 115 | |
| #9 South Carolina 8-4 (5-3) | ||||||||
| OFF | OFF | OFF | DEF | DEF | Def | Total | ||
| FOE | RUSH | PASS | PTS | RUSH | PASS | PTS | Yards | |
| AT | Vanderbilt | 177 | 219 | 27 | 158 | 190 | 23 | 48 |
| East Carolina | 210 | 268 | 36 | 56 | 236 | 18 | 186 | |
| UAB | 273 | 322 | 46 | 57 | 151 | 10 | 387 | |
| Missouri | 188 | 241 | 28 | 116 | 237 | 21 | 76 | |
| AT | Kentucky | 216 | 240 | 33 | 108 | 165 | 17 | 183 |
| Georgia | 124 | 212 | 22 | 98 | 244 | 23 | -6 | |
| AT | LSU | 112 | 174 | 17 | 189 | 227 | 32 | -130 |
| AT | Florida | 110 | 152 | 14 | 139 | 268 | 32 | -145 |
| Tennessee | 177 | 222 | 24 | 92 | 229 | 21 | 78 | |
| Arkansas | 206 | 253 | 31 | 123 | 257 | 30 | 79 | |
| Wofford | 267 | 283 | 44 | 233 | 28 | 8 | 289 | |
| AT | Clemson | 178 | 191 | 29 | 149 | 297 | 34 | -77 |
| Avg | 187 | 231 | 29 | 126 | 211 | 22 | 81 | |
| #10 Arkansas 9-3 (5-3) | ||||||||
| OFF | OFF | OFF | DEF | DEF | Def | Total | ||
| FOE | RUSH | PASS | PTS | RUSH | PASS | PTS | Yards | |
| Jacksonville St | 280 | 395 | 54 | 132 | 101 | 11 | 442 | |
| ULM | 221 | 357 | 50 | 94 | 219 | 15 | 265 | |
| Alabama | 118 | 293 | 29 | 197 | 228 | 30 | -14 | |
| Rutgers | 159 | 317 | 35 | 114 | 206 | 19 | 156 | |
| AT | Texas A&M | 112 | 289 | 31 | 207 | 299 | 36 | -105 |
| AT | Auburn | 148 | 274 | 34 | 168 | 264 | 29 | -10 |
| Kentucky | 229 | 366 | 46 | 119 | 144 | 16 | 332 | |
| Mississippi | 212 | 319 | 40 | 127 | 159 | 18 | 245 | |
| Tulsa | 194 | 337 | 40 | 152 | 210 | 24 | 169 | |
| AT | South Carolina | 123 | 257 | 30 | 206 | 253 | 31 | -79 |
| AT | Mississippi St | 140 | 265 | 29 | 129 | 271 | 25 | 5 |
| LSU | 130 | 307 | 31 | 195 | 199 | 30 | 43 | |
| Avg | 172 | 314 | 37 | 153 | 212 | 24 | 121 | |
| #11 West Virginia 9-3 (6-3) | ||||||||
| OFF | OFF | OFF | DEF | DEF | Def | Total | ||
| FOE | RUSH | PASS | PTS | RUSH | PASS | PTS | Yards | |
| Marshall | 198 | 408 | 47 | 133 | 193 | 22 | 280 | |
| † | James Madison | 183 | 403 | 42 | 168 | 84 | 16 | 334 |
| Maryland | 158 | 398 | 43 | 153 | 169 | 21 | 234 | |
| Baylor | 186 | 405 | 46 | 174 | 284 | 34 | 133 | |
| AT | Texas | 63 | 289 | 24 | 245 | 304 | 40 | -197 |
| AT | Texas Tech | 176 | 335 | 43 | 164 | 383 | 38 | -36 |
| Kansas St | 120 | 389 | 37 | 178 | 172 | 29 | 159 | |
| TCU | 134 | 398 | 39 | 191 | 233 | 35 | 108 | |
| AT | Oklahoma St | 112 | 311 | 30 | 171 | 353 | 41 | -101 |
| Oklahoma | 122 | 360 | 31 | 181 | 327 | 41 | -26 | |
| AT | Iowa St | 156 | 352 | 35 | 178 | 251 | 28 | 79 |
| Kansas | 186 | 417 | 48 | 155 | 195 | 25 | 253 | |
| Avg | 150 | 372 | 39 | 174 | 246 | 31 | 102 | |
| #12 Wisconsin 11-1 (7-1) | ||||||||
| OFF | OFF | OFF | DEF | DEF | Def | Total | ||
| FOE | RUSH | PASS | PTS | RUSH | PASS | PTS | Yards | |
| Nothern Iowa | 352 | 283 | 46 | 80 | 46 | 6 | 509 | |
| AT | Oregon St | 232 | 153 | 29 | 100 | 309 | 27 | -24 |
| 0 | Utah St | 294 | 260 | 45 | 138 | 154 | 19 | 262 |
| UTEP | 310 | 256 | 43 | 48 | 206 | 18 | 312 | |
| AT | Nebraska | 208 | 157 | 26 | 203 | 243 | 34 | -81 |
| Illinois | 237 | 189 | 31 | 116 | 153 | 17 | 157 | |
| AT | Purdue | 223 | 204 | 34 | 110 | 270 | 25 | 47 |
| Minnesota | 278 | 239 | 40 | 92 | 147 | 17 | 278 | |
| Michigan St | 193 | 199 | 28 | 130 | 171 | 22 | 91 | |
| AT | Indiana | 299 | 209 | 44 | 116 | 240 | 25 | 152 |
| Ohio St | 197 | 198 | 27 | 164 | 168 | 25 | 63 | |
| AT | Penn St | 192 | 189 | 26 | 129 | 188 | 16 | 64 |
| Avg | 251 | 211 | 35 | 119 | 191 | 21 | 153 | |
| #13 Michigan St 9-3 (6-2) | ||||||||
| OFF | OFF | OFF | DEF | DEF | Def | Total | ||
| FOE | RUSH | PASS | PTS | RUSH | PASS | PTS | Yards | |
| Boise St | 195 | 226 | 30 | 42 | 195 | 17 | 184 | |
| AT | Cent Michigan | 208 | 220 | 33 | 53 | 236 | 16 | 139 |
| Notre Dame | 138 | 235 | 21 | 83 | 227 | 23 | 63 | |
| E Michigan | 228 | 255 | 36 | 95 | 88 | 9 | 300 | |
| Ohio St | 125 | 191 | 20 | 125 | 139 | 18 | 52 | |
| AT | Indiana | 229 | 206 | 37 | 75 | 207 | 18 | 153 |
| Iowa | 183 | 242 | 29 | 44 | 174 | 13 | 207 | |
| AT | Michigan | 137 | 159 | 20 | 182 | 217 | 27 | -103 |
| AT | Wisconsin | 130 | 171 | 22 | 193 | 199 | 28 | -91 |
| Nebraska | 167 | 203 | 24 | 133 | 161 | 22 | 76 | |
| Northwestern | 205 | 266 | 35 | 60 | 192 | 15 | 219 | |
| AT | Minnesota | 182 | 192 | 28 | 77 | 158 | 14 | 139 |
| Avg | 177 | 214 | 28 | 97 | 183 | 18 | 112 | |
| #14 Clemson 11-1 (7-1) | ||||||||
| OFF | OFF | OFF | DEF | DEF | Def | Total | ||
| FOE | RUSH | PASS | PTS | RUSH | PASS | PTS | Yards | |
| † | Auburn | 158 | 288 | 35 | 156 | 228 | 31 | 62 |
| Ball St | 236 | 387 | 50 | 126 | 179 | 22 | 318 | |
| Furman | 254 | 381 | 53 | 54 | 117 | 12 | 464 | |
| AT | Florida St | 78 | 236 | 23 | 168 | 313 | 41 | -167 |
| AT | Boston College | 159 | 286 | 33 | 166 | 206 | 28 | 73 |
| Georgia Tech | 222 | 304 | 42 | 302 | 71 | 29 | 153 | |
| Virginia Tech | 127 | 293 | 31 | 140 | 189 | 24 | 91 | |
| AT | Wake Forest | 171 | 287 | 38 | 131 | 203 | 24 | 124 |
| AT | Duke | 182 | 300 | 40 | 134 | 265 | 32 | 83 |
| Maryland | 194 | 331 | 43 | 141 | 148 | 20 | 236 | |
| NC State | 187 | 314 | 41 | 124 | 217 | 27 | 160 | |
| South Carolina | 149 | 297 | 34 | 178 | 191 | 29 | 77 | |
| Avg | 176 | 309 | 39 | 152 | 194 | 26 | 140 | |
| #15 Texas 11-1 (8-1) | ||||||||
| OFF | OFF | OFF | DEF | DEF | Def | Total | ||
| FOE | RUSH | PASS | PTS | RUSH | PASS | PTS | Yards | |
| Wyoming | 295 | 311 | 45 | 39 | 144 | 5 | 423 | |
| New Mexico | 288 | 341 | 49 | 5 | 125 | 0 | 499 | |
| AT | Mississippi | 228 | 241 | 33 | 92 | 149 | 14 | 228 |
| AT | Oklahoma St | 193 | 218 | 28 | 98 | 293 | 27 | 20 |
| West Virginia | 245 | 304 | 40 | 63 | 289 | 24 | 197 | |
| † | Oklahoma | 189 | 243 | 26 | 122 | 291 | 29 | 19 |
| Baylor | 267 | 312 | 44 | 101 | 224 | 20 | 254 | |
| AT | Kansas | 243 | 283 | 41 | 107 | 177 | 16 | 242 |
| AT | Texas Tech | 257 | 242 | 40 | 91 | 323 | 24 | 85 |
| Iowa St | 262 | 302 | 37 | 80 | 148 | 10 | 336 | |
| TCU | 215 | 305 | 36 | 118 | 173 | 21 | 229 | |
| AT | Kansas St | 174 | 250 | 30 | 133 | 159 | 20 | 132 |
| Avg | 238 | 279 | 37 | 87 | 208 | 17 | 222 | |
| #16 Virginia Tech 9-3 (5-3) | ||||||||
| OFF | OFF | OFF | DEF | DEF | Def | Total | ||
| FOE | RUSH | PASS | PTS | RUSH | PASS | PTS | Yards | |
| Georgia Tech | 205 | 237 | 29 | 238 | 50 | 17 | 154 | |
| Austin Peay | 271 | 305 | 40 | -44 | 29 | -4 | 591 | |
| Pittsburgh | 153 | 212 | 27 | 134 | 216 | 26 | 15 | |
| Bowling Green | 206 | 248 | 29 | 37 | 170 | 11 | 247 | |
| Cincinnati | 144 | 227 | 23 | 71 | 205 | 17 | 95 | |
| North Carolina | 136 | 217 | 22 | 130 | 265 | 26 | -42 | |
| Duke | 187 | 269 | 30 | 48 | 208 | 16 | 200 | |
| Clemson | 140 | 189 | 24 | 127 | 293 | 31 | -91 | |
| Miami, Fl | 141 | 214 | 19 | 88 | 184 | 16 | 83 | |
| Florida St | 89 | 215 | 15 | 76 | 246 | 25 | -18 | |
| Boston College | 140 | 215 | 19 | 104 | 189 | 17 | 62 | |
| Virginia | 167 | 279 | 27 | 90 | 179 | 14 | 177 | |
| Avg | 165 | 235 | 25 | 91 | 186 | 18 | 123 | |
| #17 Nebraska 10-2 (6-2) | ||||||||
| OFF | OFF | OFF | DEF | DEF | Def | Total | ||
| FOE | RUSH | PASS | PTS | RUSH | PASS | PTS | Yards | |
| Southern Miss | 241 | 251 | 36 | 160 | 152 | 17 | 180 | |
| AT | UCLA | 201 | 164 | 28 | 166 | 222 | 22 | -23 |
| Arkansas St | 251 | 286 | 44 | 80 | 218 | 14 | 239 | |
| Idaho St | 328 | 269 | 49 | -9 | 135 | -1 | 471 | |
| Wisconsin | 203 | 243 | 34 | 208 | 157 | 26 | 81 | |
| AT | Ohio St | 136 | 159 | 21 | 202 | 201 | 26 | -108 |
| AT | Northwestern | 222 | 244 | 37 | 131 | 244 | 22 | 91 |
| Michigan | 207 | 226 | 31 | 200 | 180 | 25 | 53 | |
| AT | Michigan St | 133 | 161 | 22 | 167 | 203 | 24 | -76 |
| Penn St | 194 | 255 | 31 | 104 | 116 | 7 | 229 | |
| Minnesota | 247 | 250 | 39 | 100 | 130 | 13 | 267 | |
| AT | Iowa | 195 | 211 | 30 | 120 | 235 | 21 | 51 |
| Avg | 213 | 226 | 33 | 136 | 183 | 18 | 121 | |
| #18 Ohio St 10-2 (6-2) | ||||||||
| OFF | OFF | OFF | DEF | DEF | Def | Total | ||
| FOE | RUSH | PASS | PTS | RUSH | PASS | PTS | Yards | |
| Miami, Oh | 226 | 243 | 33 | -8 | 228 | 8 | 249 | |
| UCF | 204 | 205 | 28 | 95 | 174 | 14 | 140 | |
| California | 175 | 150 | 24 | 119 | 240 | 21 | -34 | |
| UAB | 288 | 295 | 46 | 33 | 138 | 6 | 412 | |
| AT | Michigan St | 125 | 139 | 18 | 125 | 191 | 20 | -52 |
| Nebraska | 202 | 201 | 26 | 136 | 159 | 21 | 108 | |
| AT | Indiana | 263 | 203 | 39 | 79 | 206 | 17 | 181 |
| Purdue | 213 | 241 | 33 | 46 | 192 | 13 | 216 | |
| AT | Penn St | 156 | 183 | 22 | 92 | 154 | 8 | 93 |
| Illinois | 200 | 180 | 26 | 80 | 122 | 9 | 178 | |
| AT | Wisconsin | 164 | 168 | 25 | 197 | 198 | 27 | -63 |
| Michigan | 201 | 206 | 27 | 156 | 166 | 21 | 85 | |
| Avg | 201 | 201 | 29 | 96 | 181 | 15 | 126 | |
| #19 Oklahoma St 10-2 (7-2) | ||||||||
| OFF | OFF | OFF | DEF | DEF | Def | Total | ||
| FOE | RUSH | PASS | PTS | RUSH | PASS | PTS | Yards | |
| Savannah St | 259 | 422 | 51 | -1 | 24 | 0 | 658 | |
| AT | Arizona | 141 | 313 | 36 | 219 | 212 | 26 | 23 |
| Louisiana | 201 | 384 | 49 | 104 | 186 | 20 | 295 | |
| Texas | 98 | 293 | 27 | 193 | 218 | 28 | -20 | |
| AT | Kansas | 168 | 331 | 42 | 157 | 200 | 22 | 142 |
| Iowa St | 188 | 351 | 37 | 129 | 170 | 16 | 240 | |
| TCU | 141 | 354 | 37 | 167 | 195 | 26 | 133 | |
| AT | Kansas St | 99 | 298 | 30 | 183 | 182 | 26 | 32 |
| West Virginia | 171 | 353 | 41 | 112 | 311 | 30 | 101 | |
| Texas Tech | 210 | 337 | 45 | 112 | 298 | 26 | 137 | |
| AT | Oklahoma | 97 | 262 | 24 | 189 | 343 | 38 | -173 |
| AT | Baylor | 168 | 319 | 40 | 176 | 289 | 30 | 22 |
| Avg | 162 | 335 | 38 | 145 | 219 | 24 | 133 | |
| #20 TCU 8-4 (5-4) | ||||||||
| OFF | OFF | OFF | DEF | DEF | Def | Total | ||
| FOE | RUSH | PASS | PTS | RUSH | PASS | PTS | Yards | |
| Grambling St | 308 | 351 | 49 | 7 | 76 | 5 | 576 | |
| AT | Kansas | 217 | 260 | 40 | 150 | 238 | 25 | 89 |
| Virginia | 204 | 298 | 37 | 135 | 221 | 22 | 146 | |
| AT | SMU | 175 | 245 | 32 | 60 | 313 | 24 | 47 |
| Iowa St | 237 | 280 | 36 | 122 | 208 | 20 | 187 | |
| AT | Baylor | 217 | 248 | 38 | 169 | 327 | 34 | -31 |
| Texas Tech | 259 | 266 | 44 | 105 | 336 | 30 | 84 | |
| AT | Oklahoma St | 167 | 195 | 26 | 141 | 354 | 37 | -133 |
| AT | West Virginia | 191 | 233 | 35 | 134 | 398 | 39 | -108 |
| Kansas St | 176 | 274 | 34 | 147 | 172 | 25 | 131 | |
| AT | Texas | 118 | 173 | 21 | 215 | 305 | 36 | -229 |
| Oklahoma | 178 | 245 | 28 | 150 | 327 | 37 | -54 | |
| Avg | 204 | 256 | 35 | 128 | 273 | 28 | 59 | |
| #21 Stanford 9-3 (7-2) | ||||||||
| OFF | OFF | OFF | DEF | DEF | Def | Total | ||
| FOE | RUSH | PASS | PTS | RUSH | PASS | PTS | Yards | |
| San Jose St | 245 | 281 | 43 | 11 | 193 | 9 | 322 | |
| Duke | 220 | 271 | 38 | 41 | 226 | 18 | 224 | |
| USC | 163 | 230 | 25 | 128 | 288 | 31 | -23 | |
| AT | Washington | 181 | 200 | 31 | 83 | 266 | 23 | 32 |
| Arizona | 213 | 270 | 37 | 133 | 181 | 19 | 169 | |
| AT | Notre Dame | 129 | 220 | 22 | 105 | 292 | 28 | -48 |
| AT | California | 159 | 183 | 26 | 110 | 261 | 23 | -29 |
| Washington St | 249 | 267 | 41 | -17 | 314 | 20 | 219 | |
| AT | Colorado | 199 | 219 | 34 | 39 | 219 | 13 | 160 |
| Oregon St | 207 | 226 | 32 | 26 | 249 | 16 | 158 | |
| AT | Oregon | 132 | 179 | 22 | 260 | 204 | 33 | -153 |
| AT | UCLA | 177 | 175 | 27 | 115 | 231 | 20 | 6 |
| Avg | 190 | 227 | 31 | 86 | 244 | 21 | 86 | |
| #22 Kansas St 7-5 (4-5) | ||||||||
| OFF | OFF | OFF | DEF | DEF | Def | Total | ||
| FOE | RUSH | PASS | PTS | RUSH | PASS | PTS | Yards | |
| Missouri St | 238 | 272 | 41 | 61 | 60 | 6 | 389 | |
| Miami, Fl | 191 | 216 | 28 | 93 | 173 | 19 | 141 | |
| North Texas | 229 | 274 | 44 | 28 | 214 | 14 | 261 | |
| AT | Oklahoma | 133 | 130 | 17 | 168 | 372 | 41 | -277 |
| Kansas | 228 | 239 | 39 | 112 | 189 | 20 | 166 | |
| AT | Iowa St | 198 | 175 | 26 | 134 | 243 | 23 | -4 |
| AT | West Virginia | 178 | 172 | 29 | 120 | 389 | 37 | -159 |
| Texas Tech | 245 | 203 | 38 | 93 | 330 | 28 | 25 | |
| Oklahoma St | 183 | 182 | 26 | 99 | 298 | 30 | -32 | |
| AT | TCU | 147 | 172 | 25 | 176 | 274 | 34 | -131 |
| AT | Baylor | 204 | 187 | 34 | 155 | 318 | 33 | -82 |
| Texas | 133 | 159 | 20 | 174 | 250 | 30 | -132 | |
| Avg | 192 | 198 | 31 | 117 | 259 | 26 | 14 | |
| #23 Florida 11-1 (7-1) | ||||||||
| OFF | OFF | OFF | DEF | DEF | Def | Total | ||
| FOE | RUSH | PASS | PTS | RUSH | PASS | PTS | Yards | |
| Bowling Green | 213 | 286 | 39 | 33 | 152 | 7 | 314 | |
| AT | Texas A&M | 97 | 249 | 28 | 142 | 249 | 25 | -45 |
| AT | Tennessee | 119 | 214 | 25 | 94 | 252 | 18 | -13 |
| Kentucky | 213 | 324 | 43 | 54 | 95 | 5 | 388 | |
| LSU | 114 | 265 | 28 | 130 | 150 | 19 | 99 | |
| AT | Vanderbilt | 147 | 258 | 32 | 131 | 165 | 16 | 109 |
| South Carolina | 139 | 268 | 32 | 110 | 152 | 14 | 145 | |
| † | Georgia | 79 | 226 | 25 | 86 | 244 | 18 | -25 |
| Missouri | 159 | 281 | 33 | 88 | 211 | 14 | 141 | |
| Louisiana | 220 | 332 | 49 | 48 | 164 | 11 | 340 | |
| Jacksonville St | 264 | 353 | 51 | 67 | 52 | 0 | 498 | |
| AT | Florida St | 67 | 206 | 21 | 101 | 275 | 25 | -103 |
| Avg | 152 | 272 | 34 | 90 | 180 | 14 | 154 | |
| #24 Louisville 7-5 (4-3) | ||||||||
| OFF | OFF | OFF | DEF | DEF | Def | Total | ||
| FOE | RUSH | PASS | PTS | RUSH | PASS | PTS | Yards | |
| Kentucky | 178 | 275 | 31 | 113 | 164 | 16 | 176 | |
| Missouri St | 187 | 305 | 36 | 83 | 75 | 7 | 334 | |
| North Carolina | 138 | 256 | 26 | 155 | 266 | 28 | -27 | |
| AT | FIU | 114 | 208 | 23 | 143 | 194 | 17 | -15 |
| AT | Southern Miss | 132 | 209 | 22 | 195 | 234 | 24 | -88 |
| AT | Pittsburgh | 131 | 212 | 25 | 182 | 255 | 32 | -94 |
| USF | 104 | 253 | 22 | 155 | 223 | 24 | -21 | |
| Cincinnati | 146 | 267 | 27 | 95 | 204 | 19 | 114 | |
| Temple | 169 | 262 | 28 | 126 | 134 | 14 | 171 | |
| AT | Syracuse | 109 | 240 | 24 | 102 | 241 | 20 | 6 |
| Connecticut | 115 | 274 | 27 | 98 | 189 | 18 | 102 | |
| AT | Rutgers | 87 | 191 | 17 | 129 | 261 | 24 | -112 |
| Avg | 134 | 246 | 26 | 131 | 203 | 20 | 46 | |
| #25 Boise St 10-2 (8-0) | ||||||||
| OFF | OFF | OFF | DEF | DEF | Def | Total | ||
| FOE | RUSH | PASS | PTS | RUSH | PASS | PTS | Yards | |
| AT | Michigan St | 42 | 195 | 17 | 195 | 226 | 30 | -184 |
| Miami, Oh | 145 | 303 | 32 | 60 | 259 | 18 | 129 | |
| BYU | 110 | 272 | 27 | 123 | 243 | 26 | 16 | |
| AT | New Mexico | 171 | 290 | 38 | 95 | 210 | 15 | 156 |
| AT | Southern Miss | 123 | 239 | 25 | 216 | 222 | 28 | -76 |
| Fresno St | 179 | 311 | 39 | 146 | 219 | 25 | 125 | |
| UNLV | 182 | 323 | 44 | 115 | 101 | 13 | 289 | |
| AT | Wyoming | 176 | 256 | 34 | 131 | 233 | 21 | 68 |
| San Diego St | 162 | 312 | 36 | 98 | 221 | 18 | 155 | |
| AT | Hawaii | 146 | 266 | 35 | 116 | 261 | 25 | 35 |
| Colorado St | 213 | 296 | 40 | 131 | 147 | 15 | 231 | |
| AT | Nevada | 145 | 234 | 30 | 203 | 262 | 27 | -86 |
| Avg | 149 | 275 | 33 | 136 | 217 | 22 | 72 | |
You can see now why I projected Florida St to win the national title as they are projected by my computer to outgain their foes by 256 ypg and also allow only 12 ppg on defense which are both best in the country. Naturally the Oklahoma Sooners who are my other pick to play in the title game have the nation's best offense according to my computer as they are projected to avergage more than 550 ypg. USC which has added Penn St RB Silas Redd since my magazine projection and is also projected to go 12-0 according to my computer. Teams like Michigan, South Carolina, Louisville and Kansas St are all projected to have at least four losses according to my computer and that is one of the main reasons why I am not as high on those teams as the other preseason polls.