
| Daily Blog •July 10, 2012 |
|---|

My 2012 College Football Preview Magazine has so much information in it that it would take months to go thru it all. It is like 124 media guides rolled into one.
Magazine is a loose term for it as the Preview is more like a book with over 100 pages more than any other college football magazine. Not only does it have more pages but the magazine has 2 to 3 times the amount of information on each page! That gives my magazine 3 to 4 times the amount of information of any other magazine!
I mention all of this because there are even parts of the magazine that I myself forget about during the year. Every spring once I have finished my conference write ups, Top 40, All-American and All-Conference Teams I wrap up the “other” pages in the magazine. One of those pages that I find a lot of fun is the projected stats which is on page 340 and 343.
I have in-depth power ratings which rates each team’s rush offense, pass offense and points scored as well as all three categories for the defense. I have my computer match up each team vs all of their opponents and play the games out during the year. These projected statistics are not some random number I throw into the back of the magazine to fill up space (I never have ANYTHING in the magazine that is used for filler!). They take into account this year’s team vs this year’s schedule and they are remarkably accurate.
Let me give you a few examples from the last couple of years:
In 2009 Rice returned only 3 starters from a unit that avg’d 41.3 ppg in 2008 and the Owls went on to score a pedestrian 18.3 ppg. Two years ago they returned 9 starters and in my 2010 Preview I declared that they would have the Most Improved Offensive Points in the country and my computer predicted they would avg 28.6 ppg. Amazingly Rice would go on to score 28.7 ppg a 10.4 ppg improvement and my computer was just .1 PPG off!
On the defensive side in 2010 Miami, Oh was my #2 Most Improved Defensive Points allowed team in the country as they returned nine starters from a unit that allowed 34.2 ppg in 2009. My computer projected they would give up 28.0 ppg a 6.2 ppg improvement but even the RedHawks exceeded my expectations and allowed just 23.2 ppg a 11 ppg improvement last year!
I could go on and on with the examples because I find projecting statistics as fascinating as projecting wins and losses.
This year after the magazine was sent to press we found a slight issue with my projected stats as a couple of divisors were throwing off the stats slightly. That’s the bad news! The good news is I then took this as an opportunity to improve my projections ten fold! In the past my computer projections for rush yards and pass yards were only projected in 5-yard increments. Now if you look at the page below and also download the page for FREE you will find that each and every stat is now projected by my computer to the 1/10 of a yard/point! These computer projections I believe will be much more accurate than what I have published in the past and I encourage you to replace these new projections with the two pages that were published in the magazine (pages 340 and 343)!
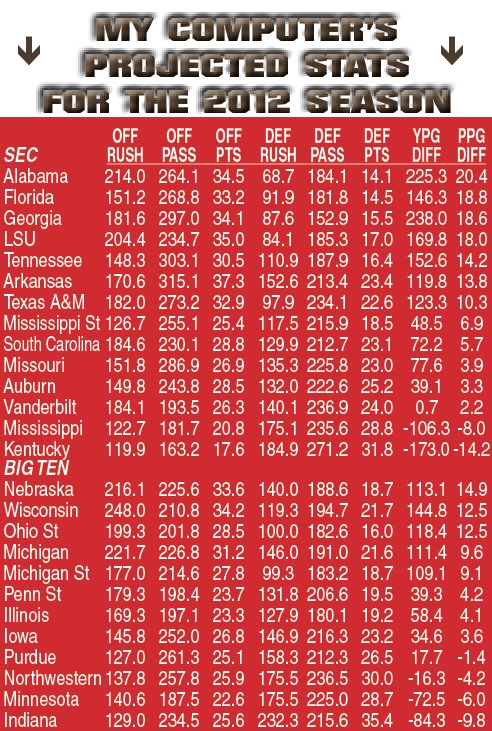
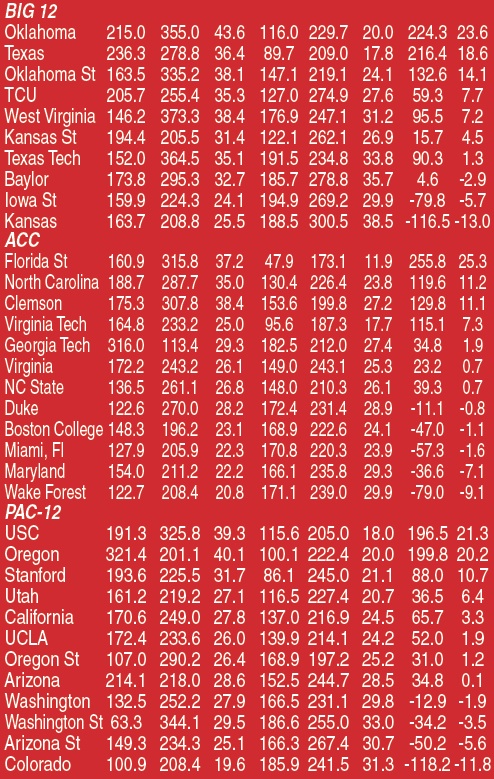
Today’s blog takes at look at my computer’s projections for the five major conferences! Each team has their rush off/def, pass off/def, and points off/def projected averages for the season as well as their ppg and ypg differences. Each conference is sorted by the ppg difference for the entire season and not just for conference games.
Also included in today’s blog are my 2012 Top Projected Rush Offenses/Defenses, Pass Offenses/Defenses, Scoring Offenses/Defenses, and Total Offenses/Defenses as well as the bottom five teams for each category.
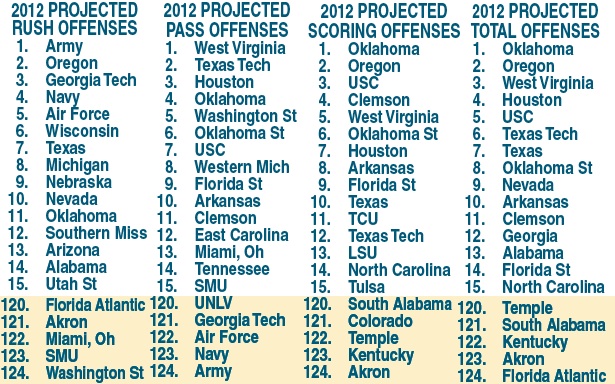
According to my computer Army with 324.1 rush ypg is projected as my Top Rushing Offense this year while Washington St (63.3 rush ypg) under Mike Leach’s new pass-happy offense is projected to be #124 in rushing. On the flip side Army is projected to have the #124 pass offense while West Virginia with QB Geno Smith and Dana Holgorsen’s high-flying offense is #1 with a computer projected 373.3 pass ypg! The top scoring offense this year will be Oklahoma according to my computer as they are projected to average 43.6 ppg this year while Akron comes in last. The top total offense also goes to Oklahoma with Florida Atlantic at the bottom.
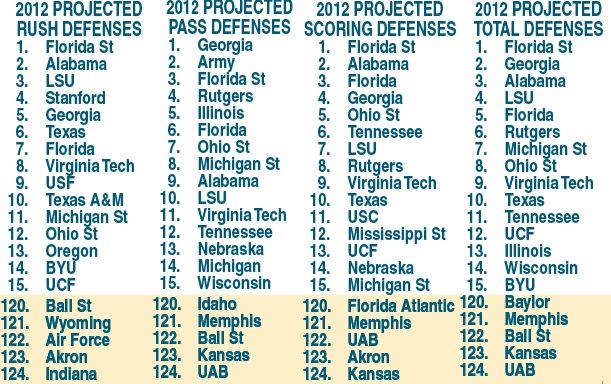
On the defensive side of the ball, my computer agrees with my assessment that Florida St has the best defense in the country this year. The Seminoles have my computer’s #1 Rush D (47.9 ypg), #1 Scoring D (11.9 ppg) and #1 Total D (221 ypg)! Georgia has my computer’s top projected pass D (152.9 ypg) while UAB and Kansas are projected at the bottom of several of the defensive categories.
In tomorrow’s blog, I will be taking a look at each individual computer projection as far as most improved rush yards, pass yards, scoring and total yards go and will give you the reasons for my computer’s projections. Also you will be able to look at the other six conferences as well as the independents as far as my computer projected stats for each team!