
| Spring Blog • June 17, 2015 |
|---|
2015 YPP Factor
Offensive YPP
Twelve years ago I did an article on YPP and every year there are some solid charts for you to review. First of all, let's explain what YPP is exactly. A YPP is simply yards per point. An offense is more efficient when their YPP is a lower number like in golf. If a team had an offensive YPP of 10.0, that would mean for every 200 yards they gained, they scored 20 points. Meanwhile, if they had an offensive YPP of 20.0, then for every 200 yards they gained, they only scored 10 points. On the other side of the ball, defenses want to have a higher YPP. Inverting the same thought, if a team allowed 200 yards and had a 20.0 YPP, that means they would allow just 10 points for every 200 yards the opposition traveled, whereas a 10.0 YPP would be 20 points for every 200 yards allowed. When I started this research in 1990, the average YPP for a team was 15.44 and the median was 15.49. It surprises me how much the median has dropped inside this decade.
Last year the avg was just 13.99 and the median was 13.90. I found teams that have a high offensive YPP (move the ball but do not score) the previous year generally have a stronger record the next season. Let's look at teams that had an unusually high YPP the previous year (an inefficient offense). If you look at the chart below you will see that 31 teams have had a YPP greater than 22.4 since 1990 and ALL 31 have had a stronger or identical record the next year. Last year THREE teams fit that criteria and all 3 improved (UMass, Miami-Oh, FIU). This year only one team fits that billing (SMU). The chart goes to 17.70, which still has a solid success record, as teams will either have the same or a stronger record 76.6% of the time. Last year 13 teams were off years with Off YPP's of 18.4 or higher & went 12-0-1 improving their record!!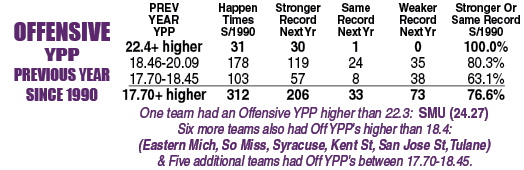
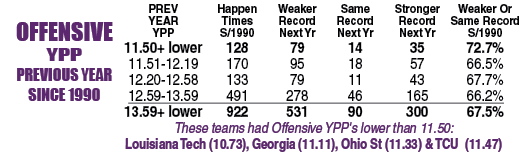
Teams that had an extremely low YPP the previous year usually have a weaker record the next season. The statistics are not as dominant as the high YPP, usually because there are some teams that benefit from turnovers on a yearly basis, keeping their YPP low. Still, according to the chart teams whose YPP were less than 11.50 the previous year had either a weaker or the same record 72.7% of the time the next year. There are a lot of teams that fit into the category of under 13.59. Looking at the history of the offensive YPP, these teams have a 67.5% chance of a weaker or same record this season.
2014 Offensive YPP
| Team | 2014 Offensive YPP | How they Will Fare in 2015 |
| Louisiana Tech | 10.73 | |
| Georgia | 11.08 | Teams who have a 72.7% chance of |
| Ohio St | 11.42 | having a weaker or same record in 2015 |
| TCU | 11.47 | |
| Michigan St | 11.65 | |
| Kansas St | 11.79 | |
| Memphis | 11.79 | |
| Nebraska | 11.98 | |
| Arizona St | 11.98 | |
| North Texas | 12.00 | |
| Maryland | 12.02 | |
| Westen Kentucky | 12.05 | |
| Oregon | 12.05 | |
| Baylor | 12.06 | |
| Florida | 12.15 | |
| Marshall | 12.27 | |
| Duke | 12.30 | |
| Utah | 12.40 | |
| BYU | 12.42 | |
| Boise St | 12.45 | |
| Georgia St | 12.49 | |
| Georgia Tech | 12.59 | |
| Minnesota | 12.59 | |
| Louisville | 12.67 | |
| Arkansas | 12.72 | |
| Florida Intl | 12.75 | |
| USC | 12.76 | |
| Oklahoma | 12.77 | |
| Tennessee | 12.81 | |
| Washington | 12.86 | |
| Texas A&M | 12.93 | |
| N Carolina | 12.93 | |
| Appalachian St | 12.94 | |
| California | 12.95 | |
| UCF | 12.95 | |
| W Michigan | 12.97 | |
| Arkansas St | 12.99 | |
| UAB | 13.02 | |
| Florida St | 13.09 | |
| Alabama | 13.12 | |
| Navy | 13.17 | |
| UTEP | 13.18 | |
| Kentucky | 13.18 | |
| Missouri | 13.21 | |
| Clemson | 13.24 | |
| Air Force | 13.31 | |
| Ball St | 13.35 | |
| Temple | 13.36 | |
| Toledo | 13.40 | |
| Arizona | 13.44 | |
| Old Dominion | 13.53 | |
| Cincinnati | 13.53 | |
| Notre Dame | 13.55 | |
| N Carolina St | 13.55 | |
| Wisconsin | 13.56 | Teams who have a 67.5% chance of |
| S Carolina | 13.57 | having a weaker or same record in 2015 |
| Buffalo | 13.58 | |
| Nevada | 13.64 | |
| Middle Tenn St | 13.66 | |
| Pittsburgh | 13.67 | |
| Auburn | 13.68 | |
| Oklahoma St | 13.72 | |
| Texas St | 13.73 | |
| Rice | 13.88 | |
| Houston | 13.91 | |
| Mississippi St | 13.91 | |
| UCLA | 13.98 | |
| N Illinois | 14.01 | |
| LSU | 14.03 | |
| Utah St | 14.07 | |
| Illinois | 14.17 | |
| UL-Lafayette | 14.17 | |
| Iowa | 14.17 | |
| Colorado St | 14.18 | |
| Stanford | 14.31 | |
| Army | 14.40 | |
| Bowling Green | 14.43 | |
| New Mexico | 14.44 | |
| Purdue | 14.46 | |
| Virginia | 14.48 | |
| Wake Forest | 14.58 | |
| Rutgers | 14.61 | |
| Boston College | 14.64 | |
| Miami (Fla) | 14.72 | |
| C Michigan | 14.79 | |
| Mississippi | 14.80 | |
| E Carolina | 14.87 | |
| W Virginia | 14.94 | |
| Florida ATL | 15.13 | |
| Virginia Tech | 15.17 | |
| Fresno St | 15.32 | |
| Oregon St | 15.33 | |
| Northwestern | 15.35 | |
| Umass | 15.41 | |
| Colorado | 15.41 | |
| Texas | 15.77 | |
| San Diego St | 15.78 | |
| Michigan | 15.92 | |
| Iowa St | 16.08 | |
| Indiana | 16.15 | |
| Washington St | 16.26 | |
| Penn St | 16.26 | |
| TexasTech | 16.53 | |
| Akron | 16.53 | |
| Georgia Southern | 16.56 | |
| Troy St | 16.64 | |
| South Alabama | 16.68 | |
| Idaho | 16.70 | |
| Tulsa | 16.72 | |
| Vanderbilt | 16.80 | |
| Miami (OH) | 16.81 | |
| New Mexico St | 17.18 | |
| UL Monroe | 17.40 | |
| UTSA | 17.41 | Teams who have a 76.6% chance of |
| Hawaii | 17.42 | having a stronger or same record in 2015 |
| UNLV | 17.67 | |
| South Florida | 17.75 | |
| Connecticut | 17.82 | |
| Ohio Univ | 18.06 | |
| Wyoming | 18.07 | |
| Kansas | 18.17 | |
| E Michigan | 19.09 | |
| S Mississippi | 19.21 | |
| Kent St | 19.28 | |
| Syracuse | 19.31 | |
| San Jose St | 20.46 | |
| Tulane | 21.67 | |
| Teams who have a 100% chance of | ||
| SMU | 24.27 | having a stronger or same record in 2015 |
Defensive YPP
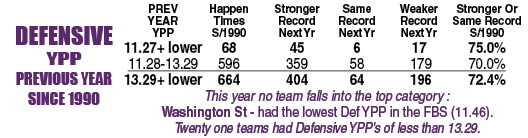
Now let's take a look at the teams under the Defensive YPP that were not so fortunate last year. As the chart below shows, if a team allows a defensive YPP of 11.27 or lower, (meaning they gave up a lot of points but not a lot of yds), their record improves or is the same the next year 75.0% of the time. Last year Southern Miss with their 10.39 Def YPP is the lowest since Eastern Michigan in 2010 (10.34). In 2011 The Eagles went 6-6 improving from a 2-10 record. Overall, teams that have a 13.29 defensive YPP or lower since 1990 have either had a stronger or same record 72.4% of the time.
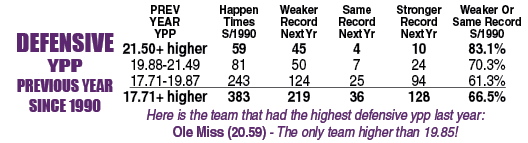
Teams that allowed a lot of yards but not a lot of points are generally considered bend but don't break D's. However teams whose Def YPP was 17.71 or greater have a weaker or the same record the following year 66.5% of the time. Since 1990 only 35 teams have had a Def YPP over 22.45 incl both participants in the 2012 Nat'l Championship. Notre Dame (23.92) and Alabama (22.88) combined for a 25-2 record with those incredible YPP's but LY while still very respectable the combined record fell to 20-6. It should be noted that Bama had a streak of 4 straight years being among the 4 best Def YPP broken last year as they were only 10th best. Ole Miss had the best Def YPP at 20.59.
2014 Defensive YPP
| Team | 2014 Offensive YPP | How they will Fare in 2015 |
| Mississippi | 20.56 | |
| Temple | 19.83 | |
| Mississippi St | 19.56 | |
| Duke | 18.36 | |
| Oregon | 18.21 | |
| LSU | 18.07 | |
| Utah St | 18.06 | |
| TCU | 17.99 | |
| Memphis | 17.96 | Teams who have a 66.5% chance of |
| Alabama | 17.82 | having a weaker or same record in 2015 |
| Stanford | 17.23 | |
| Virginia Tech | 17.06 | |
| Marshall | 17.00 | |
| Colorado St | 16.95 | |
| Arkansas | 16.82 | |
| San Diego St | 16.75 | |
| Houston | 16.66 | |
| Georgia St | 16.57 | |
| Washington | 16.57 | |
| Missouri | 16.44 | |
| Nevada | 16.42 | |
| Air Force | 16.34 | |
| Georgia | 16.30 | |
| USC | 16.22 | |
| Cincinnati | 16.12 | |
| Texas St | 16.12 | |
| Akron | 16.08 | |
| Texas A&M | 16.05 | |
| Georgia Tech | 15.99 | |
| Arizona | 15.98 | |
| Kansas St | 15.95 | |
| Ohio Univ | 15.88 | |
| Utah | 15.79 | |
| Ball St | 15.79 | |
| Florida | 15.64 | |
| Clemson | 15.62 | |
| UL-Lafayette | 15.61 | |
| UCF | 15.59 | |
| Hawaii | 15.58 | |
| Ohio St | 15.56 | |
| Florida St | 15.52 | |
| N Illinois | 15.27 | |
| Northwestern | 15.27 | |
| Minnesota | 15.24 | |
| Boston College | 15.22 | |
| South Alabama | 15.12 | |
| Tennessee | 15.05 | |
| Penn St | 14.97 | |
| Baylor | 14.95 | |
| Auburn | 14.94 | |
| Arizona St | 14.94 | |
| South Florida | 14.93 | |
| W Michigan | 14.89 | |
| Kent St | 14.84 | |
| Navy | 14.79 | |
| Oklahoma | 14.76 | |
| Bowling Green | 14.73 | |
| Rutgers | 14.68 | |
| Louisiana Tech | 14.67 | |
| Virginia | 14.66 | |
| Michigan St | 14.66 | |
| Florida Intl | 14.65 | |
| Texas | 14.62 | |
| Nebraska | 14.54 | |
| Maryland | 14.47 | |
| W Virginia | 14.46 | |
| New Mexico | 14.44 | |
| Middle Tenn St | 14.36 | |
| Syracuse | 14.35 | |
| UTSA | 14.26 | |
| S Carolina | 14.24 | |
| UL Monroe | 14.22 | |
| BYU | 14.22 | |
| E Carolina | 14.21 | |
| UCLA | 14.19 | |
| Louisville | 14.17 | |
| Wisconsin | 14.15 | |
| C Michigan | 14.13 | |
| Fresno St | 14.06 | |
| Boise St | 14.02 | |
| Wake Forest | 13.98 | |
| Michigan | 13.89 | |
| Notre Dame | 13.86 | |
| Oklahoma St | 13.83 | |
| Arkansas St | 13.83 | |
| N Carolina St | 13.82 | |
| Pittsburgh | 13.68 | |
| Tulane | 13.65 | |
| Miami (OH) | 13.64 | |
| Kansas | 13.63 | |
| Iowa St | 13.62 | |
| UAB | 13.57 | |
| Umass | 13.56 | |
| Miami (Fla) | 13.56 | |
| Rice | 13.56 | |
| Iowa | 13.44 | |
| Illinois | 13.42 | |
| Toledo | 13.39 | |
| Florida ATL | 13.39 | |
| UNLV | 13.35 | |
| Indiana | 13.21 | |
| Purdue | 13.14 | Teams who have a 72.4% chance of |
| Wyoming | 13.12 | having a stronger or same record in 2015 |
| UTEP | 13.11 | |
| Army | 13.09 | |
| Kentucky | 13.02 | |
| California | 12.87 | |
| Oregon St | 12.86 | |
| Westen Kentucky | 12.77 | |
| N Carolina | 12.77 | |
| S Mississippi | 12.75 | |
| Appalachian St | 12.71 | |
| Connecticut | 12.69 | |
| Buffalo | 12.61 | |
| Troy St | 12.55 | |
| TexasTech | 12.45 | |
| Idaho | 12.41 | |
| Tulsa | 12.40 | |
| New Mexico St | 12.39 | |
| North Texas | 12.38 | |
| E Michigan | 12.19 | |
| San Jose St | 12.14 | |
| Vanderbilt | 12.09 | |
| SMU | 12.08 | |
| Old Dominion | 11.90 | |
| Colorado | 11.82 | |
| Georgia Southern | 11.47 | |
| Washington St | 11.46 |
2015 College Football Preview
available right now on iTunes & Google Play!
1). It is available WEEKS before the magazine hits the newsstands on July 1st! It not only allows you to get the magazine weeks before it hits the book stores but it will save you wear and tear on your printed magazine. If you get both you can use it as your mobile version of the magazine and that will keep your actual magazine from getting dog eared early in the year.
2). It’s easy to use and works perfectly for both the iPhone, iPad and Android Devices. The download process may take up to 10-15 minutes but that’s because we have 352 pages with jampacked information!
3). No bugs, no issues, take it with you where ever you go!
4). Non-U.S. Customers: The magazine will not be on the newsstands internationally, the only way to get the 2015 College Football Preview is to order through our offices and pay at least $35 (includes S&H) or get it on iTunes or Google Play for just $9.99.
5). It’s only $9.99! On the newsstand, the magazine will cost you $12.99.
Please note: after downloading and purchasing the App, please make sure you search for 2015 if the old 2014 cover/edition comes up on your screen.
Don’t wait three weeks until the magazine hits the newsstands.
WE HAVE ALSO RECEIVED OUR SHIPMENT IN THE OFFICE! Don’t wait until July 1st for the 2015 Phil Steele College Football Preview to hit the newsstands order it now and we’ll ship it out within one business day. Call 1-866-918-7711.
The first magazine is $12.99 plus $6 for Priority Mail service. Add a second for $10 if delivered to the same address at the same time. OR, take advantage of our 7-6-5 special.
Seven 2015 College FB Previews delivered to one address just $65 (and that includes postage!)