
| Phil Steele Blog • June 27, 2017 |
|---|
Phil Steele's 2017 College Football Preview hits stores TODAY! You can find the magazine at 7 national retailers. At EVERY Barnes & Noble & Books-A-Million, at 90% of CVS, Publix, Target, Walgreens, and now returning to Walmart locations nationwide. Also available in Ontario Canada at Press Comerce and at other independent retailers in the area (limited quantities). However, we do not yet know how many magazines will be ordered by each store or by a particular store location. Remember if you can't find a copy of the 2017 magazine at one of the stores above you can alway order a copy right from our Phil Steele Store.
Stock Market Indicator
Metrics, Metrics, Metrics. Almost every system I come up with first looks at college football and then I check to see if the success translates to the NFL. This system is the exception as it made my NFL magazine first, under the title Slipping and Sliding. However, when I tried to plug this system in for college football, it did not have the same results as it did in the NFL, as teams’ records fluctuate more and there is not as much parity. The college system I devised was built taking into account a longer term. What I did was take a 2-year result record vs the previous year’s win total and that got me to the NFL-type success percentages.
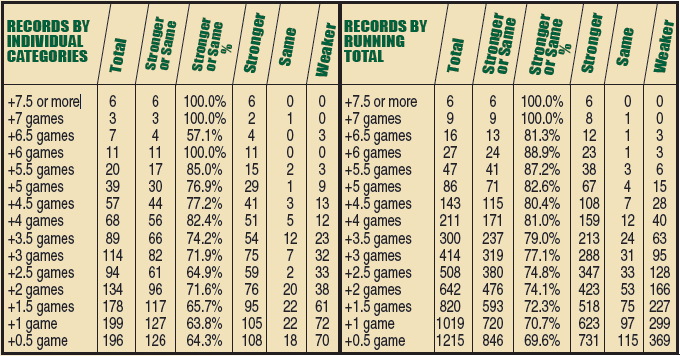
For example, in 2012 Ohio St had a Stock Market Indicator (SMI) of +5.5, which would be a Bull Market. The +5.5 was calculated by taking their average win total from 2009-2010, which was 11.5 (11-2 in ’09, 12-1 in ’10) and then subtracting their wins from ‘11 (just 6) which produced the +5.5. The +5.5 means that after two great seasons in ’09-‘10, the Buckeyes clearly underperformed in ‘11 and were poised for a big bounce back lthe next year (Bull Market). My Stock Market Indicator proved to be spot on as the Buckeyes were the Most Improved Team in the country going 12-0 in ’12! In ‘13 Auburn was coming off a 3-9 season following two years of a combined 22-5. That earned them a +8 in my Stock Market Indicator and they got to the National Title game! In 2014 TCU was +5 in the Bull Market and went from 4-8 to 12-1 and was the Most Improved Team in the country! In 2015 Tulsa was +5 and went from 2-10 to 6-7. In 2016 UCF was at the top of the Bull Market list at +10.5 and went from 0-12 to 6-7.THE BULL MARKET: After several years I expanded my research to take a look back at all records since 1990 and I was quite surprised. Since 1990 there have been a total of 27 teams that had a +6 Stock Market Indicator meaning that the prior year’s win total was 6 wins less than the average of the 2 years prior. Of those 27 teams, only 3 teams have had a weaker record, while 23 improved and 1 stayed the same. That improvement was dramatic going from a combined 74-246 (23.1%) to 141-185 (43.2%). Teams in the +5.5 category have improved their record 15 times had a weaker record just 3 times and the same record twice. There have been 39 instances of teams being +5 in the SMI category and those teams were 29-9-1 (76.9%). The records for +4.5 are now 41-13-3 (76.8%) and despite going down to +4 in my Stock Market Indicator, it surprisingly jumped back up to 51-12-5 (82.4%), which are superior to the individual +4.5 and +5 range. The numbers do drop back to 74.2% for a +3.5 net wins, 71.9% for +3 and down to 64.9% for +2.5. However, just when you thought the trend would get lower, surprisingly +2.0 has a 71.6% success rate. Even teams that had a +1.5 SMI from the prior two years, went up or stayed the same 63.8% of the time and teams that were either +1 & +0.5 combined for 64.1%!
Summing it all up, I will put it into 4 categories. Teams with a +6.0 SMI or higher are an almost perfect 23-3-1 (88.9%). Teams in the +4 to +5.5 range are 136-37-11 (79.9%) while teams in the +2 to +3.5 two-year SMI range are 264-126-41 (70.8%). Teams that were in the +.5 to +1.5 range are 308-203-62 (64.6%). Overall, of the 1,215 teams s/’90 that had a +.5 SMI or higher, 731 improved their record, and 115 had the same record meaning 69.6% of the time, teams in that category improved or had the same record.

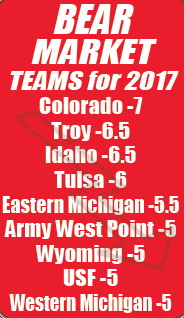
THE BEAR MARKET: Like all of my systems I put in my magazine, there is a two-way street to this Stock Market Indicator (SMI). I also have reviewed the numbers since 1990, on the Bear side of the market, teams with a negative indicator, indicating that a team had likely over achieved the prior season, and the numbers were similar to the Bull side. In fact of 39 teams that had a -6.0 SMI or lower since 1990, only 2 managed to improve their record. In 2003 Navy which went from 8-5 to 10-2 and in 2000 South Carolina which went from 8-4 to 9-3. The biggest drop-offs came in 1998. Tulane had a -7.5 SMI and went from 12-0 to 3-8. Interestingly in 1998 I called for Washington St to go from the Rose Bowl to last place in the Pac-10, which they did and in the 2 year SMI they were -6.0 and went from 10-2 to just 3-8.
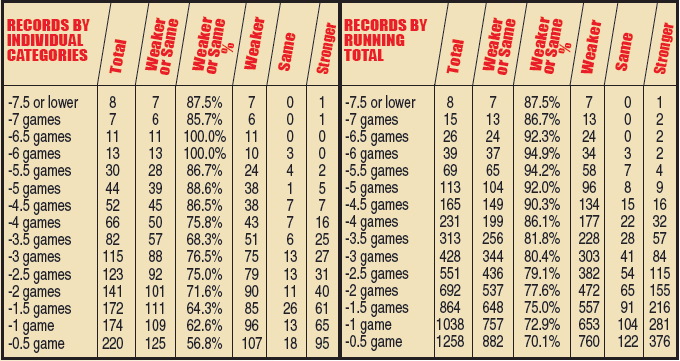
A look at the 2 year SMI shows a powerful trend of basically 75.4% if teams have a -2.0 SMI or less since. Unlike the above positive Market Indicator, there were actually two teams that bucked the trend with a -7.5 or -7 and improved but overall the chart has higher percentages at the -6 & below level (34-2-3 94.9%). Teams that had a Stock Market Indicator of -5 or lower had a weaker or the same record the next year 92% of the time with 96 having a weaker record, only 9 with a stronger record and 8 having the same record. Even teams with a SMI between -3.0 to -4.5 were in a 76.1% category. The teams in the -2.0 to -2.5 Stock Market Indicator had a weaker or same record the next year 73.1% of the time. Teams in the -1 to -1.5 range had the same or weaker record only 63.6% of the time.
Bottom line is that a 92% trend of a weaker or same record occurs if teams have a -5 SMI or less, -3 to -4.5 is 76.1% and -2 to -2.5 is 73.1%. Overall, teams that had -2 SMI or lower had the weaker or the same record basically 77.6% of the time.
Here is the complete list of the Stock Market Indicator. Teams highlighted in green are the Bull Market. Teams highlighted in red are the Bear Market.
| Bull Market | ||||
| MARSHALL | 8.5 | IOWA ST | -0.5 | |
| MICHIGAN ST | 8.5 | SYRACUSE | -0.5 | |
| OREGON | 7.0 | LOUISVILLE | -0.5 | |
| TCU | 5.5 | AUBURN | -0.5 | |
| ARIZONA | 5.5 | FLORIDA | -0.5 | |
| NOTRE DAME | 5.0 | OREGON ST | -0.5 | |
| UCLA | 5.0 | KENT ST | -0.5 | |
| BOWLING GREEN | 5.0 | BYU | -0.5 | |
| UTAH ST | 5.0 | SOUTH ALABAMA | -0.5 | |
| MISSISSIPPI | 4.5 | WISCONSIN | -0.5 | |
| NORTHERN ILLINOIS | 4.5 | CHARLOTTE | -0.5 | |
| DUKE | 4.5 | SOUTHERN MISS | -1.0 | |
| CINCINNATI | 4.0 | ULM | -1.0 | |
| MISSOURI | 4.0 | INDIANA | -1.0 | |
| RUTGERS | 4.0 | OHIO | -1.0 | |
| GA SOUTHERN | 4.0 | APPALACHIAN ST | -1.0 | |
| FRESNO ST | 3.5 | TULANE | -1.0 | |
| RICE | 3.5 | SOUTH CAROLINA | -1.0 | |
| BAYLOR | 3.5 | MARYLAND | -1.0 | |
| EAST CAROLINA | 3.5 | WKU | -1.0 | |
| MISSISSIPPI ST | 3.5 | TENNESSEE | -1.0 | |
| BUFFALO | 3.0 | PITTSBURGH | -1.0 | |
| TEXAS ST | 3.0 | ALABAMA | -1.0 | |
| ARIZONA ST | 3.0 | AIR FORCE | -1.0 | |
| VIRGINIA | 2.5 | UCF | -1.5 | |
| ILLINOIS | 2.5 | USC | -1.5 | |
| GEORGIA | 2.0 | OKLAHOMA | -1.5 | |
| NEVADA | 2.0 | UNLV | -1.5 | |
| OHIO ST | 2.0 | KANSAS ST | -1.5 | |
| UTEP | 2.0 | MIDDLE TENNESSEE | -1.5 | |
| AKRON | 1.5 | OKLAHOMA ST | -1.5 | |
| COLORADO ST | 1.5 | NEBRASKA | -1.5 | |
| MEMPHIS | 1.5 | MIAMI, FL | -2.0 | |
| HOUSTON | 1.5 | KENTUCKY | -2.0 | |
| FLORIDA ST | 1.5 | WASHINGTON ST | -2.0 | |
| CALIFORNIA | 1.5 | BOSTON COLLEGE | -2.0 | |
| IOWA | 1.5 | SAN DIEGO ST | -2.0 | |
| UMASS | 1.0 | MINNESOTA | -2.0 | |
| CENTRAL MICHIGAN | 1.0 | GEORGIA TECH | -2.0 | |
| CONNECTICUT | 1.0 | TEMPLE | -2.0 | |
| TEXAS | 0.5 | CLEMSON | -2.0 | |
| NC STATE | 0.5 | UTSA | -2.5 | |
| GEORGIA ST | 0.5 | NORTH TEXAS | -2.5 | |
| FIU | 0.5 | VANDERBILT | -2.5 | |
| NORTHWESTERN | 0.5 | MICHIGAN | -2.5 | |
| TOLEDO | 0.5 | WEST VIRGINIA | -2.5 | |
| LSU | 0.5 | VIRGINIA TECH | -3.0 | |
| SAN JOSE ST | 0.5 | MIAMI, OH | -3.5 | |
| TEXAS TECH | 0.5 | SMU | -3.5 | |
| ARKANSAS | 0.5 | HAWAII | -3.5 | |
| LOUISIANA | 0.5 | NEW MEXICO | -3.5 | |
| BOISE ST | 0.5 | PENN ST | -4.0 | |
| NAVY | 0.5 | WAKE FOREST | -4.0 | |
| NORTH CAROLINA | 0.5 | WASHINGTON | -4.5 | |
| UTAH | 0.5 | OLD DOMINION | -4.5 | |
| COASTAL CAROLINA | 0.5 | ARMY | -5.0 | |
| FLORIDA ATLANTIC | 0.0 | USF | -5.0 | |
| BALL ST | 0.0 | WYOMING | -5.0 | |
| ARKANSAS ST | 0.0 | WESTERN MICHIGAN | -5.0 | |
| LOUISIANA TECH | 0.0 | EASTERN MICHIGAN | -5.5 | |
| STANFORD | 0.0 | TULSA | -6.0 | |
| TEXAS A&M | 0.0 | TROY | -6.5 | |
| NEW MEXICO ST | -0.5 | IDAHO | -6.5 | |
| PURDUE | -0.5 | COLORADO | -7.0 | |
| KANSAS | -0.5 | Bear Market | ||
Three easy ways to get a copy of
Phil Steele's 2017 College Football Preview
** NEW Available now: You can now get a copy of Phil Steele’s 2017 College Football Preview that will work on any Computer, Laptop, Phone or Tablet using it's internet browser. Just click the Link below then click where it says Phil Steele’s 2017 College Football for $9.99. You will set up your own username and password and you be able to take the Magazine wherever you go and on any device. Click Here to purchase the Browser Version.
2017 College Football Preview
available right now on iTunes & Google Play!
Also Available: The digital copy on the Phil Steele 2017 College Football Preview is now available on the iPhone/iPad app store and on your Android device thru the Google Play Store. Just search for the Phil Steele Football app in your respective devices store, download the app and purchase the 2017 College Magazine there for just $9.99.
1). it will save you wear and tear on your printed magazine. If you get both you can use it as your mobile version of the magazine and that will keep your actual magazine from getting dog eared and torn up early in the year. The NFL version will be available Mid July.
2). It’s easy to use and works for both the iPhone, iPad, Android Devices and now on any device with a browser. The download process may take up to 10-15 minutes but that’s because we have over 350 pages jam-packed with information!
3). It’s only $9.99! On the newsstand, the magazine will cost you $12.99 + $7.20 shipping.
Please note: after downloading and purchasing the App, please make sure you search for 2017 if the old 2016 cover/edition comes up on your screen.