
EASTERN WASHINGTON EAGLES |
 |
Location: Cheney, Washington |
|---|---|
 |
|
Head Coach: Aaron Best |
| LAST 7 YEAR ATS RECORDS |
|---|
| LAST 6 YEAR ATS LOGS |
|---|
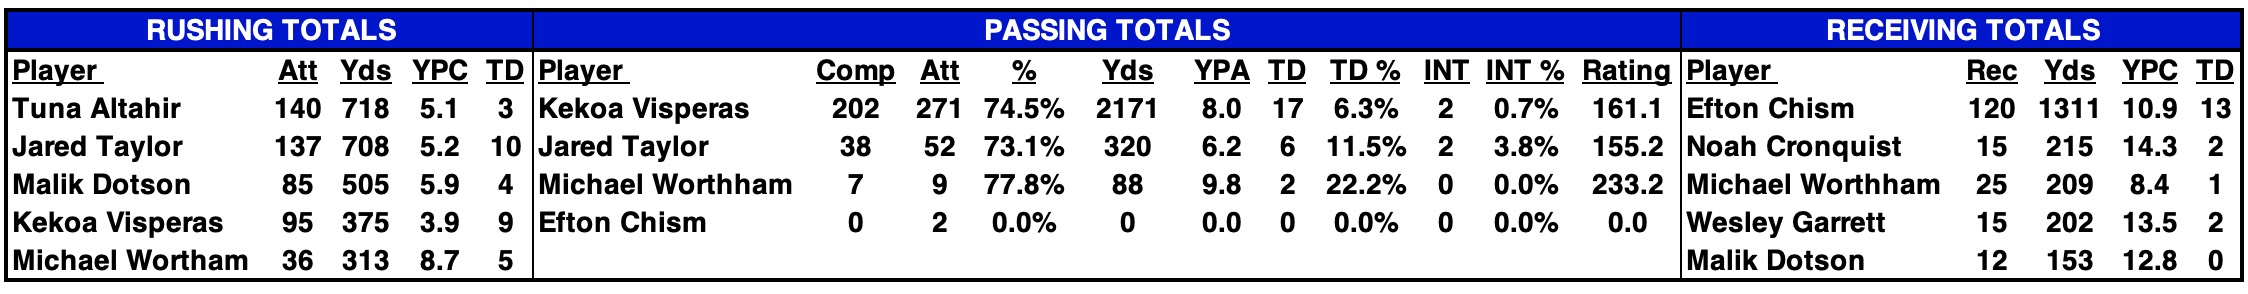
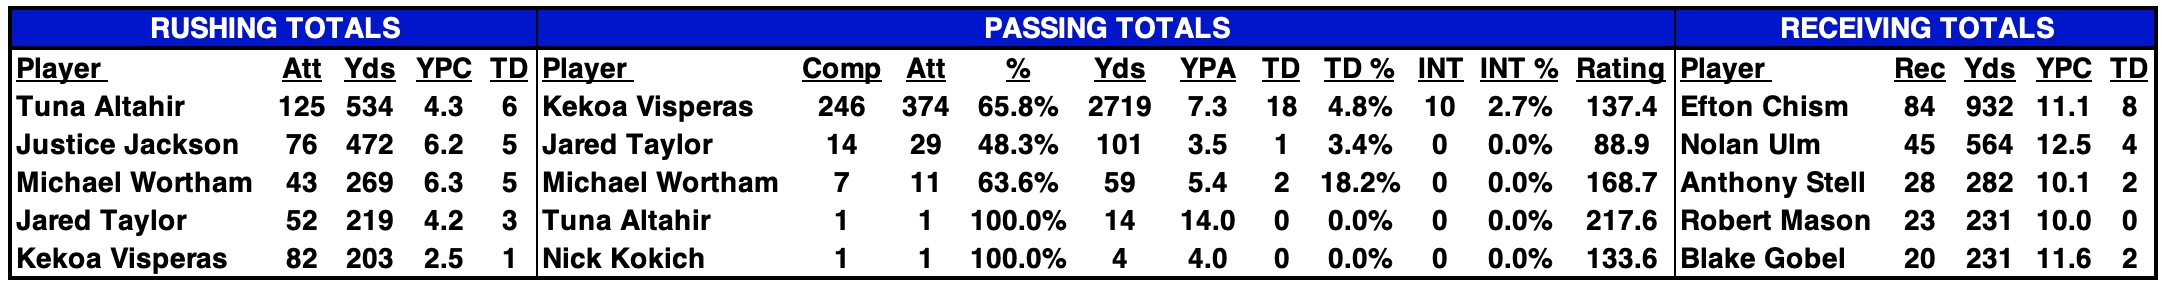
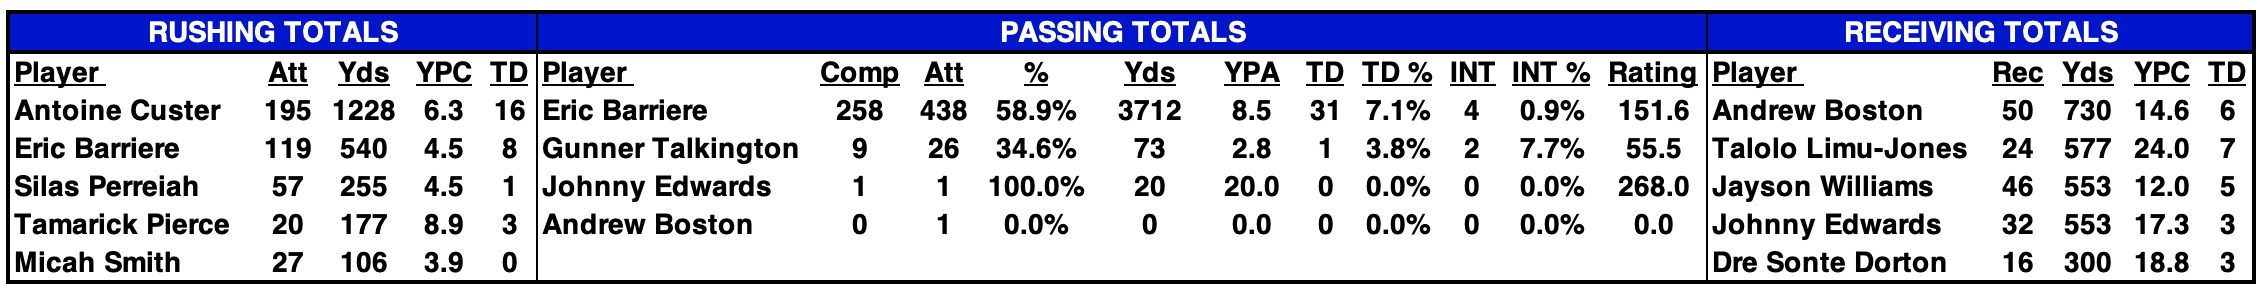
| 2025 STATISTICAL LEADERS |
|---|
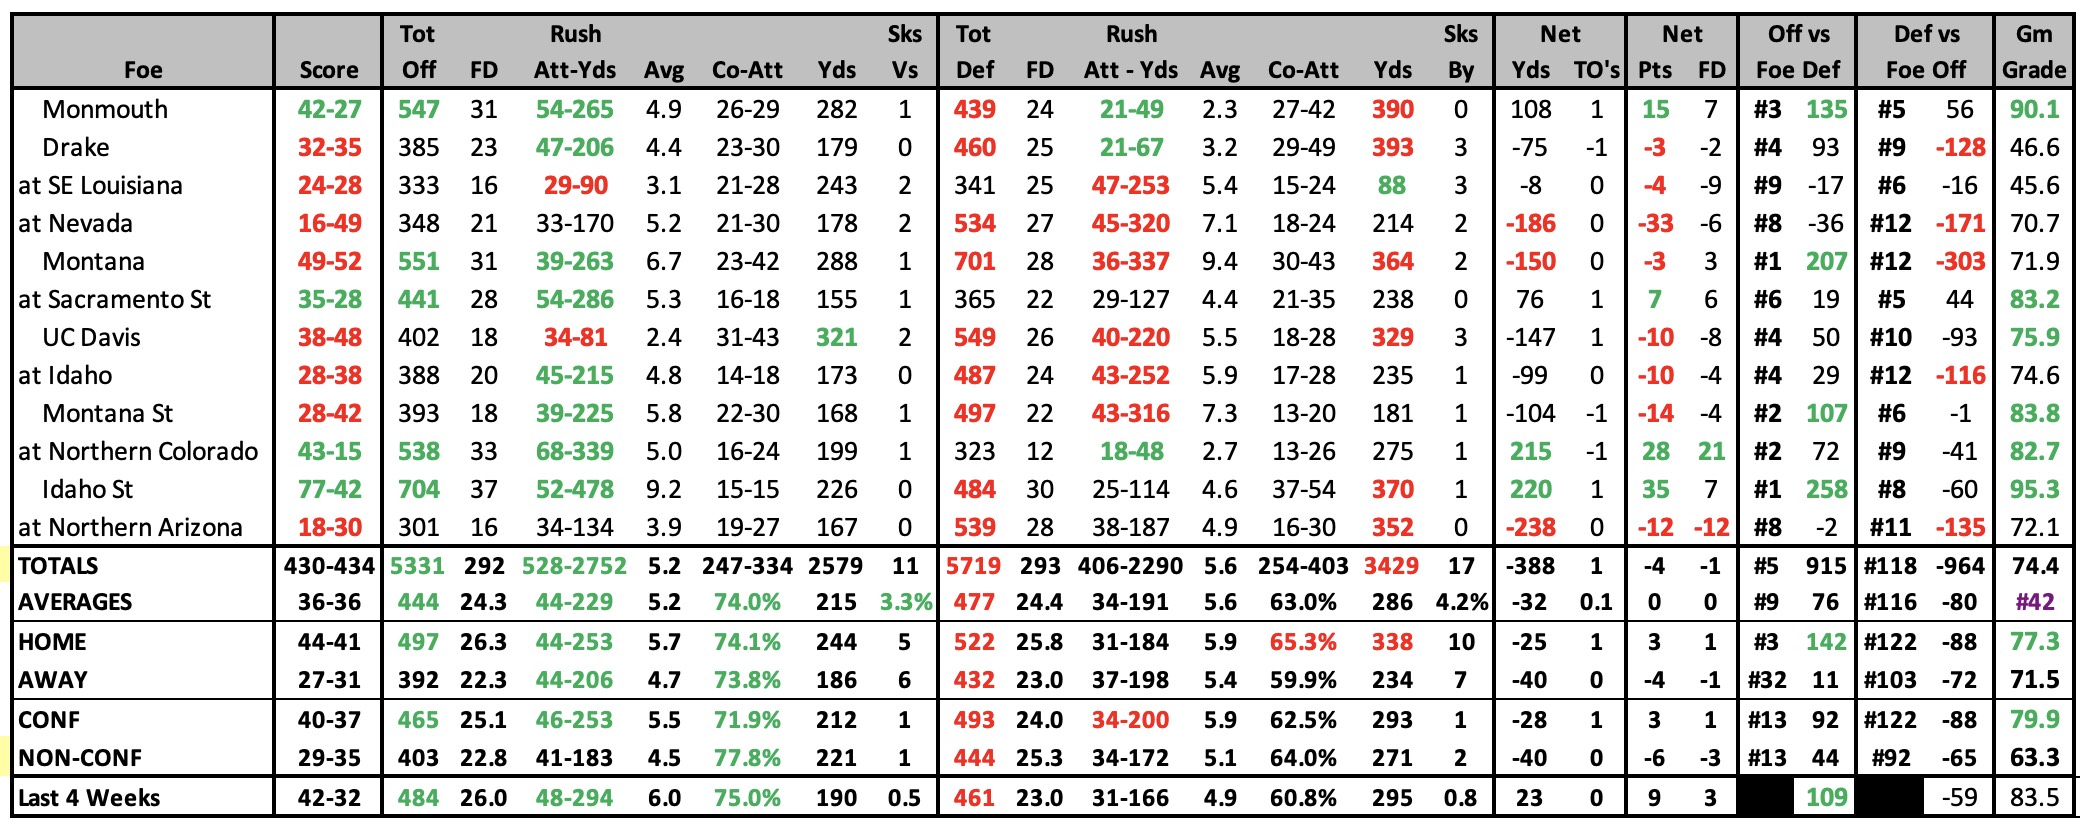
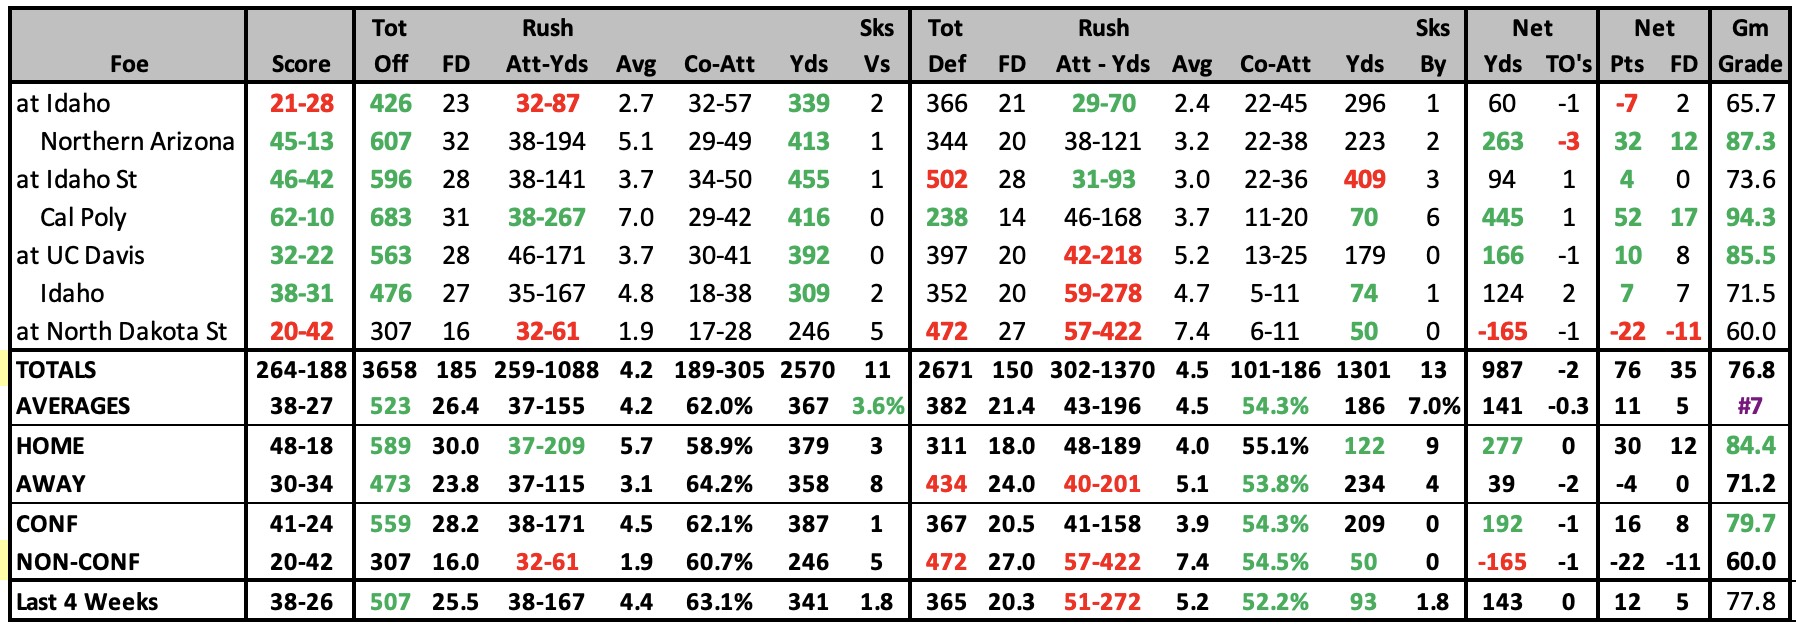
| 2025 GAME-BY-GAME STATS |
|---|
 |
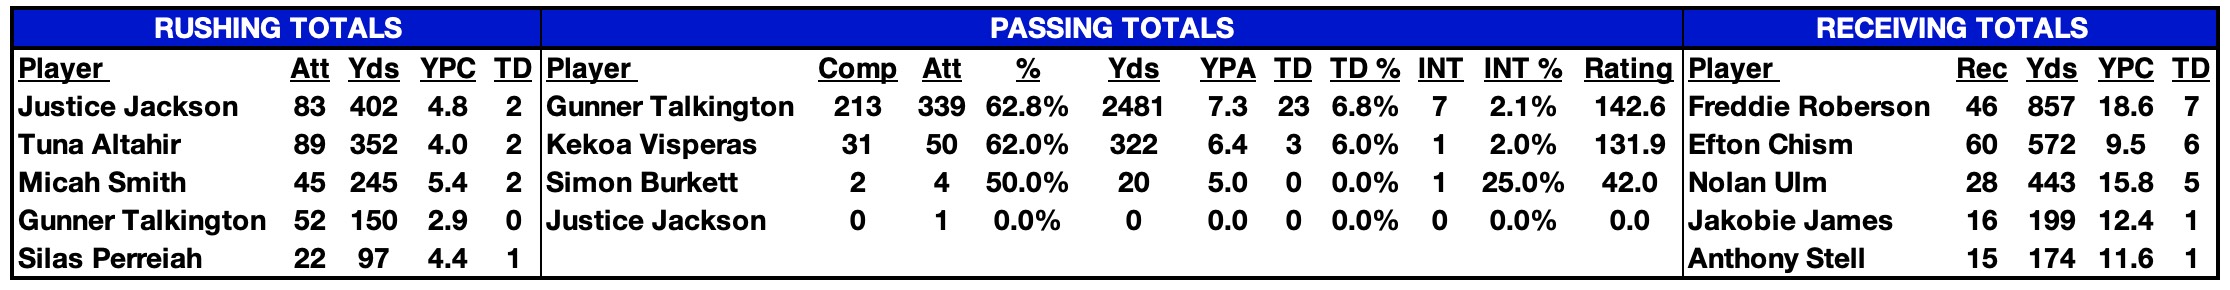
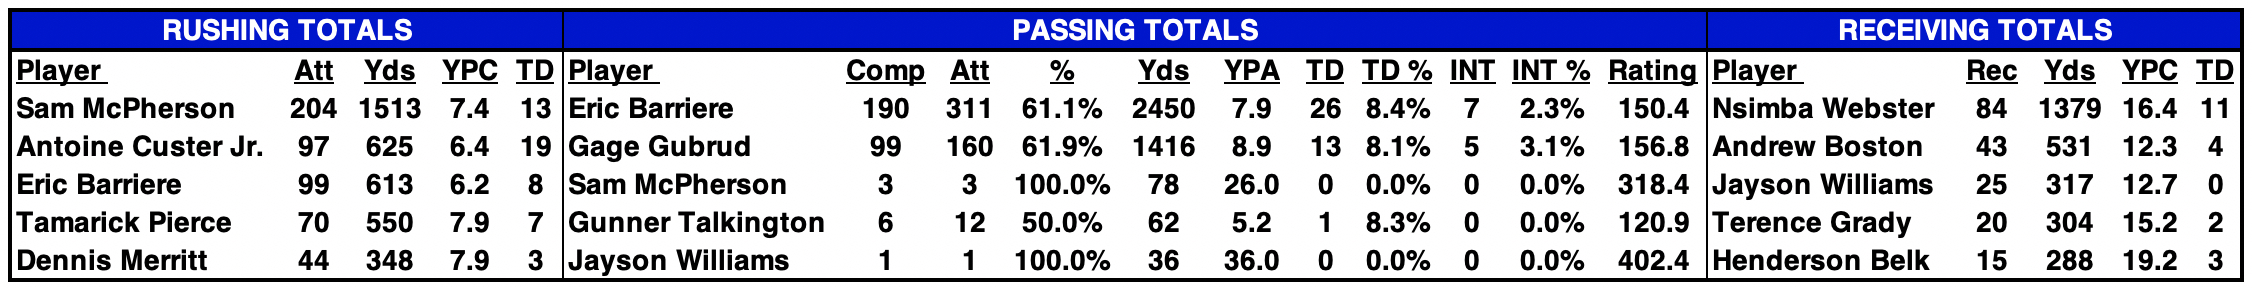
| 2024 STATISTICAL LEADERS |
|---|
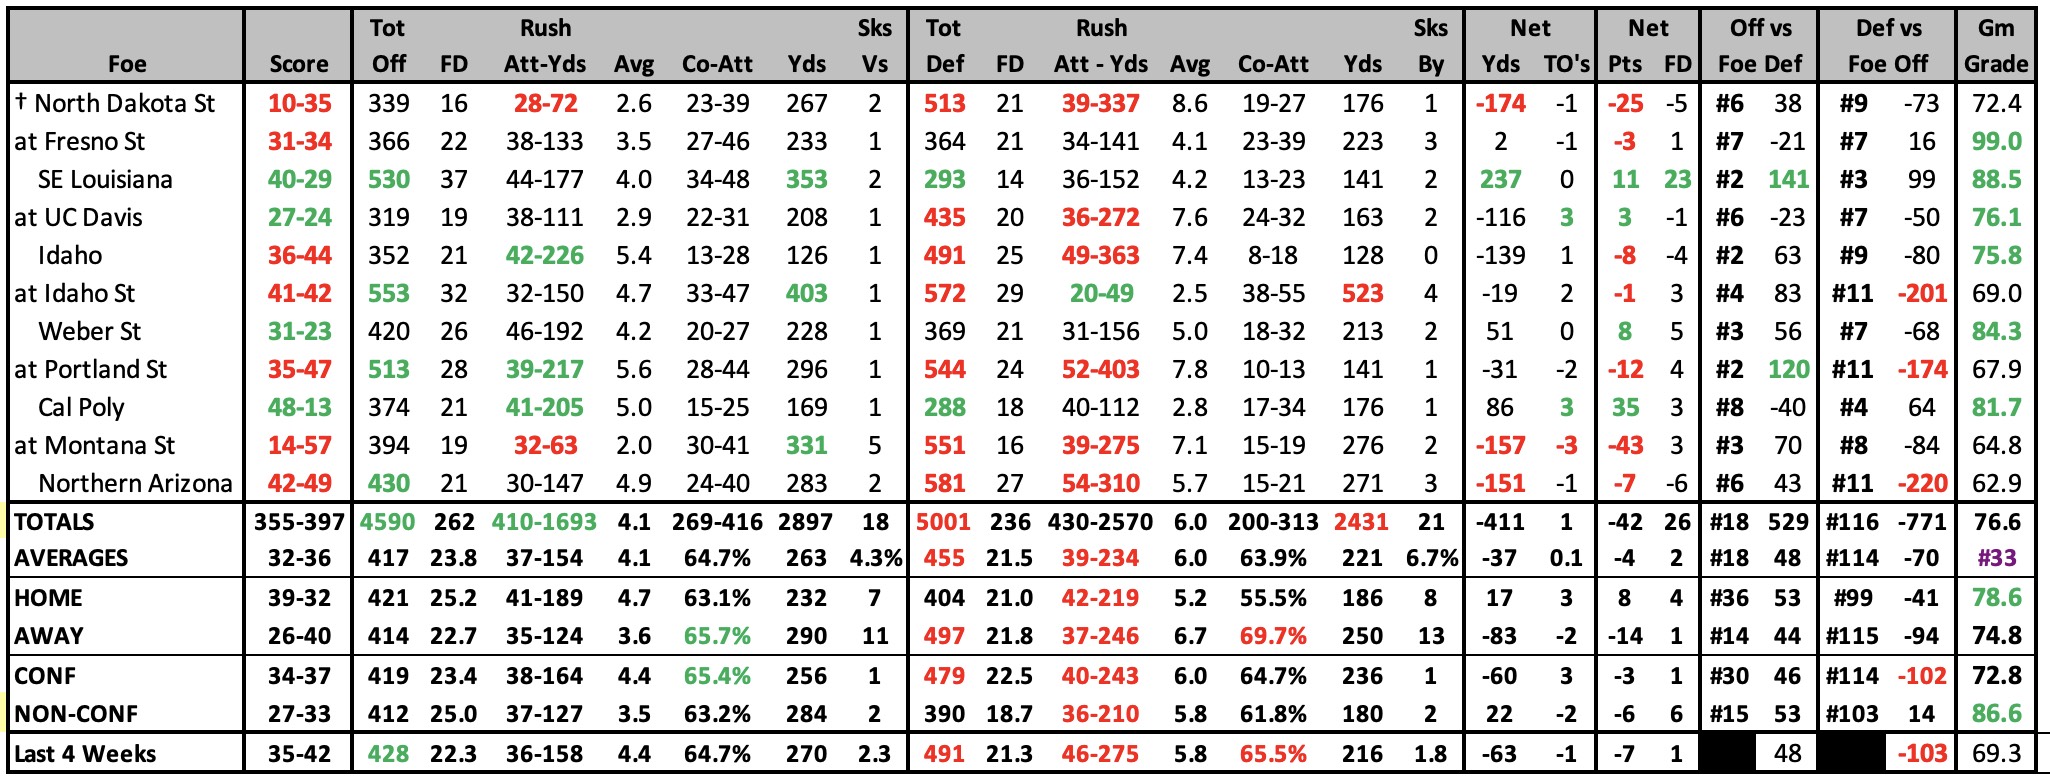
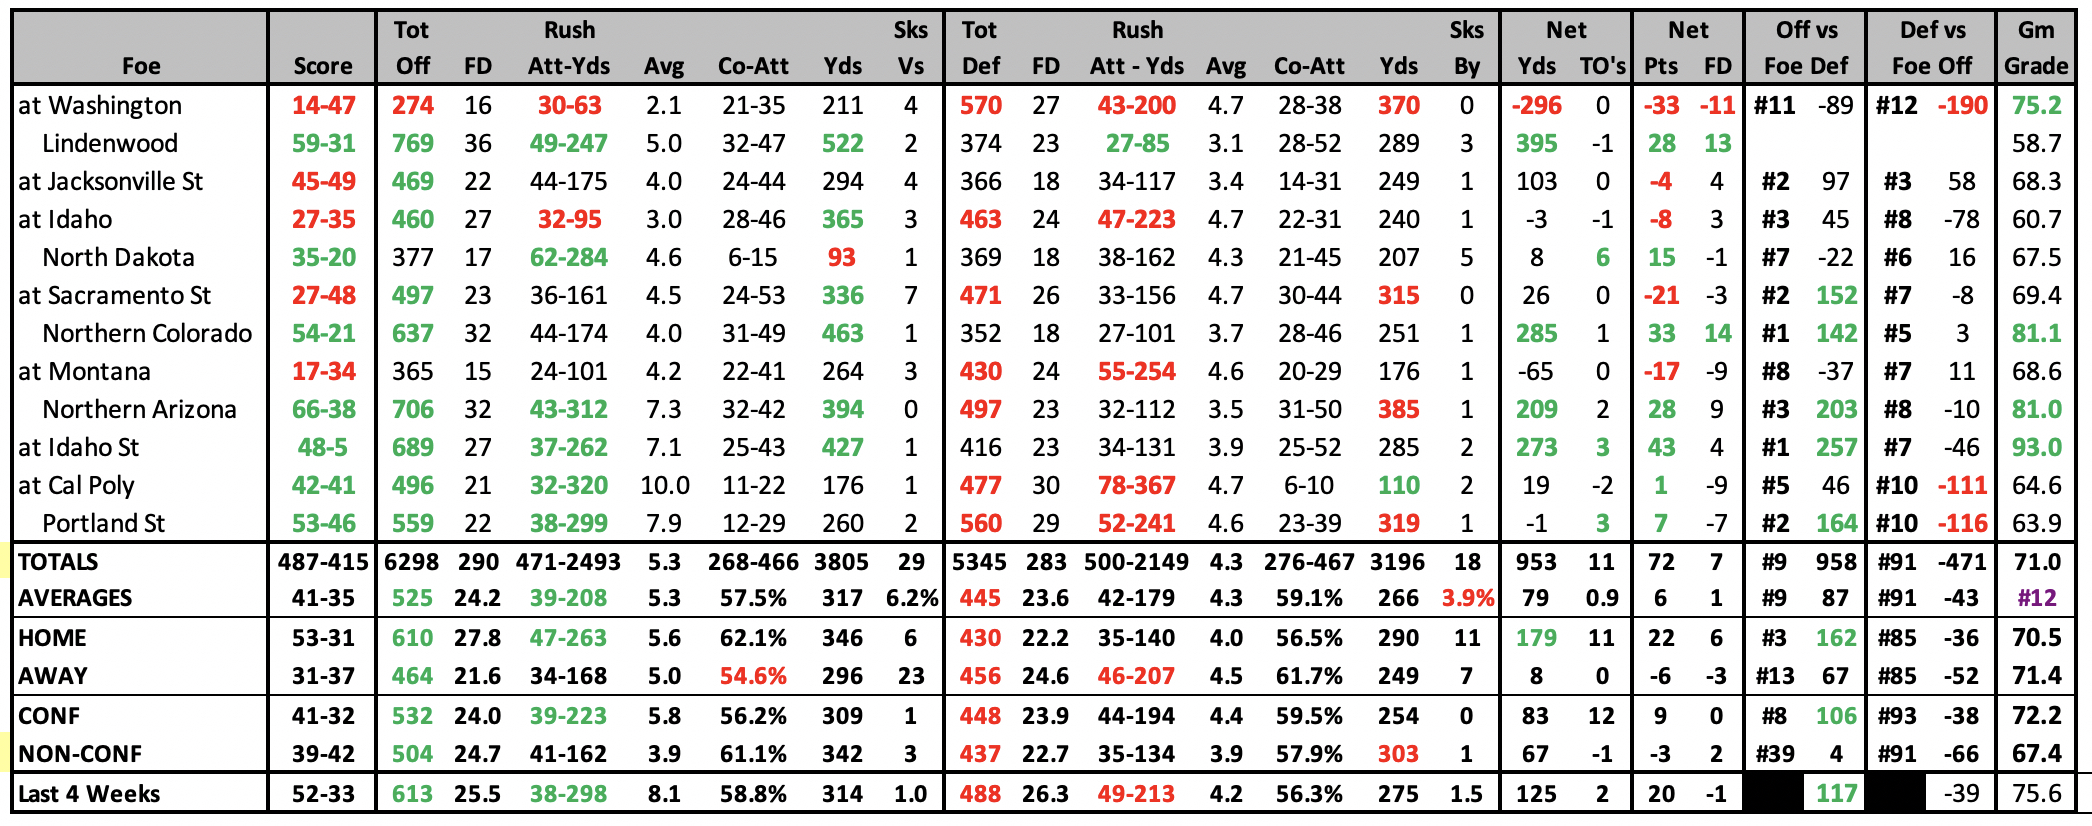
| 2024 GAME-BY-GAME STATS |
|---|
 |
| 2023 STATISTICAL LEADERS |
|---|
| 2023 GAME-BY-GAME STATS |
|---|
 |
| 2022 STATISTICAL LEADERS |
|---|
| 2022 GAME-BY-GAME STATS |
|---|
 |
| 2021 STATISTICAL LEADERS |
|---|
| 2021 GAME-BY-GAME STATS |
|---|
 |
| 2021 SPRING STATISTICAL LEADERS |
|---|
| 2021 SPRING GAME-BY-GAME STATS |
|---|
 |
| 2019 STATISTICAL LEADERS |
|---|
| 2019 GAME-BY-GAME STATS |
|---|
 |
| 2018 STATISTICAL LEADERS |
|---|
| 2018 GAME-BY-GAME STATS |
|---|
 |
| 2017 GAME-BY-GAME STATS |
|---|
 |
| 2016 GAME-BY-GAME STATS |
|---|
 |
| 2015 GAME-BY-GAME STATS |
|---|
 |
| 2014 GAME-BY-GAME STATS |
|---|
 |
| 2013 GAME-BY-GAME STATS |
|---|
 |
2013 SCHEDULE |
2012 RESULTS |
||||||||||||||||||||||||||||||||||||||||||||||||||||||||||||||||||||||||||||||||||||||||||||||||||||||||||||||||||||||||||||||||||||
|
|
| 2012 GAME-BY-GAME STATS |
|---|
 |
| 2011 GAME-BY-GAME STATS |
|---|
2011 SCHEDULE |
2010 RESULTS |
||||||||||||||||||||||||||||||||||||||||||||||||||||||||||||||||||||||||||||||||||||||||||||||||||||||||||||||||||||
|
|
||||||||||||||||||||||||||||||||||||||||||||||||||||||||||||||||||||||||||||||||||||||||||||||||||||||||||||||||||||
| 2010 GAME-BY-GAME STATS |
|---|
| SKS | SKS | |||||||||||||||||||||
| ATT | OPPONENT | FD | RUSH | - | YDS | AVG | CO | - | ATT | YDS | VS | FD | RUSH | - | YDS | AVG | CO | - | ATT | YDS | BY | TURN |
| 16,313 | at Nevada | 20 | 28 | - | 162 | 5.8 | 21 | - | 40 | 270 | 3 | 24 | 44 | - | 214 | 4.9 | 27 | - | 38 | 339 | 1 | -1 |
| 6,142 | Central Wash | 21 | 30 | - | 106 | 3.5 | 19 | - | 32 | 205 | 1 | 27 | 30 | - | 106 | 3.5 | 29 | - | 46 | 251 | 3 | 1 |
| 11,702 | Montana | 24 | 43 | - | 269 | 6.3 | 17 | - | 41 | 234 | 3 | 19 | 40 | - | 186 | 4.7 | 19 | - | 36 | 204 | 2 | 3 |
| 14,207 | at Montana St | 23 | 27 | - | 110 | 4.1 | 24 | - | 49 | 272 | 0 | 19 | 44 | - | 156 | 3.5 | 15 | - | 24 | 283 | 0 | -1 |
| 5,462 | at Weber St | 22 | 40 | - | 128 | 3.2 | 23 | - | 36 | 337 | 0 | 24 | 36 | - | 144 | 4 | 25 | - | 44 | 315 | 1 | 2 |
| 7,472 | N Arizona | 18 | 31 | - | 66 | 2.1 | 20 | - | 26 | 288 | 2 | 24 | 37 | - | 39 | 1.1 | 30 | - | 50 | 278 | 2 | -2 |
| 3,784 | at N Colorado | 16 | 31 | - | 209 | 6.7 | 16 | - | 25 | 172 | 1 | 19 | 46 | - | 133 | 2.9 | 19 | - | 30 | 229 | 3 | 1 |
| 7,147 | Sacramento St | 15 | 28 | - | 182 | 6.5 | 15 | - | 28 | 141 | 1 | 19 | 51 | - | 161 | 3.2 | 12 | - | 32 | 235 | 3 | 0 |
| 4,097 | at Portland St | 19 | 29 | - | 222 | 7.7 | 14 | - | 24 | 301 | 0 | 25 | 42 | - | 129 | 3.1 | 28 | - | 57 | 323 | 0 | 0 |
| 5,357 | S Utah | 19 | 32 | - | 155 | 4.8 | 21 | - | 34 | 211 | 3 | 28 | 30 | - | 50 | 1.7 | 34 | - | 53 | 434 | 6 | 3 |
| 5,781 | Idaho St | 27 | 41 | - | 136 | 3.3 | 29 | - | 42 | 271 | 3 | 13 | 21 | - | 57 | 2.7 | 15 | - | 33 | 186 | 1 | 2 |
| 3,665 | SE Missouri St | 22 | 42 | - | 217 | 5.2 | 21 | - | 34 | 178 | 0 | 8 | 40 | - | 199 | 5 | 6 | - | 15 | 69 | 1 | 2 |
| 4,060 | North Dakota St | 16 | 38 | - | 241 | 6.3 | 13 | - | 32 | 141 | 5 | 16 | 51 | - | 188 | 3.7 | 12 | - | 24 | 128 | 3 | -2 |
| 6,600 | Villanova | 18 | 31 | - | 113 | 3.6 | 27 | - | 38 | 292 | 0 | 16 | 41 | - | 135 | 3.3 | 12 | - | 21 | 95 | 4 | 4 |
| 13,027 | Delaware | 20 | 21 | - | 25 | 1.2 | 29 | - | 43 | 302 | 2 | 26 | 46 | - | 197 | 4.3 | 22 | - | 34 | 220 | 3 | 0 |
| TOTALS | 300 | 492 | - | 2341 | 4.8 | 309 | - | 524 | 3615 | 24 | 307 | 599 | - | 2094 | 3.5 | 305 | - | 537 | 3589 | 33 | 12 | |
| AVERAGES | 20 | 33 | - | 156 | 4.8 | 21 | - | 35 | 241 | 1.6 | 20.5 | 40 | - | 140 | 3.5 | 20 | - | 36 | 239 | 2.2 | 0.8 |
| 2009-2006 RESULTS |
|---|
| 2009 | 2008 | 2007 | 2006 | ||||||||
| Western Oregon | 35-14 | at | Texas Tech | 24-49 | Western Montana | 52-13 | at | Oregon St | 17-56 | ||
| at | California | 7-59 | at | Colorado | 24-31 | UC Davis | 41-31 | at | West Virginia | 3-52 | |
| Northern Colorado | 16-0 | Western Washington | 52-31 | at | Idaho St | 34-7 | Central Washington | 14-21 | |||
| at | Sacramento St | 56-30 | Idaho St | 45-31 | Portland St | 21-28 | at | Montana St | 19-10 | ||
| at | Idaho St | 38-3 | at | Portland St | 36-47 | at | Montana | 23-24 | Sacramento St | 20-21 | |
| Weber St | 13-31 | Montana | 3-19 | Montana St | 35-13 | Montana | 17-33 | ||||
| at | Montana | 34-41 | at | Montana St | 34-17 | at | BYU | 7-42 | at | Northern Colorado | 34-0 |
| Montana St | 35-24 | Sacramento St | 13-15 | at | Sacramento St | 38-30 | at | Portland St | 0-34 | ||
| Portland St | 47-10 | at | Northern Colorado | 31-16 | Northern Colorado | 17-7 | Northern Arizona | 36-44 | |||
| at | Southern Utah | 41-28 | Northern Arizona | 28-13 | at | Northern Arizona | 52-24 | at | Weber St | 14-19 | |
| at | Northern Arizona | 49-45 | at | Weber St | 33-26 | Weber St | 38-16 | Idaho St | 40-6 | ||
| at | Stephen F. Austin | 33-44 | at | McNeese St | 44-15 | ||||||
| at | Appalachian St | 35-38 |