
LOUISVILLE CARDINALS |
|
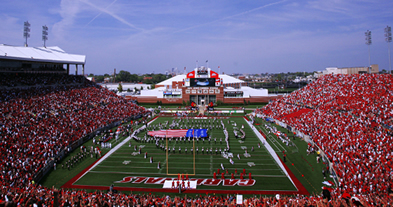
L&N Federal Credit Union Stadium
|
LOUISVILLE QUICK FACTS |
 |
| LOCATION: Louisville, Kentucky | |
| FOUNDED: 1798 1st year FB 1910 | |
| ENROLLMENT: 15,761 | |
| COLORS: Red & Black | |
| MASCOT: Cardinals | |
| CONFERENCE: ACC- Atlantic | |
| HEAD COACH: Jeff Brohm | |
| YEARS WITH TEAM: 3rd | |
| OVERALL RECORD: 85-52 | |
| RECORD WITH TEAM: 19-8 |
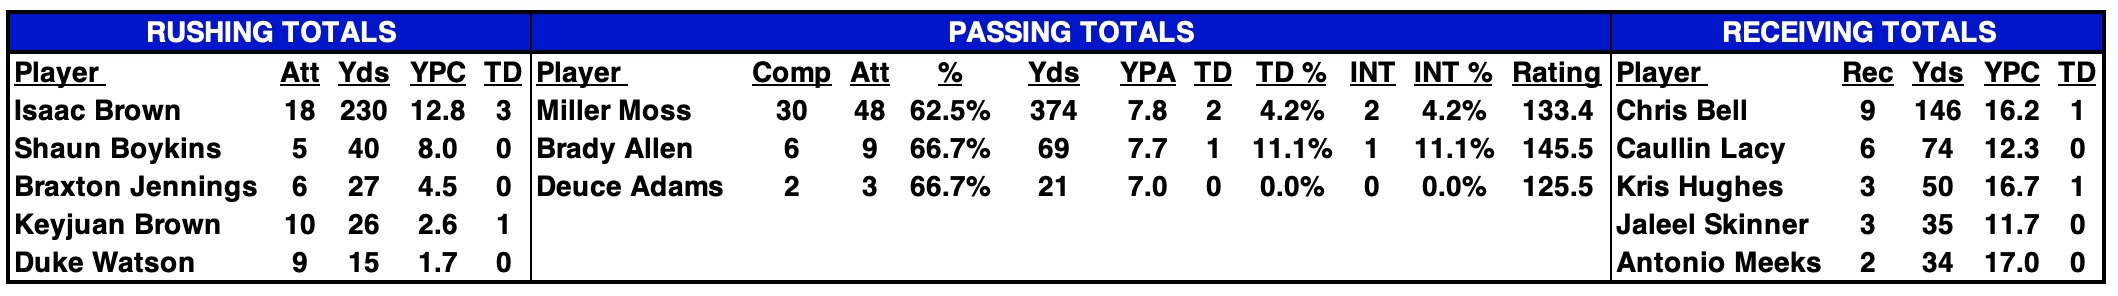
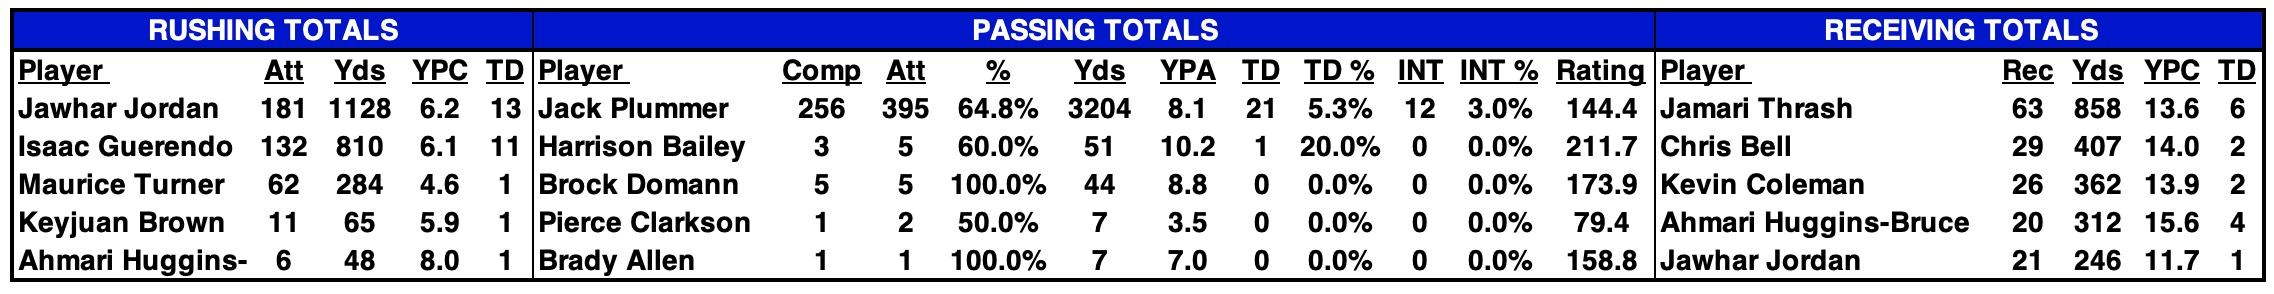
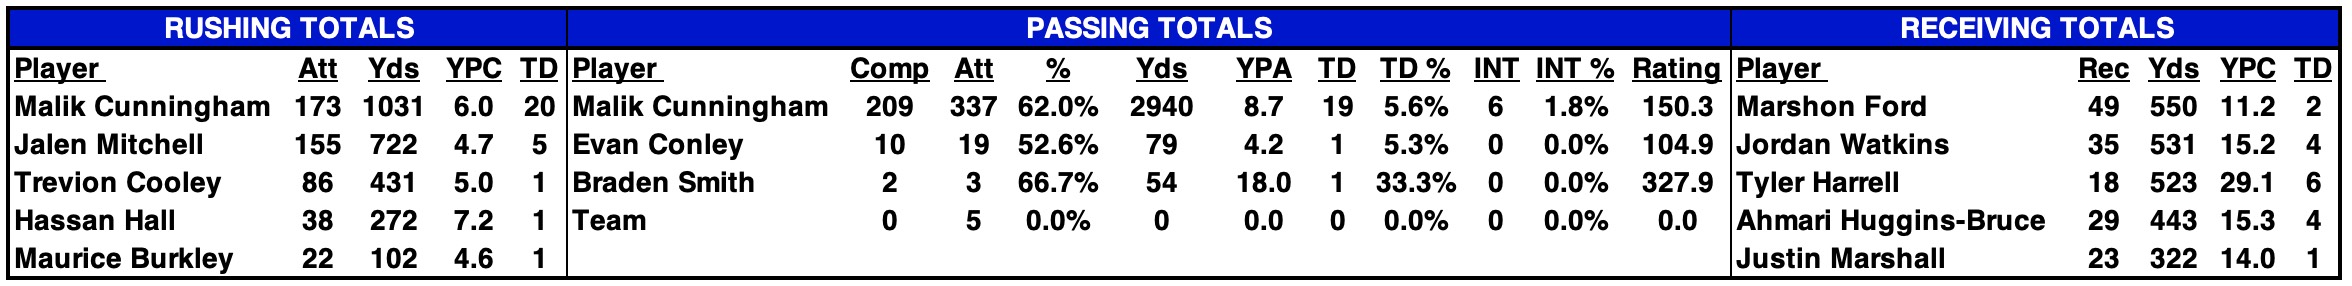
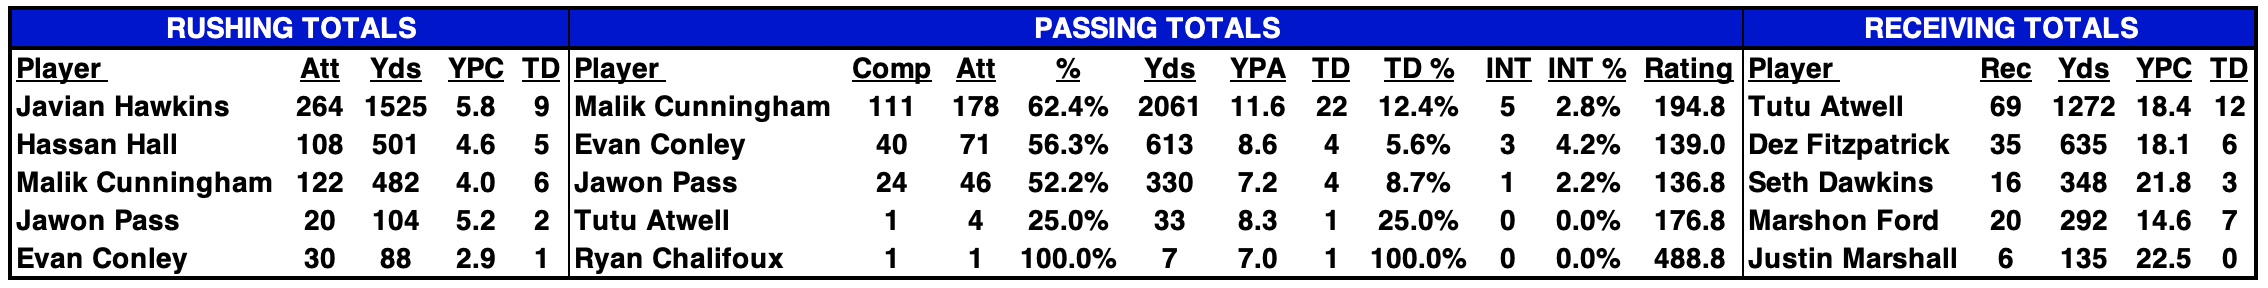
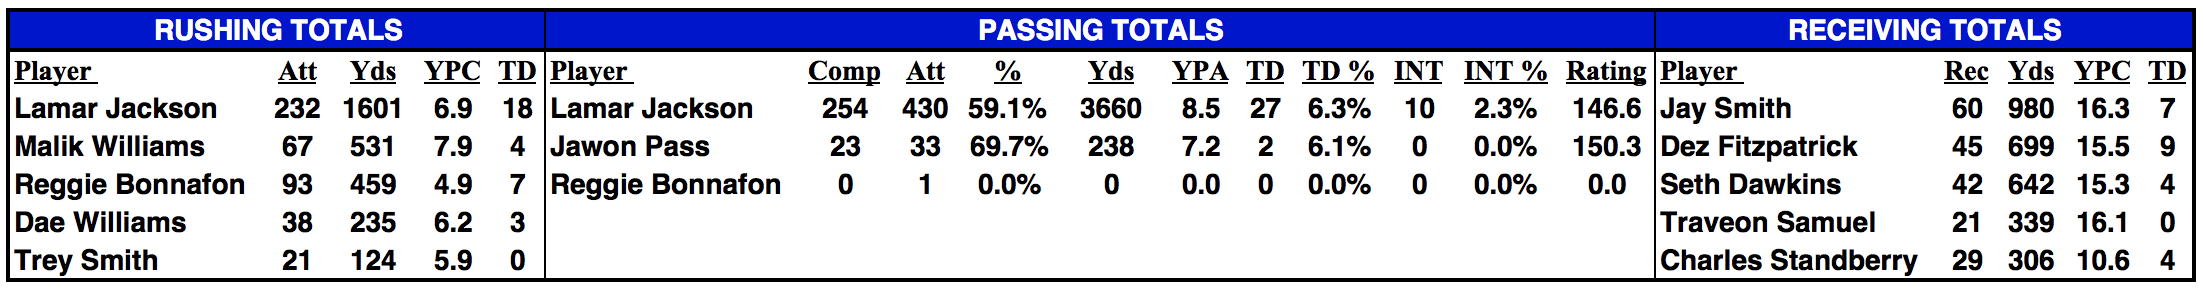
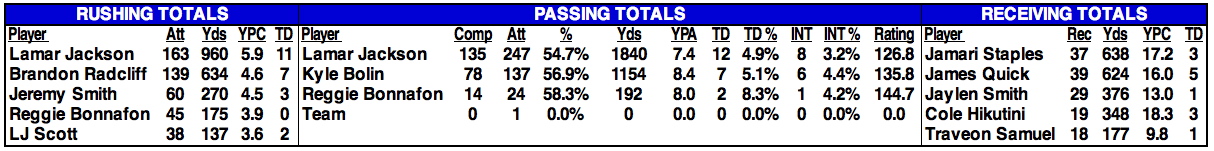
| 2025 STATISTICAL LEADERS |
|---|
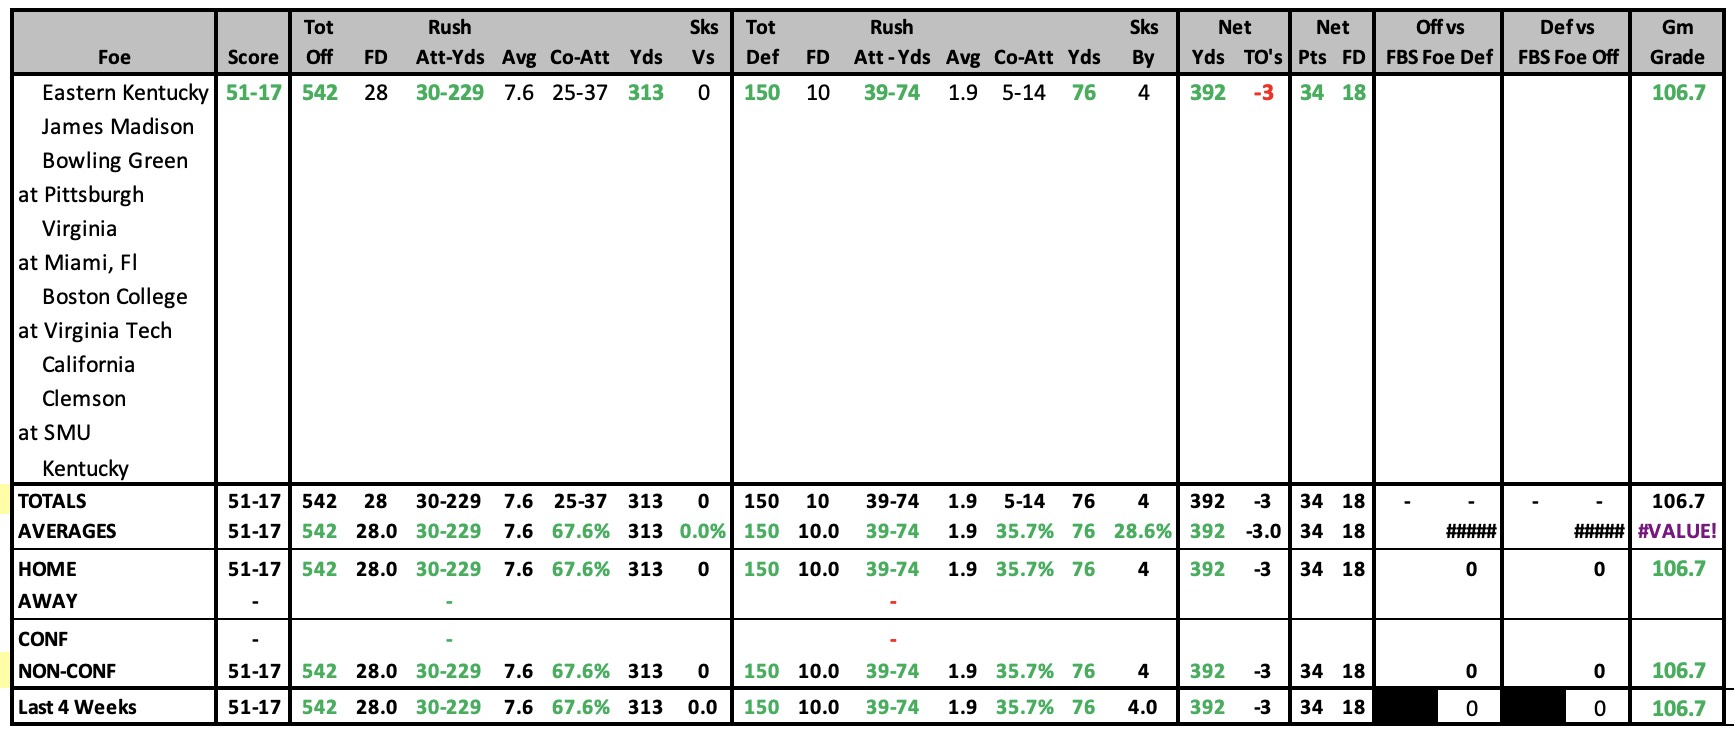
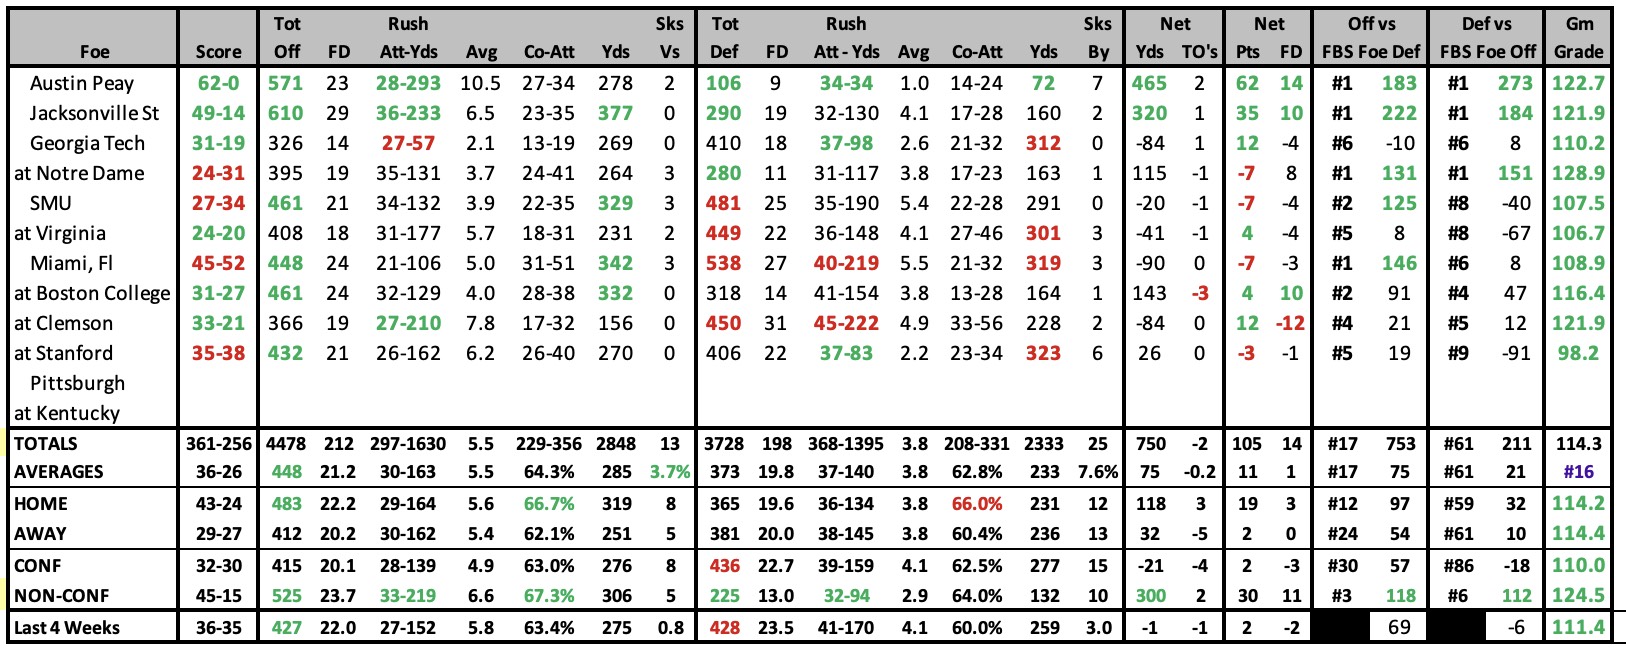
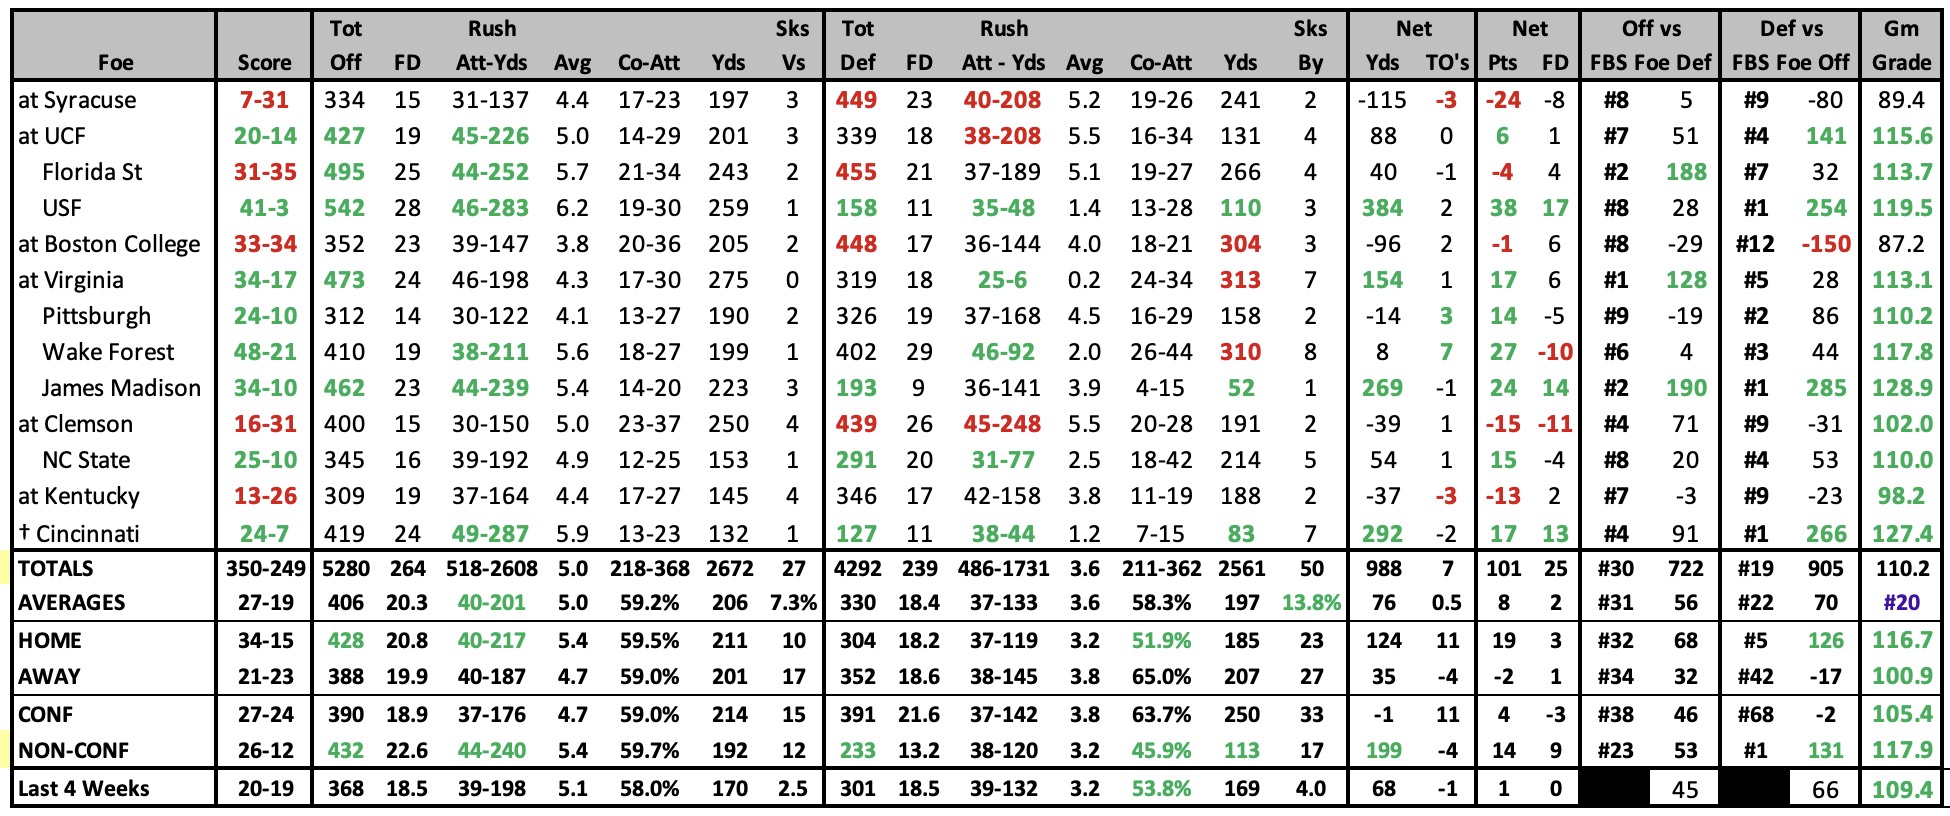
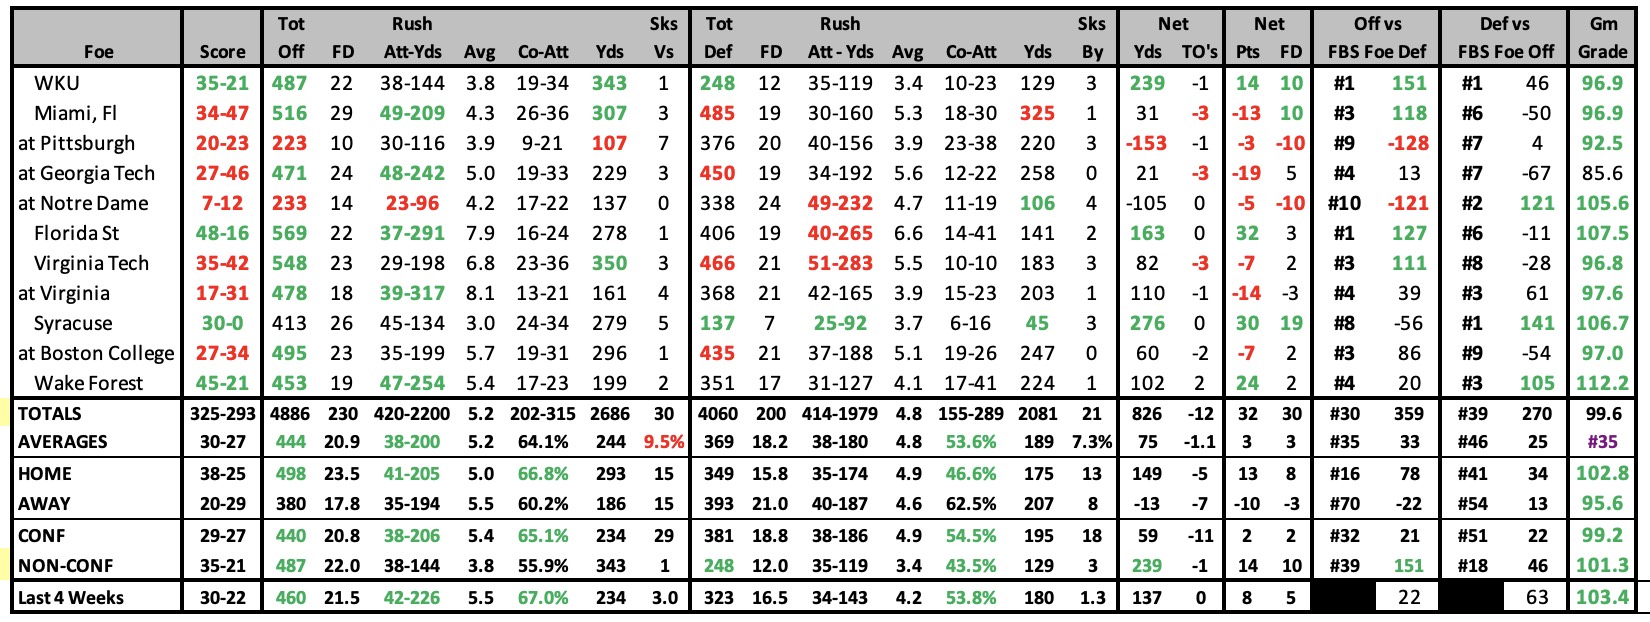
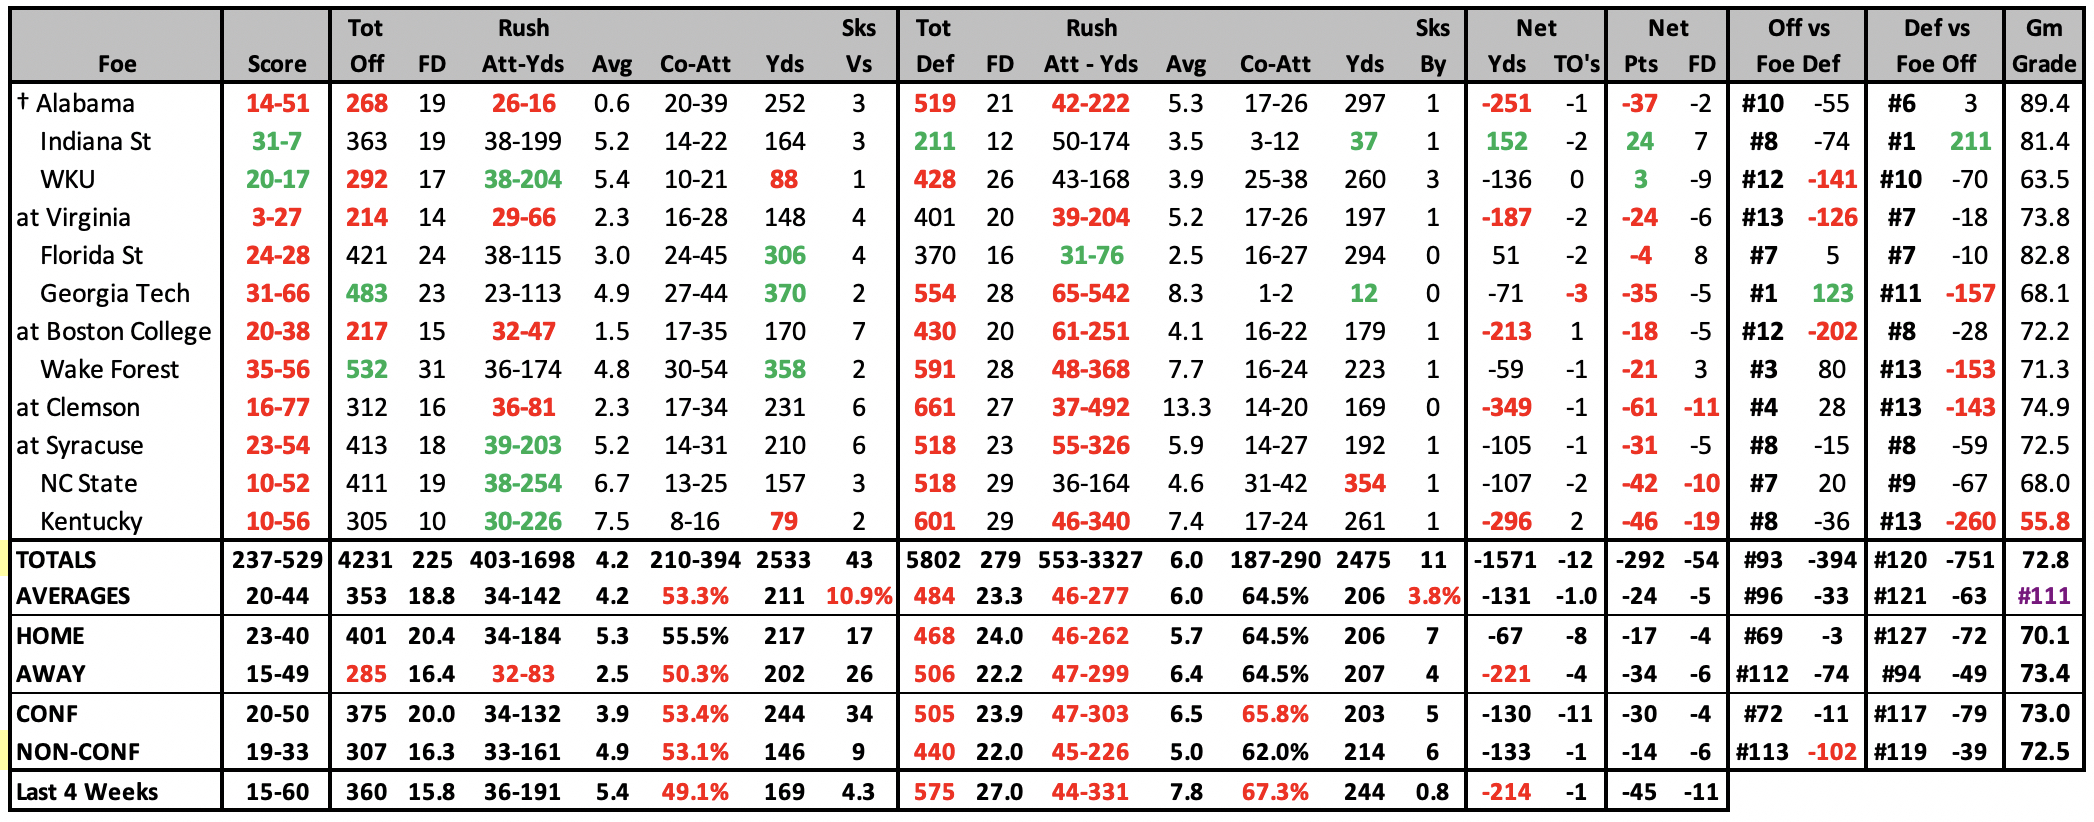
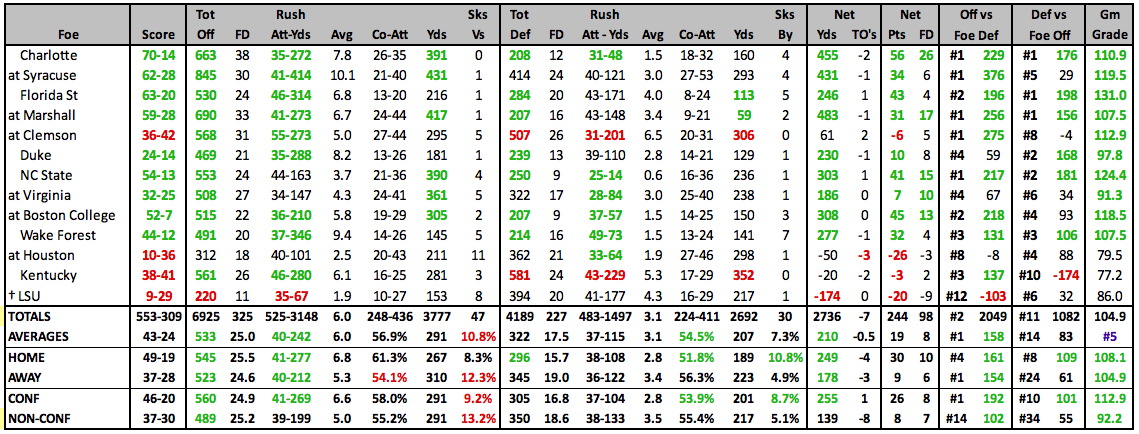
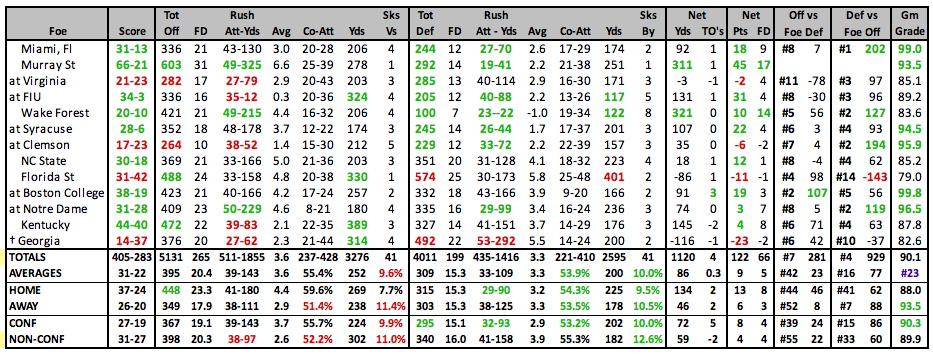
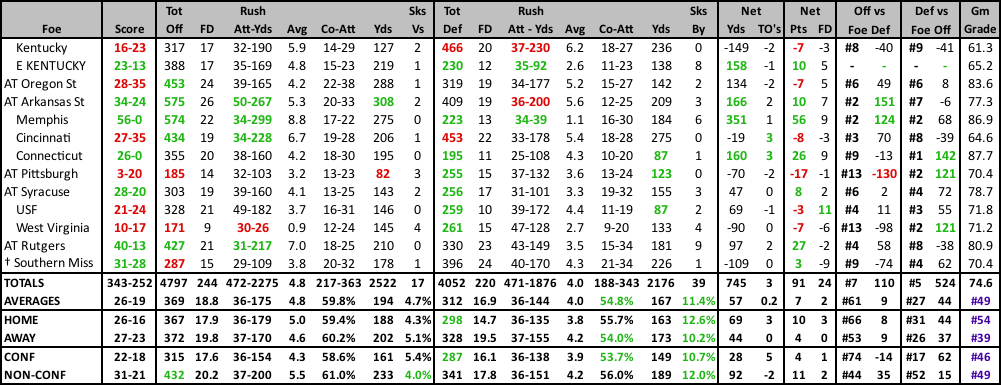
2025 GAME BY GAME STATS |
|---|
 |
2025 SCHEDULE |
2024 RESULTS |
||||||||||||||||||||||||||||||||||||||||||||||||||||||||||||||||||||||||||||||||||||||||||||||||||||||||||||||||||||||||||||||||||||||||||||||||||||||||||||||||||||||||||||||||||||||||||||||||||||||||||||||||||
|
|
||||||||||||||||||||||||||||||||||||||||||||||||||||||||||||||||||||||||||||||||||||||||||||||||||||||||||||||||||||||||||||||||||||||||||||||||||||||||||||||||||||||||||||||||||||||||||||||||||||||||||||||||||
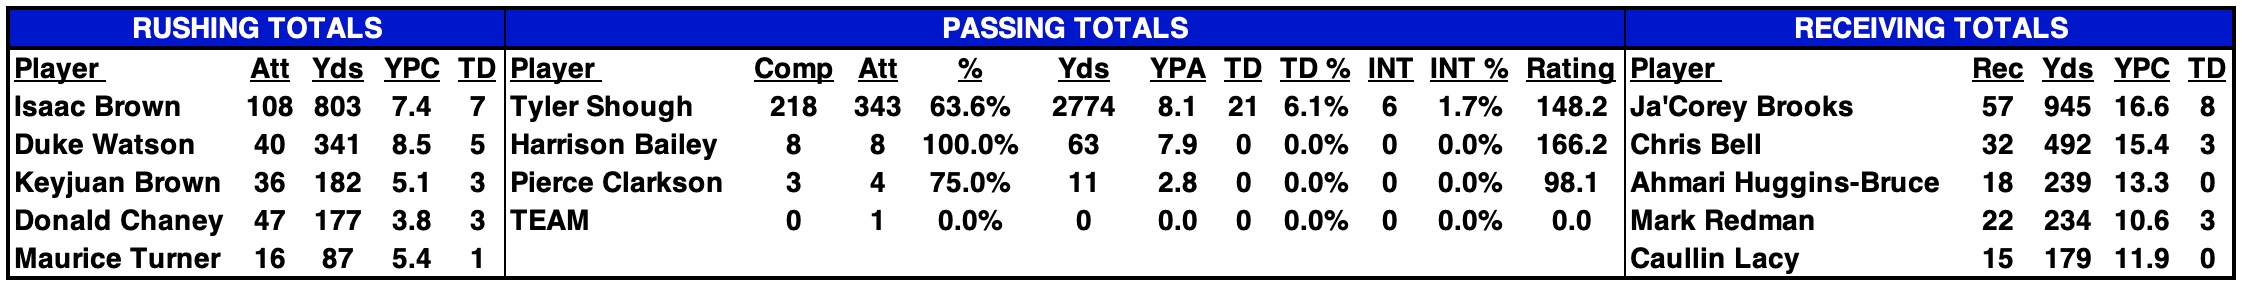
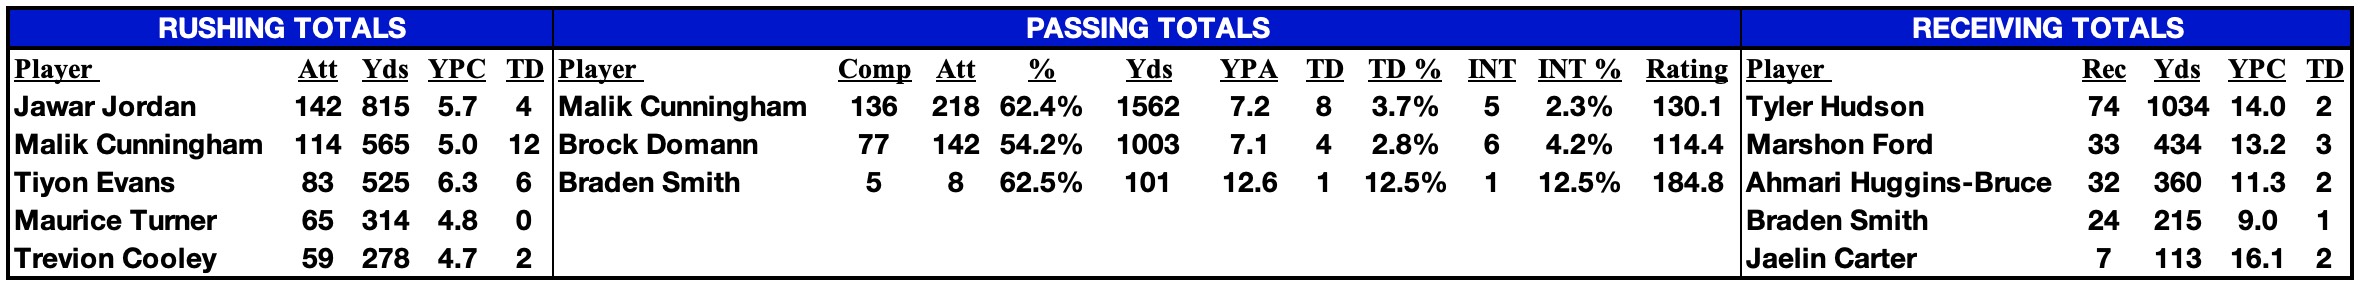
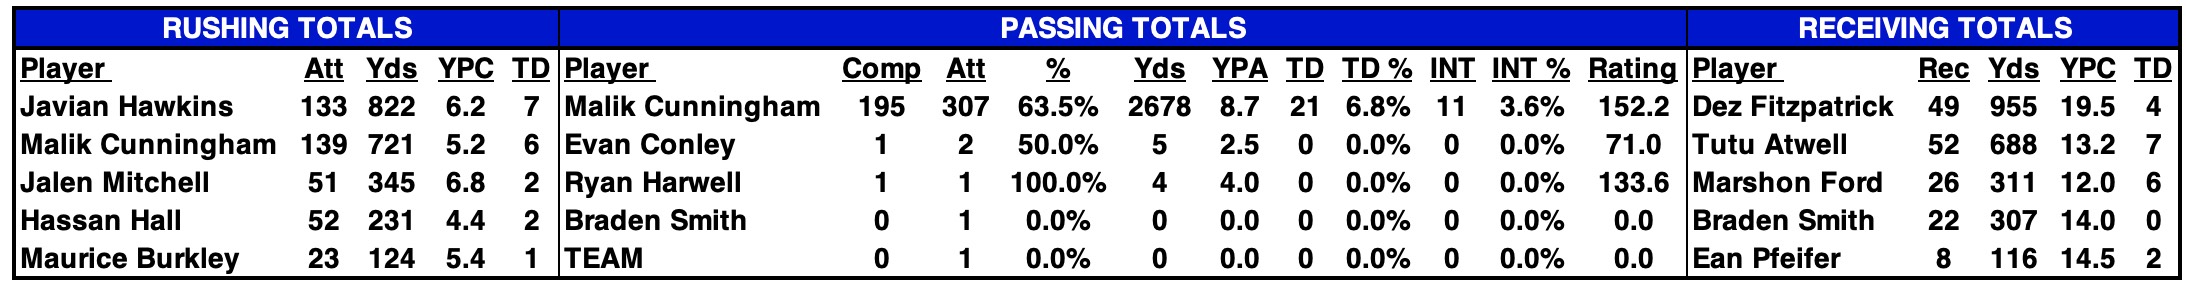
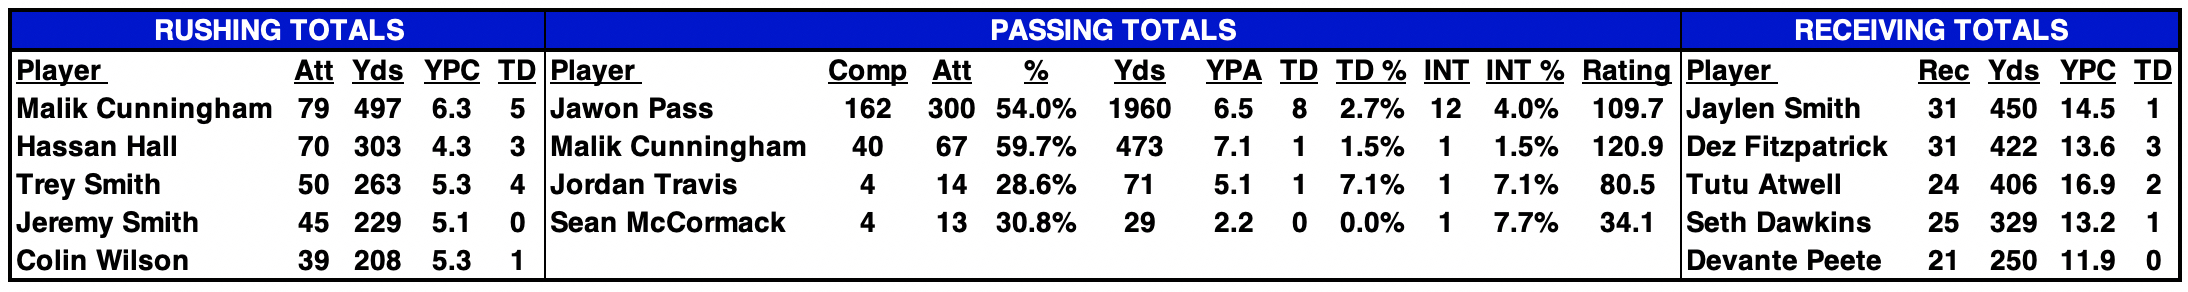
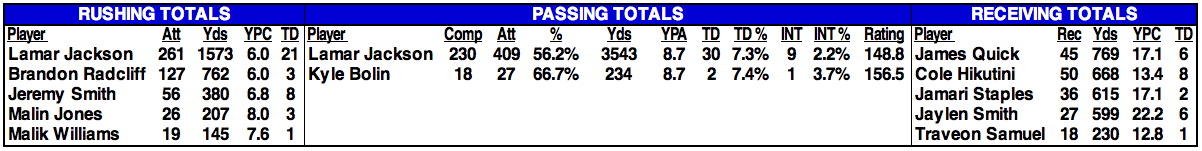
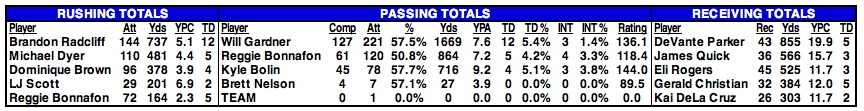
| 2024 STATISTICAL LEADERS |
|---|
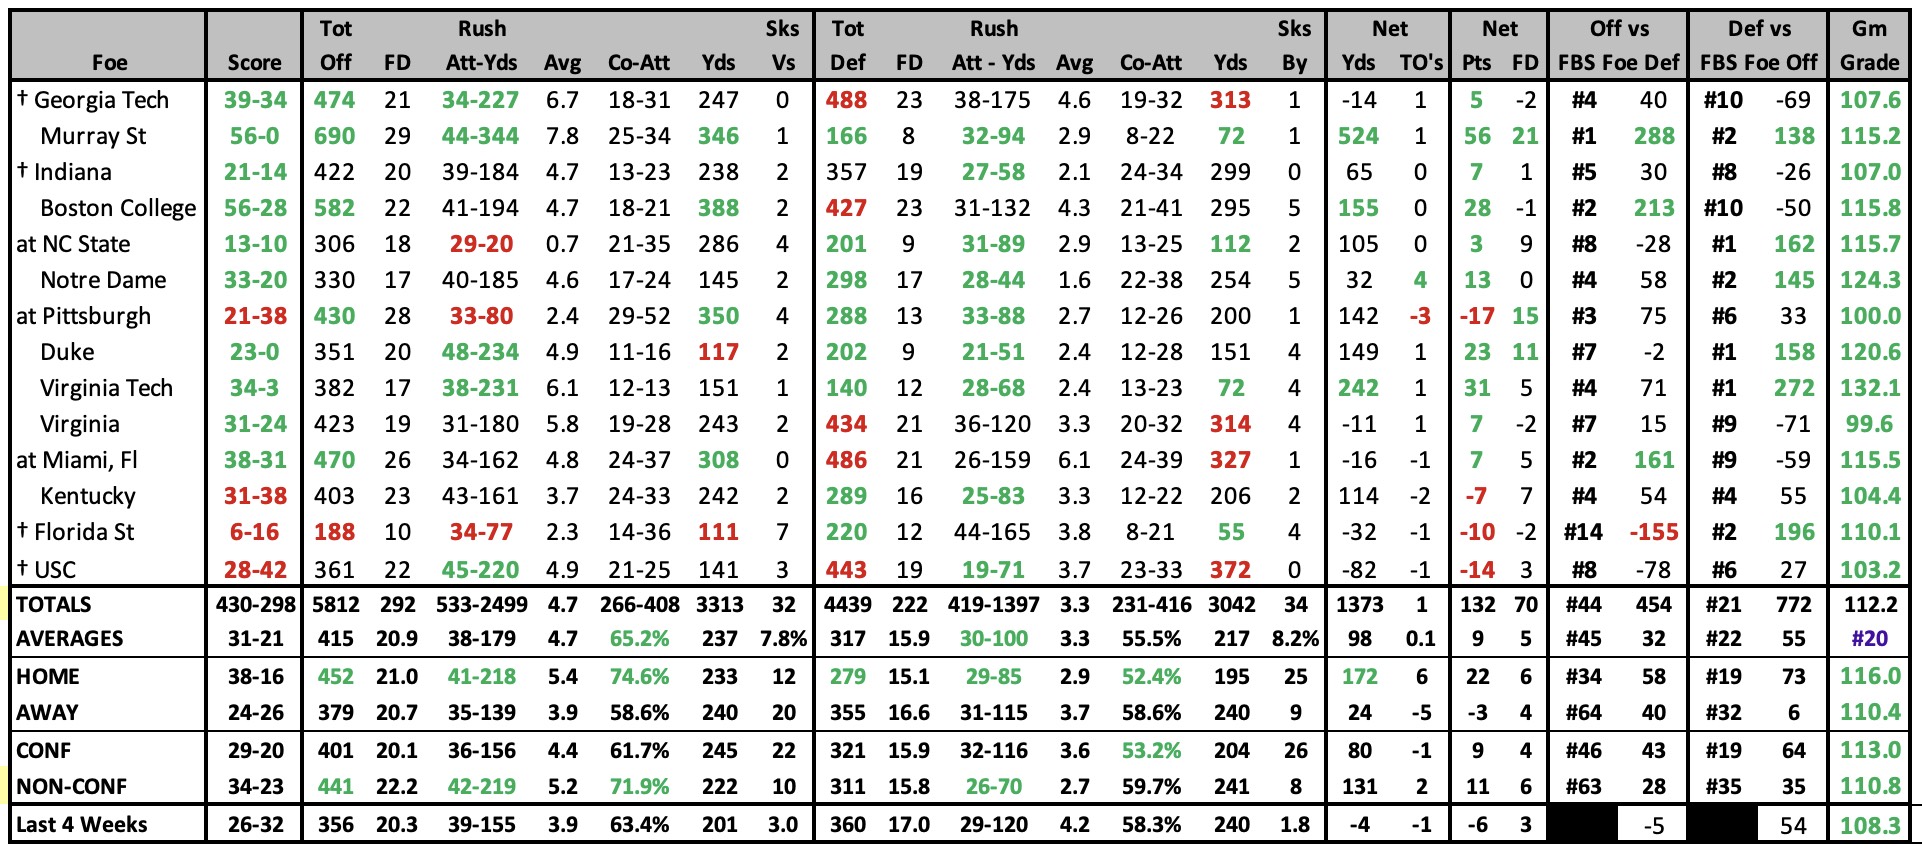
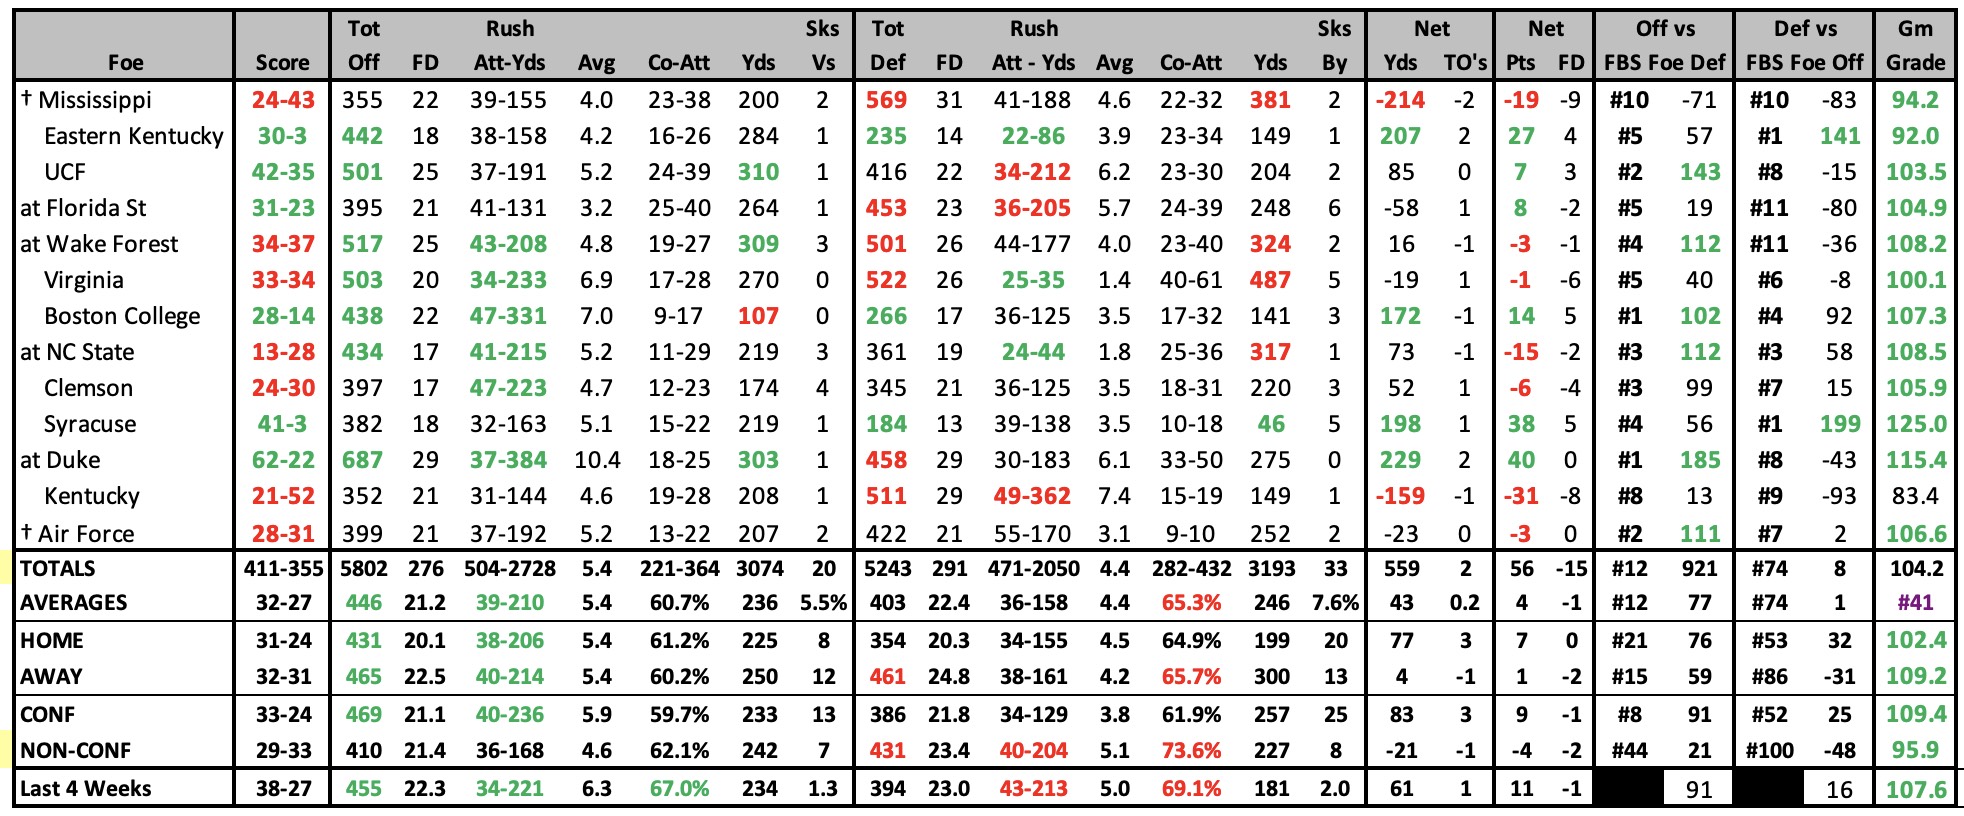
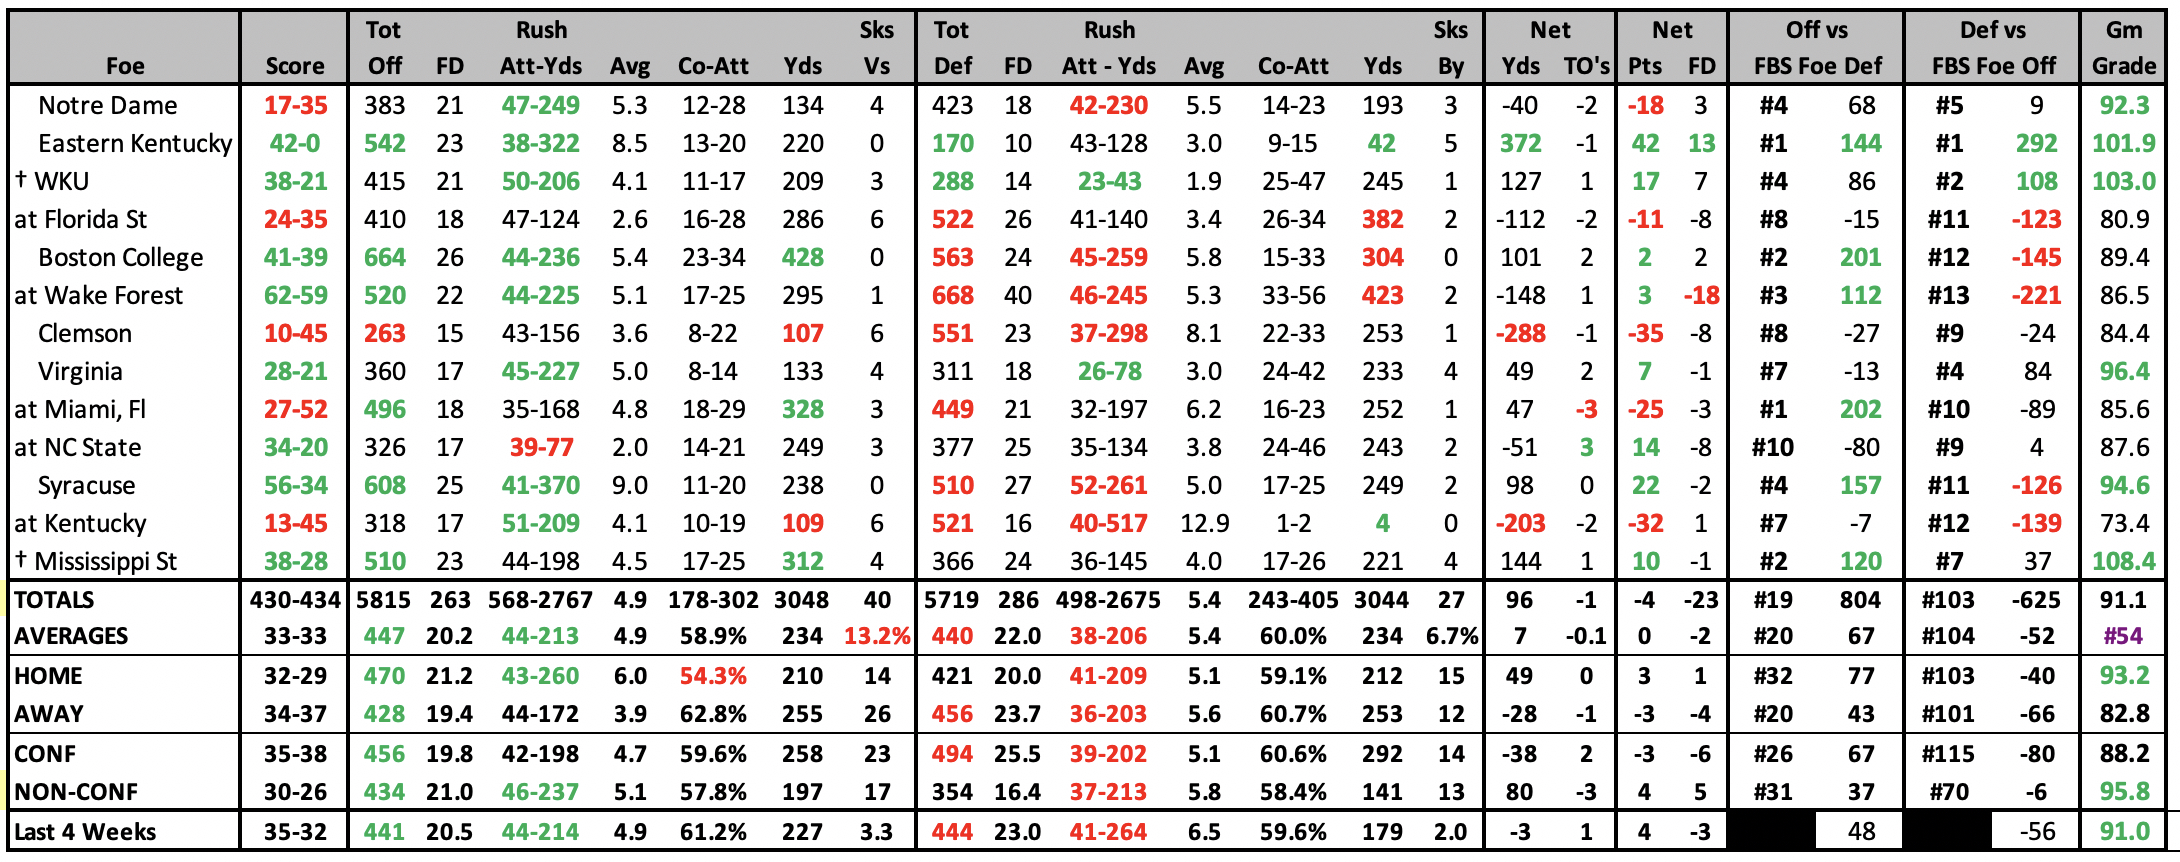
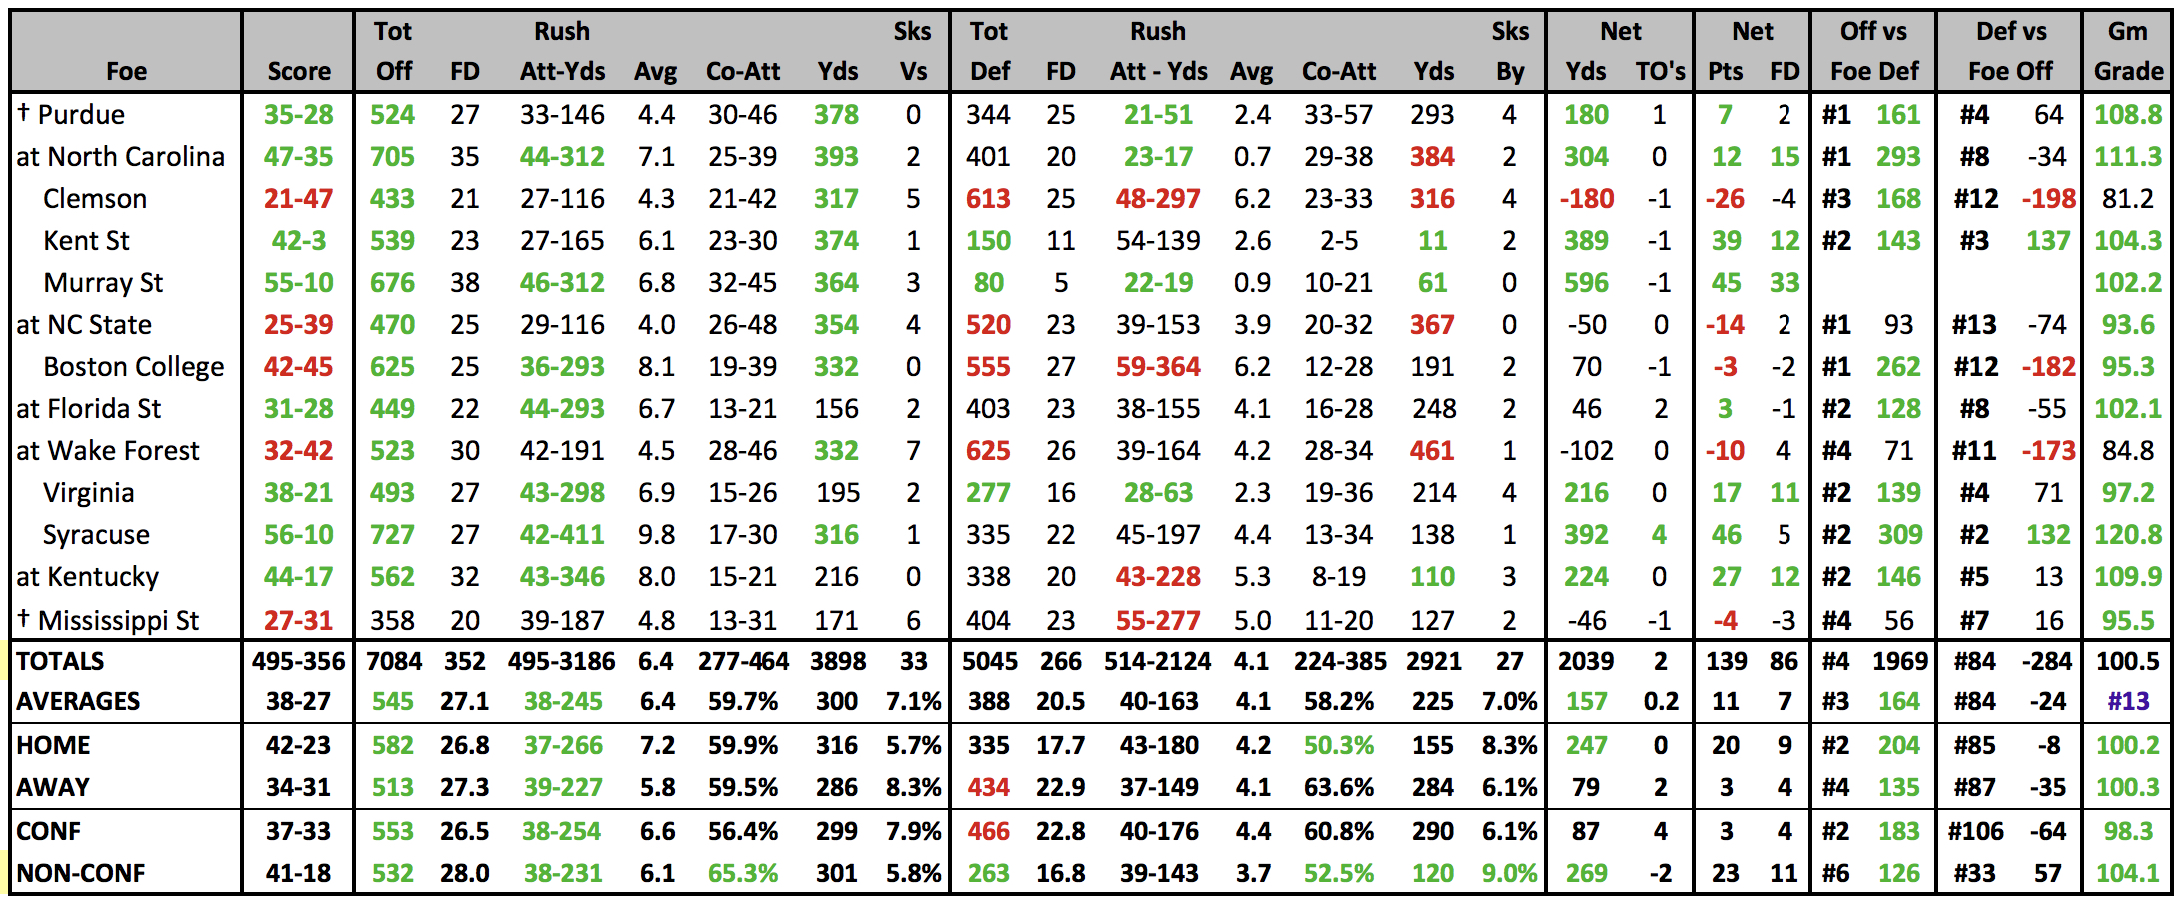
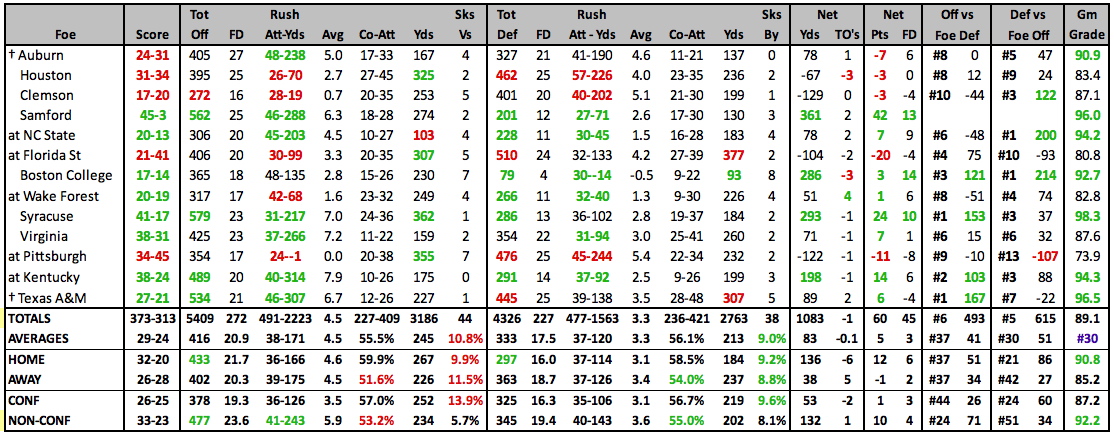
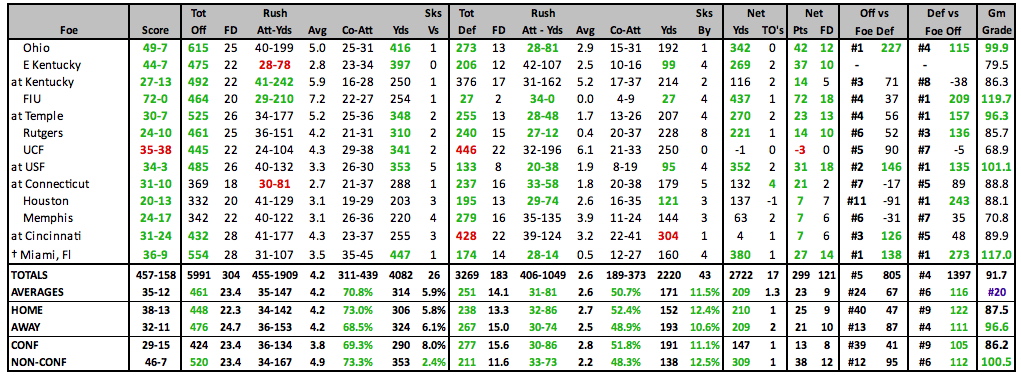
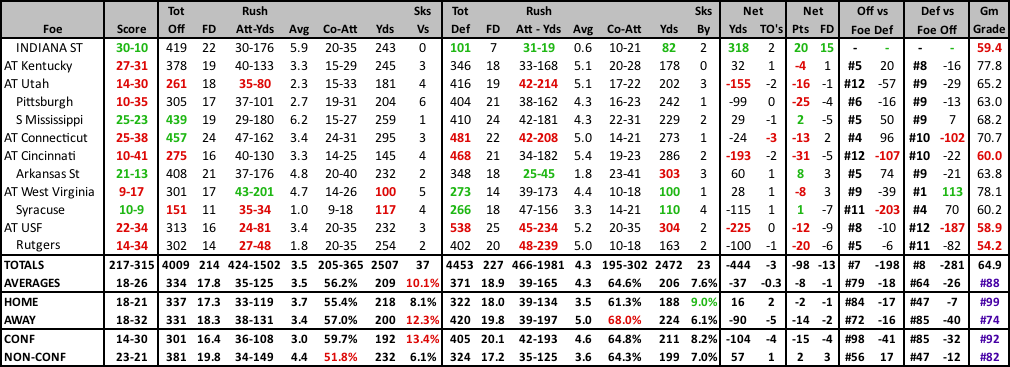
2024 GAME BY GAME STATS |
|---|
 |
2024 SCHEDULE |
2023 RESULTS |
||||||||||||||||||||||||||||||||||||||||||||||||||||||||||||||||||||||||||||||||||||||||||||||||||||||||||||||||||||||||||||||||||||||||||||||||||||||||||||||||||||||||||||||||||||||||||||||||||||||||||||||||||||||||
|
|
||||||||||||||||||||||||||||||||||||||||||||||||||||||||||||||||||||||||||||||||||||||||||||||||||||||||||||||||||||||||||||||||||||||||||||||||||||||||||||||||||||||||||||||||||||||||||||||||||||||||||||||||||||||||
| 2023 STATISTICAL LEADERS |
|---|
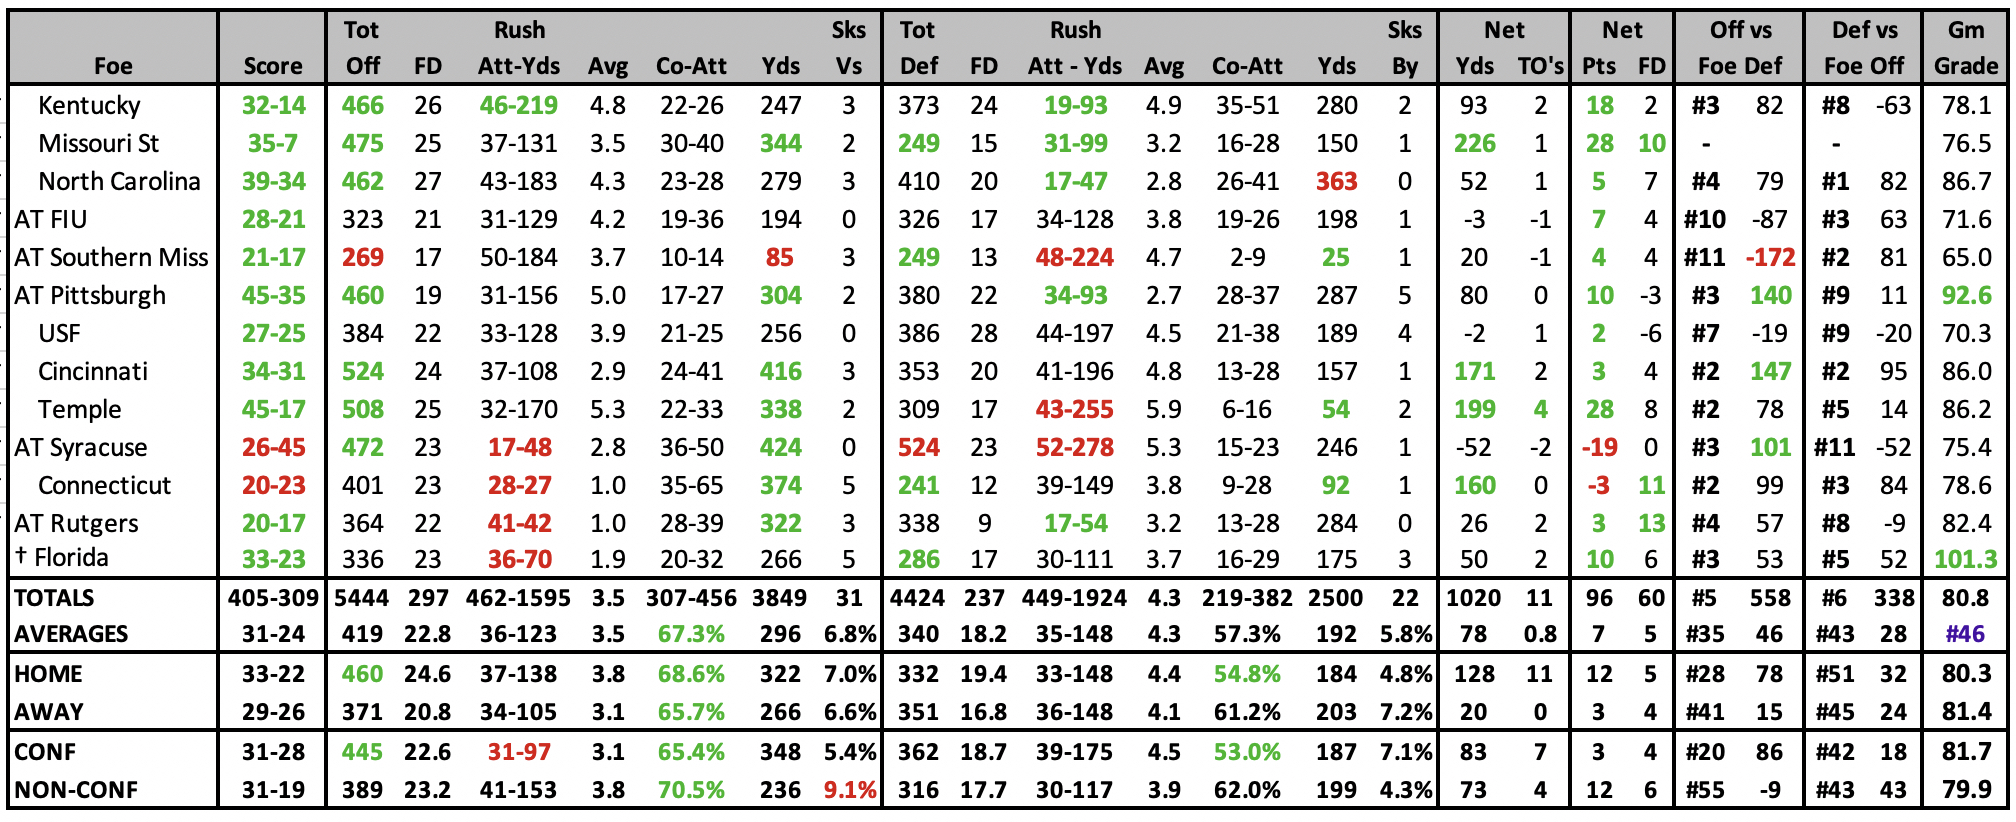
2023 GAME BY GAME STATS |
|---|
 |
2023 SCHEDULE |
2022 RESULTS |
||||||||||||||||||||||||||||||||||||||||||||||||||||||||||||||||||||||||||||||||||||||||||||||||||||||||||||||||||||||||||||||||||||||||||||||||||||||||||||||||||||||||||||||||||||||||||||||||||||||||||||||||||
|
|
||||||||||||||||||||||||||||||||||||||||||||||||||||||||||||||||||||||||||||||||||||||||||||||||||||||||||||||||||||||||||||||||||||||||||||||||||||||||||||||||||||||||||||||||||||||||||||||||||||||||||||||||||
| 2022 STATISTICAL LEADERS |
|---|
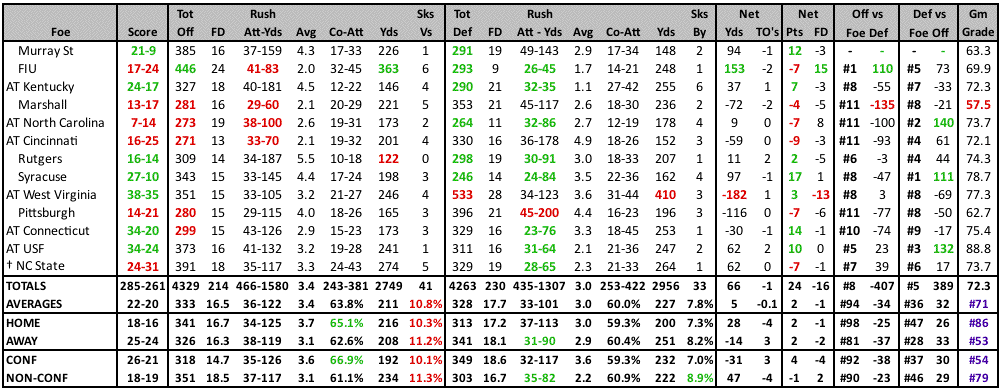
2022 GAME BY GAME STATS |
|---|
 |
2022 SCHEDULE |
2021 RESULTS |
||||||||||||||||||||||||||||||||||||||||||||||||||||||||||||||||||||||||||||||||||||||||||||||||||||||||||||||||||||||||||||||||||||||||||||||||||||||||||||||||||||||||||||||||||||||||||||||||||||||
|
|
||||||||||||||||||||||||||||||||||||||||||||||||||||||||||||||||||||||||||||||||||||||||||||||||||||||||||||||||||||||||||||||||||||||||||||||||||||||||||||||||||||||||||||||||||||||||||||||||||||||
| 2021 STATISTICAL LEADERS |
|---|
2021 GAME BY GAME STATS |
|---|
 |
2021 SCHEDULE |
2020 RESULTS |
||||||||||||||||||||||||||||||||||||||||||||||||||||||||||||||||||||||||||||||||||||||||||||||||||||||||||||||||||||||||||||||||||||||||||||||||||||||||||||||||||||||||||||||||||||||||||
|
|
||||||||||||||||||||||||||||||||||||||||||||||||||||||||||||||||||||||||||||||||||||||||||||||||||||||||||||||||||||||||||||||||||||||||||||||||||||||||||||||||||||||||||||||||||||||||||
| 2020 STATISTICAL LEADERS |
|---|
2020 GAME BY GAME STATS |
|---|
 |
2019 SCHEDULE |
2019 RESULTS |
||||||||||||||||||||||||||||||||||||||||||||||||||||||||||||||||||||||||||||||||||||||||||||||||||||||||||||||||||||||||||||||||||||||||||||||||||||||||||||||||||||||||||||||||||||||||||||||||||||||
|
|
||||||||||||||||||||||||||||||||||||||||||||||||||||||||||||||||||||||||||||||||||||||||||||||||||||||||||||||||||||||||||||||||||||||||||||||||||||||||||||||||||||||||||||||||||||||||||||||||||||||
| 2019 STATISTICAL LEADERS |
|---|
2019 GAME BY GAME STATS |
|---|
 |
2019 SCHEDULE |
2018 RESULTS |
|||||||||||||||||||||||||||||||||||||||||||||||||||||||||||||||||||||||||||||||||||||||||||||||||||||||||||||||||||||||||||||||||||||||||||||||||||||||||||||||||||||||||||||||||||||||||||||||||||||||||||||||||||||
|
|
|||||||||||||||||||||||||||||||||||||||||||||||||||||||||||||||||||||||||||||||||||||||||||||||||||||||||||||||||||||||||||||||||||||||||||||||||||||||||||||||||||||||||||||||||||||||||||||||||||||||||||||||||||||
| 2018 STATISTICAL LEADERS |
|---|
2018 GAME BY GAME STATS |
|---|
 |
2018 SCHEDULE |
2017 RESULTS |
||||||||||||||||||||||||||||||||||||||||||||||||||||||||||||||||||||||||||||||||||||||||||||||||||||||||||||||||||||||||||||||||||||||||||||||||||||||||||||||||||||||||||||||||||||||||||||||||||||||||||||||||||||||||||||||||
|
|
||||||||||||||||||||||||||||||||||||||||||||||||||||||||||||||||||||||||||||||||||||||||||||||||||||||||||||||||||||||||||||||||||||||||||||||||||||||||||||||||||||||||||||||||||||||||||||||||||||||||||||||||||||||||||||||||
| 2017 STATISTICAL LEADERS |
|---|
2017 GAME BY GAME STATS |
|---|
 |
2017 SCHEDULE |
2016 RESULTS |
|||||||||||||||||||||||||||||||||||||||||||||||||||||||||||||||||||||||||||||||||||||||||||||||||||||||||||||||||||||||||||||||||||||||||||||||||||||||||||||||||||||||||||||||||||||||||||||||||||||||||||||||||||||||||||||||||||||||||||||||||||||
|
|
|||||||||||||||||||||||||||||||||||||||||||||||||||||||||||||||||||||||||||||||||||||||||||||||||||||||||||||||||||||||||||||||||||||||||||||||||||||||||||||||||||||||||||||||||||||||||||||||||||||||||||||||||||||||||||||||||||||||||||||||||||||
| 2016 STATISTICAL LEADERS |
|---|
2016 GAME BY GAME STATS |
|---|
 |
| 2015 STATISTICAL LEADERS |
|---|
2015 GAME BY GAME STATS |
|---|
 |
2015 SCHEDULE |
2014 RESULTS |
||||||||||||||||||||||||||||||||||||||||||||||||||||||||||||||||||||||||||||||||||||||||||||||||||||||||||||||||||||||||||||||||||||||||||||||||||||||||||||||||||||||||||||||||||||||||||||||||||||||||||||||||||||||||||||||||||||||||||||||||||||||||||||
|
|
||||||||||||||||||||||||||||||||||||||||||||||||||||||||||||||||||||||||||||||||||||||||||||||||||||||||||||||||||||||||||||||||||||||||||||||||||||||||||||||||||||||||||||||||||||||||||||||||||||||||||||||||||||||||||||||||||||||||||||||||||||||||||||
| 2014 STATISTICAL LEADERS |
|---|
2014 GAME BY GAME STATS |
|---|
 |
| 2013 STATISTICAL LEADERS |
|---|
| Player | Att | Yds | YPC | TD | Player | Comp | Att | % | Yds | YPA | TD | INT | Rating | Player | Rec | Yds | YPC | TD |
| Dominique Brown | 163 | 825 | 5.1 | 8 | Teddy Bridgewater | 303 | 427 | 71.0% | 3970 | 9.3 | 31 | 4 | 171.1 | DeVante Parker | 55 | 885 | 16.1 | 12 |
| Senorise Perry | 141 | 677 | 4.8 | 6 | Will Gardner | 8 | 12 | 66.7% | 112 | 9.3 | 2 | 0 | 200.1 | Damian Copeland | 58 | 780 | 13.4 | 5 |
| Michael Dyer | 44 | 223 | 5.1 | 2 | Eli Rogers | 44 | 536 | 12.2 | 4 |
2013 GAME BY GAME STATS |
|---|
 |
2013 RESULTS |
2012 RESULTS |
||||||||||||||||||||||||||||||||||||||||||||||||||||||||||||||||||||||||||||||||||||||||||||||||||||||||||||||||||||||||||||||||||||||||||||||||||||||||||||||||||||||||||||||||||||||||||||||||||||||||||||||||||||||||||||||||||||||||||||||||||||||||||||||||||||||||||||||||||||||||||||||
|
|
||||||||||||||||||||||||||||||||||||||||||||||||||||||||||||||||||||||||||||||||||||||||||||||||||||||||||||||||||||||||||||||||||||||||||||||||||||||||||||||||||||||||||||||||||||||||||||||||||||||||||||||||||||||||||||||||||||||||||||||||||||||||||||||||||||||||||||||||||||||||||||||
| 2012 STATISTICAL LEADERS |
|---|
| Player | Att | Yds | YPC | TD | Player | Comp | Att | % | Yds | YPA | TD | INT | Rating | Player | Rec | Yds | YPC | TD | ||
| Jeremy Wright | 207 | 795 | 3.8 | 10 | Teddy Bridgewater | 287 | 420 | 68.3% | 3719 | 8.9 | 27 | 8 | 160.1 | DeVante Parker | 40 | 743 | 18.6 | 10 | ||
| Senorise Perry | 135 | 697 | 5.2 | 11 | Will Stein | 20 | 34 | 58.8% | 131 | 3.9 | 0 | 0 | 91.2 | Damian Copeland | 50 | 628 | 12.6 | 2 | ||
| Corvin Lamb | 13 | 50 | 3.8 | 1 | Team | 0 | 2 | 0.0% | 0 | 0.0 | 0 | 0 | 0.0 | Andrell Smith | 34 | 536 | 15.8 | 3 |
| 2012 Individual Player Stats • 2012 Start Chart/ Starters Lost |
|---|
2012 GAME BY GAME STATS |
|---|
 |
| 2011 STATISTICAL LEADERS |
|---|
| Player | Att | Yds | YPC | TD | Player | Comp | Att | % | Yds | YPA | TD | INT | Rating | Player | Rec | Yds | YPC | TD | ||
| Vic Anderson | 114 | 539 | 4.7 | 3 | Teddy Bridgewater | 191 | 296 | 64.5% | 2129 | 7.2 | 14 | 12 | 132.4 | Eli Rogers | 41 | 454 | 11.1 | 1 | ||
| Dominique Brown | 140 | 533 | 3.8 | 4 | Will Stein | 52 | 84 | 61.9% | 620 | 7.4 | 5 | 1 | 141.2 | Michaelee Harris | 35 | 438 | 12.5 | 2 | ||
| Jeremy Wright | 73 | 334 | 4.6 | 1 | Dominique Brown | 0 | 1 | 0.0% | 0 | 0.0 | 0 | 0 | 0.0 | Josh Chichester | 28 | 393 | 14.0 | 2 |
| 2011 INDIVIDUAL PLAYER STATS • 2011 START CHART/STARTERS LOST |
|---|
2011 GAME BY GAME STATS |
|---|
2011 RESULTS |
2010 RESULTS |
|||||||||||||||||||||||||||||||||||||||||||||||||||||||||||||||||||||||||||||||||||||||||||||||||||||||||||||||||||||||||||||||||||||||||||||||||||||||||||||||||||||||||||||||||||||||||||||||||||
|
|
|||||||||||||||||||||||||||||||||||||||||||||||||||||||||||||||||||||||||||||||||||||||||||||||||||||||||||||||||||||||||||||||||||||||||||||||||||||||||||||||||||||||||||||||||||||||||||||||||||
| 2010 STATISTICAL LEADERS |
|---|
| Player | Att | Yds | YPC | TD | Player | Comp | Att | % | Yds | YPA | TD | INT | Rating | Player | Rec | Yds | YPC | TD | ||
| Bilal Powell | 229 | 1405 | 6.14 | 11 | Adam Froman | 132 | 218 | 60.6% | 1633 | 7.5 | 11 | 4 | 136.5 | Cameron Graham | 40 | 470 | 11.8 | 5 | ||
| Jeremy Wright | 59 | 327 | 5.54 | 4 | Justin Burke | 75 | 129 | 58.1% | 790 | 6.1 | 10 | 3 | 130.5 | Doug Beaumont | 41 | 440 | 10.7 | 1 | ||
| Victor Anderson | 64 | 286 | 4.47 | 0 | Will Stein | 9 | 14 | 64.3% | 72 | 5.1 | 1 | 0 | 131.1 | Josh Bellamy | 29 | 401 | 13.8 | 5 |
| 2010 Individual Player Stats |
|---|
2010 GAME BY GAME STATS |
|---|
| 2009 STATISTICAL LEADERS |
|---|
| Player | Att | Yds | YPC | TD | Player | Comp | Att | % | Yds | YPA | TD | INT | Rating | Player | Rec | Yds | YPC | TD | ||
| Vic Anderson | 89 | 473 | 5.31 | 5 | Adam Froman | 111 | 185 | 60.0% | 1354 | 7.3 | 6 | 5 | 126.8 | Scott Long | 53 | 727 | 13.7 | 2 | ||
| Darius Ashley | 106 | 462 | 4.36 | 4 | Justin Burke | 49 | 97 | 50.5% | 654 | 6.7 | 3 | 5 | 107.0 | Doug Beaumont | 38 | 465 | 12.2 | 0 | ||
| Bilal Powell | 108 | 392 | 3.63 | 4 | Will Stein | 43 | 78 | 55.1% | 450 | 5.8 | 0 | 1 | 101.0 | Trent Guy | 18 | 329 | 18.3 | 2 |
| 2009 Individual Player Stats |
|---|
2009 GAME BY GAME STATS |
|---|
2009 RESULTS |
2008 RESULTS |
||||||||||||||||||||||||||||||||||||||||||||||||||||||||||||||||||||||||||||||||||||||||||||||||||||||||||||||||||||||||||||||||||||||||||||
|
|
||||||||||||||||||||||||||||||||||||||||||||||||||||||||||||||||||||||||||||||||||||||||||||||||||||||||||||||||||||||||||||||||||||||||||||
| 2008 Individual Player Stats • 2007 Individual Player Stats |
|---|