
WAKE FOREST DEMON DEACONS |
|
STADIUM: Truist Field STARTERS RETURNING (O/D): 5/6 |
| LOCATION: Winston-Salem, NC |  |
| FOUNDED: 1834 | |
| ENROLLMENT: 5,441 | |
| COLORS: Old Gold & Black | |
| MASCOT: The Deacon | |
| CONFERENCE: ACC | |
| HEAD COACH: Jake Dickert | |
| Years with Team: 1st | |
| OVERALL FBS REC: 23-20 | |
| RECORD WITH TEAM: 0-0 |
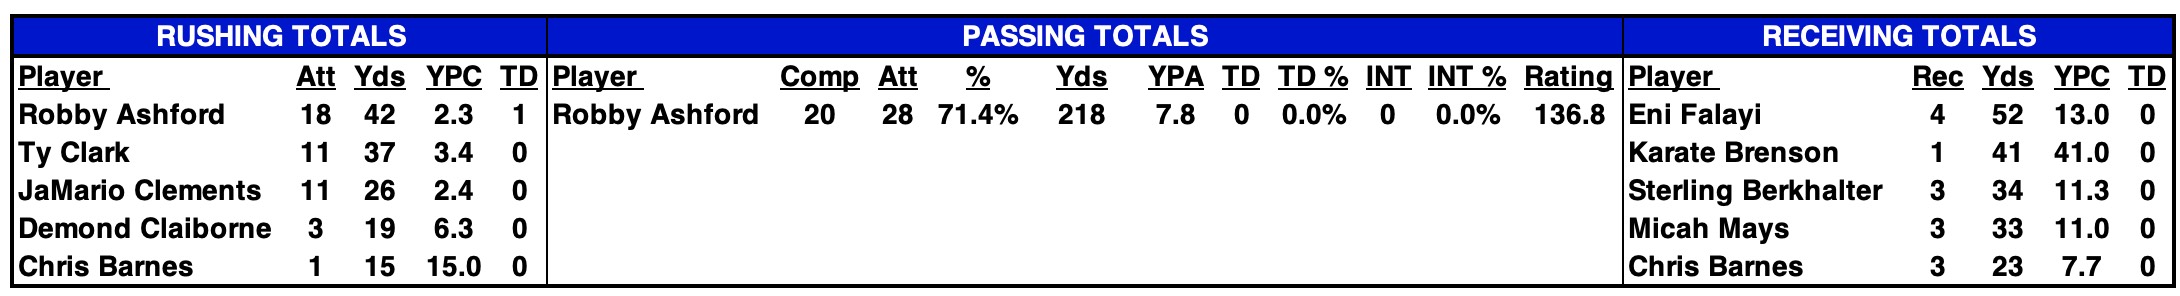
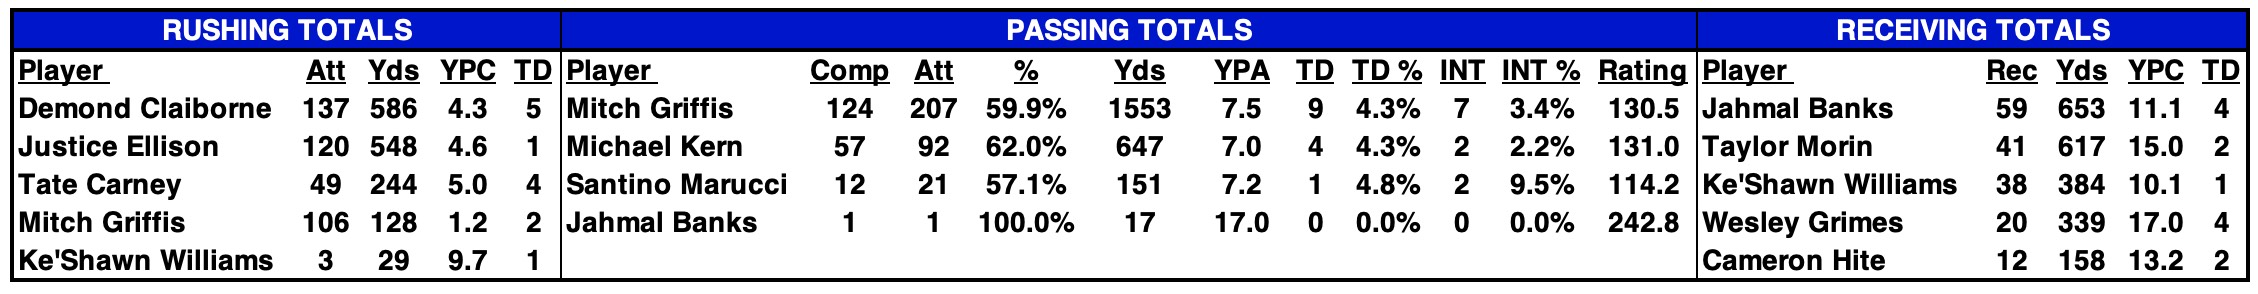
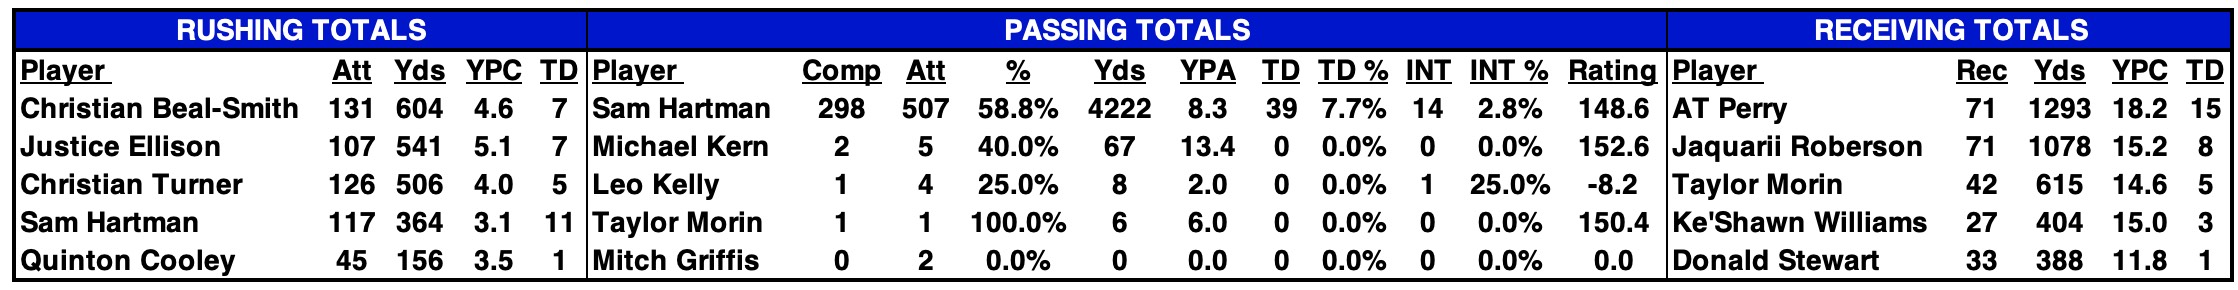
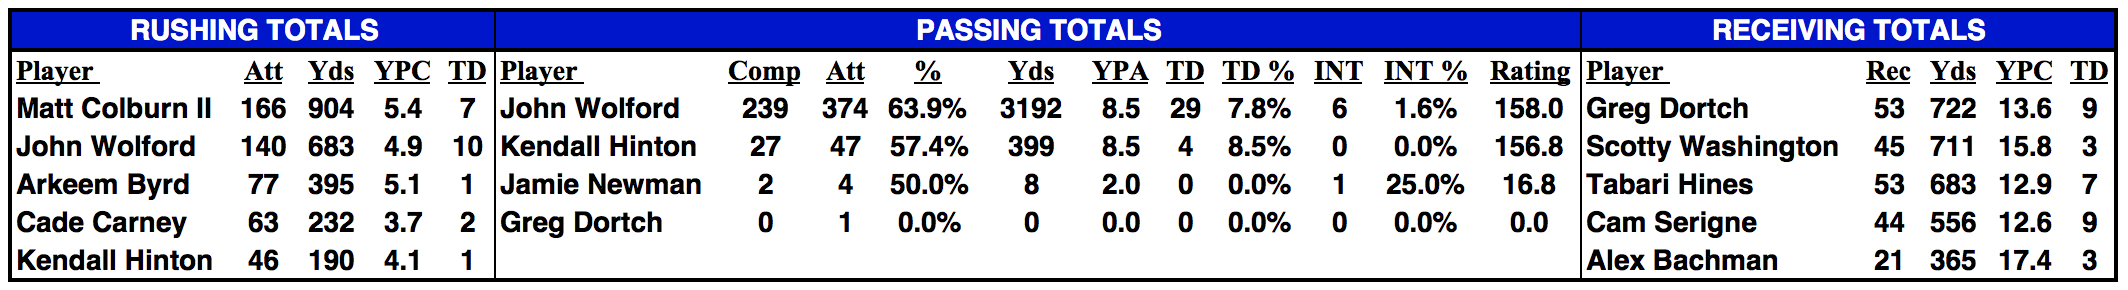
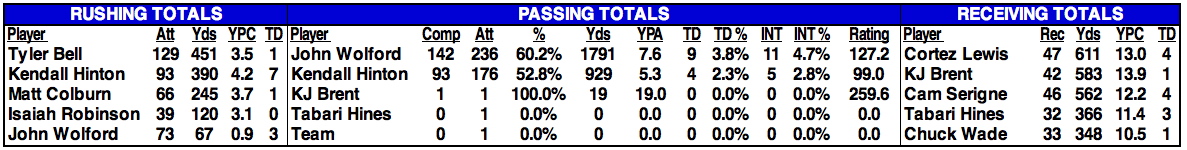
2025 STATISTICAL LEADERS |
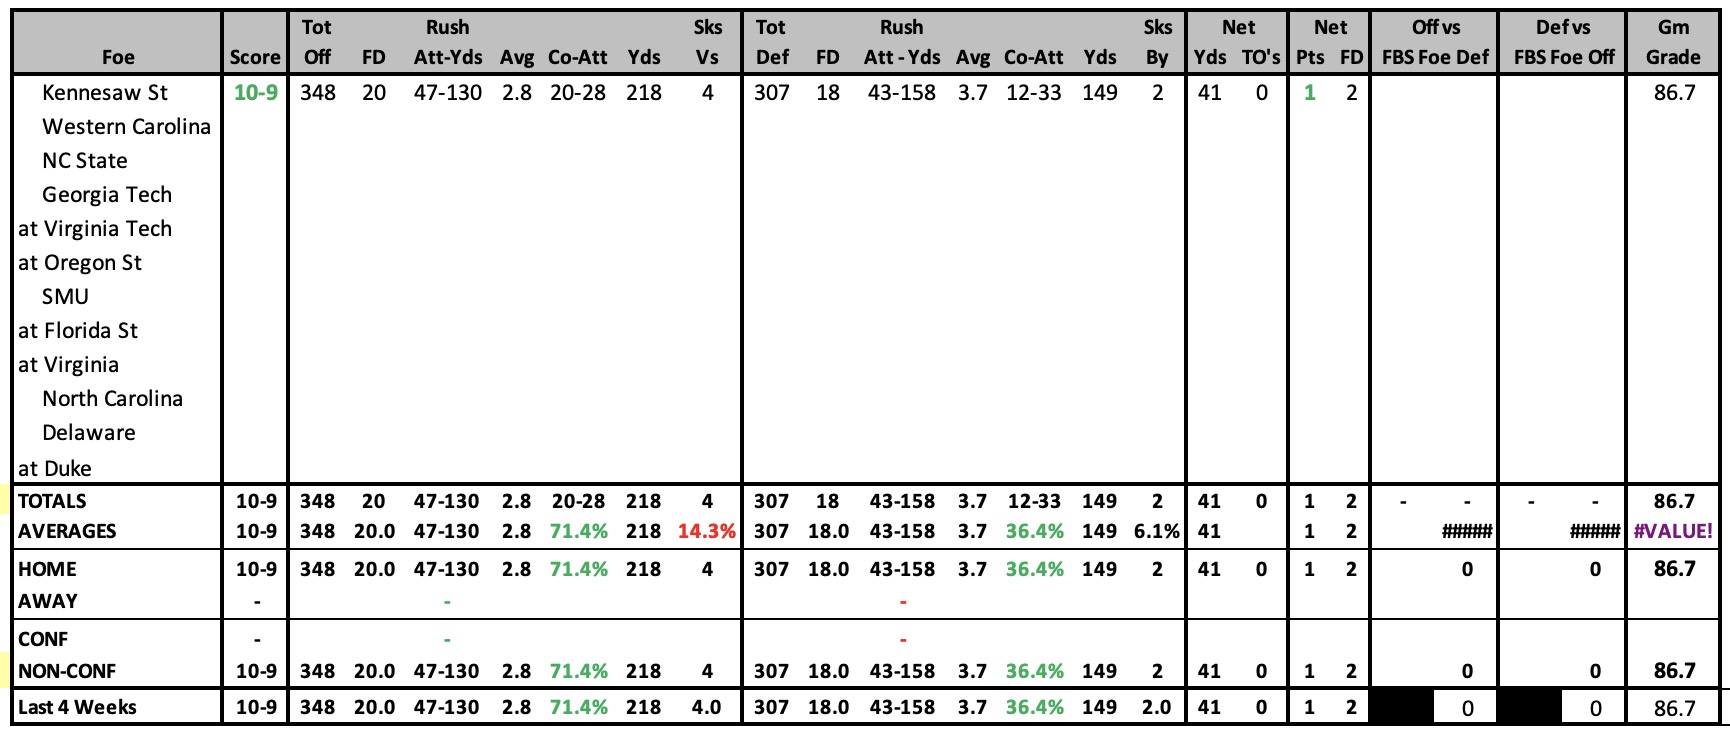
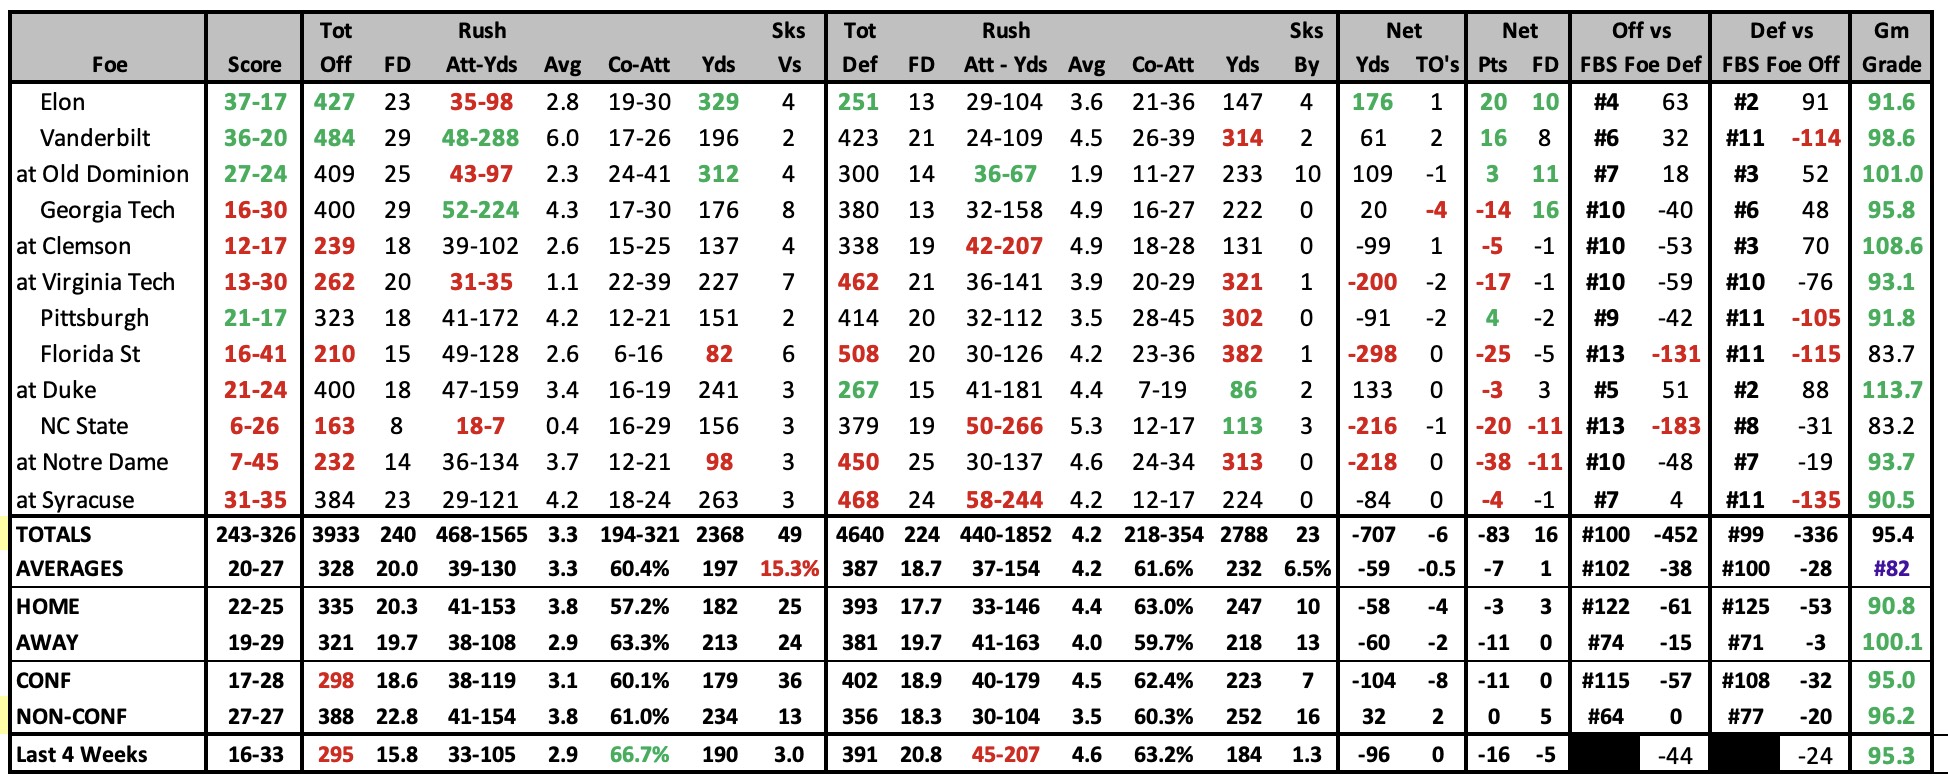
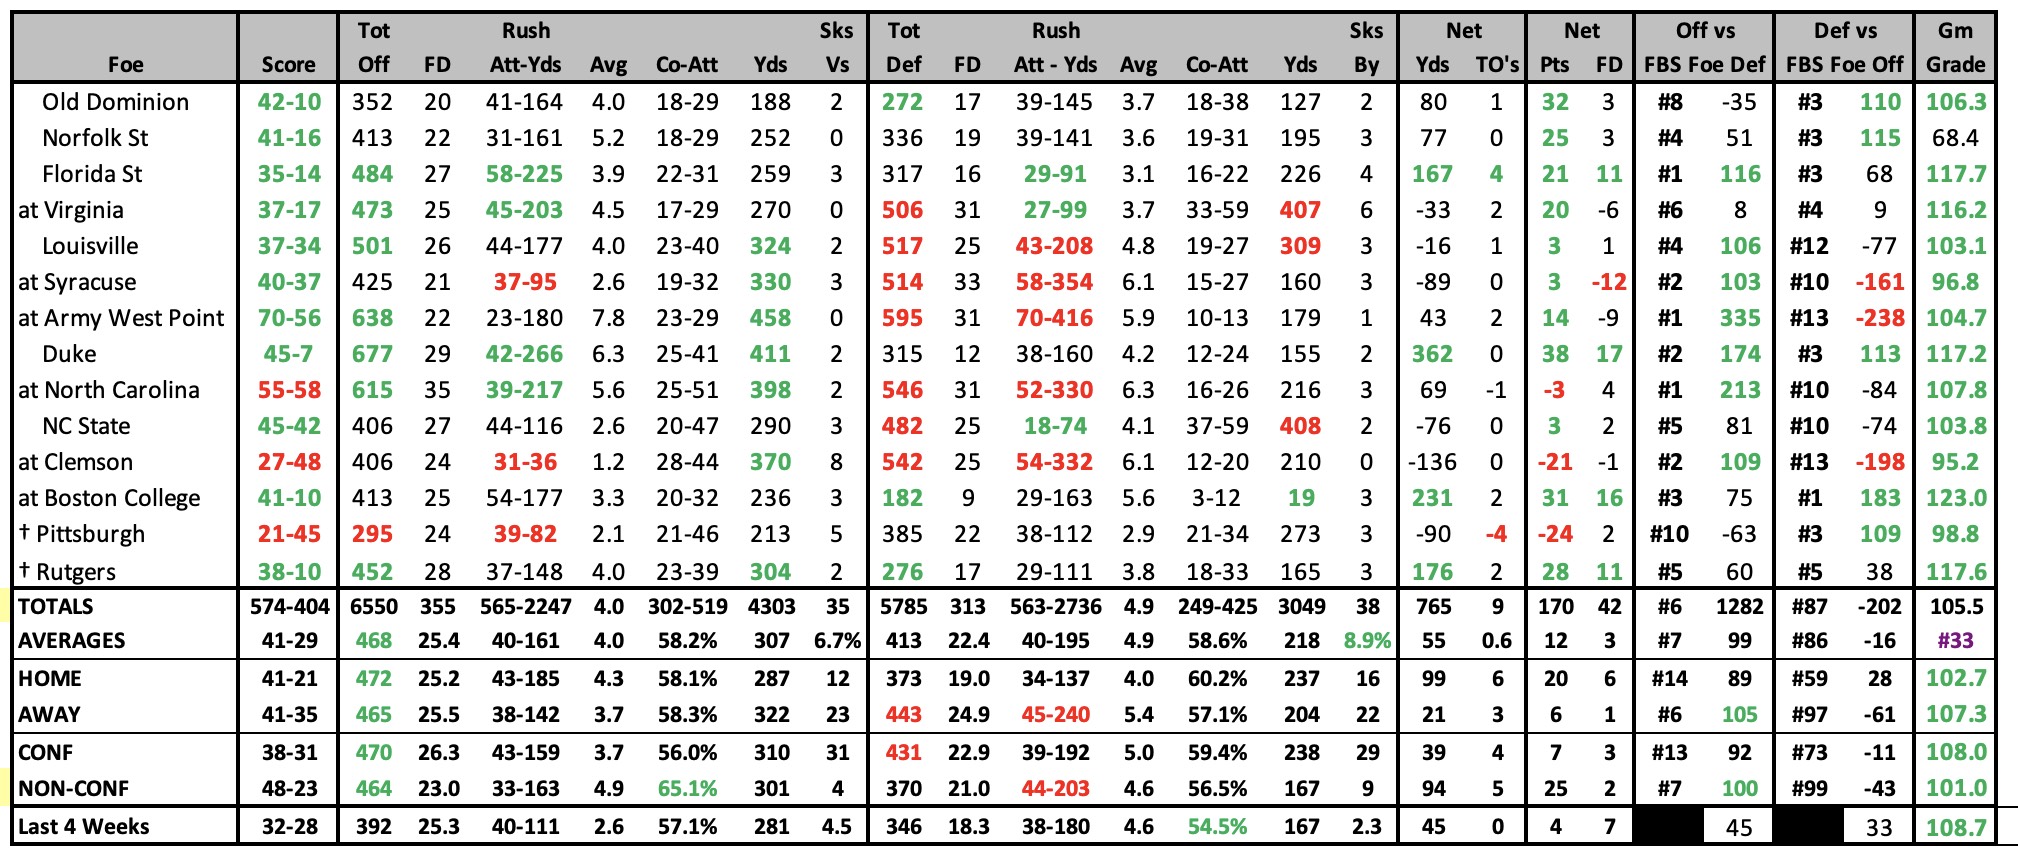
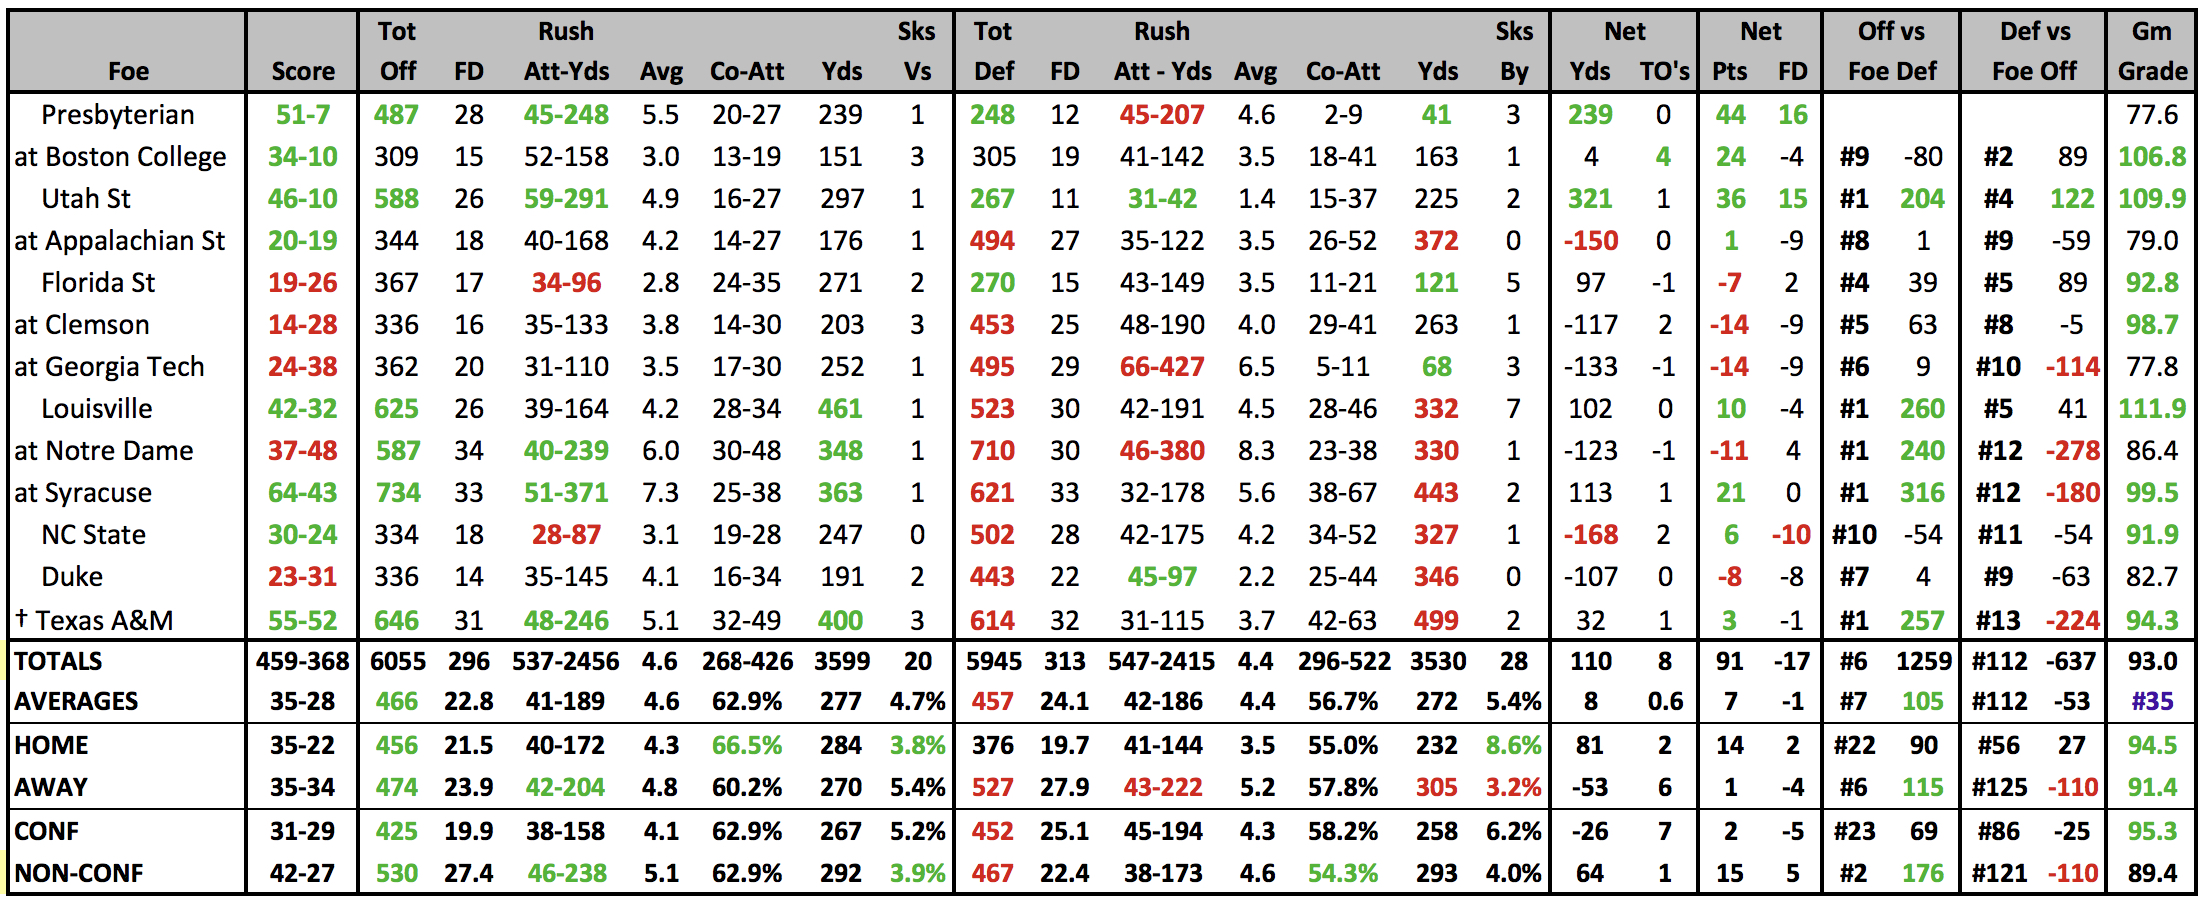
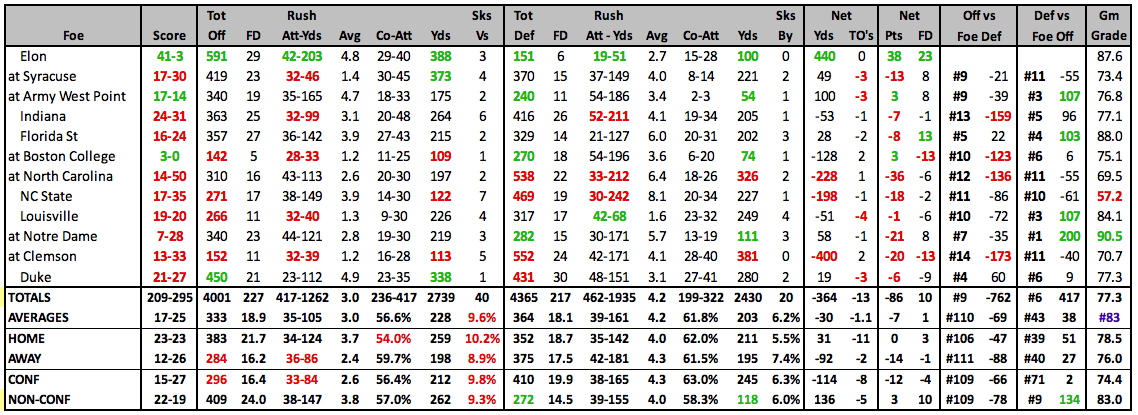
2025 GAME BY GAME STATS |
 |
2025 SCHEDULE |
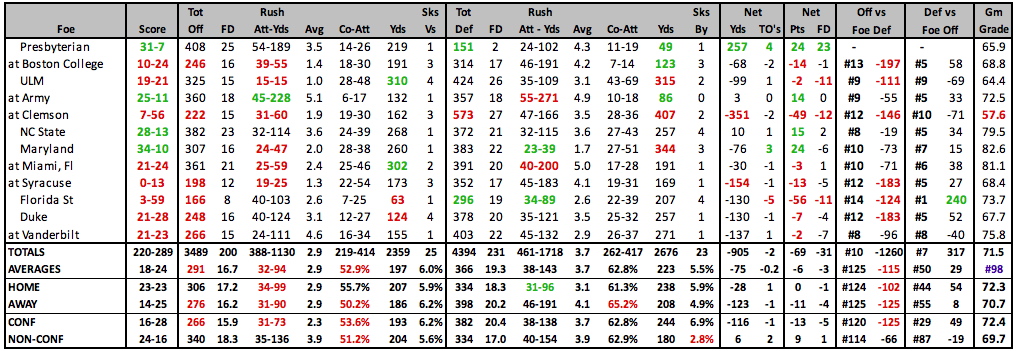
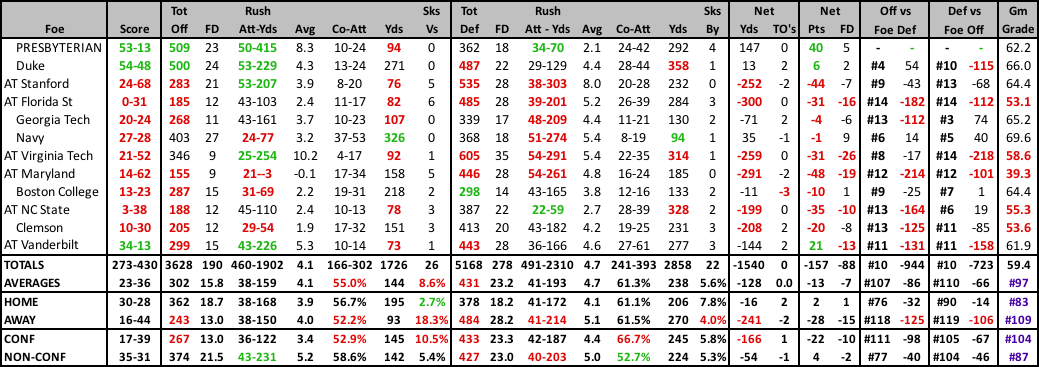
2024 RESULTS |
||||||||||||||||||||||||||||||||||||||||||||||||||||||||||||||||||||||||||||||||||||||||||||||||||||||||||||||||||||||||||||||||||||||||||||||||||||||||||||||||||||||||||||||||||||||||||||||||||||||
|
|
||||||||||||||||||||||||||||||||||||||||||||||||||||||||||||||||||||||||||||||||||||||||||||||||||||||||||||||||||||||||||||||||||||||||||||||||||||||||||||||||||||||||||||||||||||||||||||||||||||||
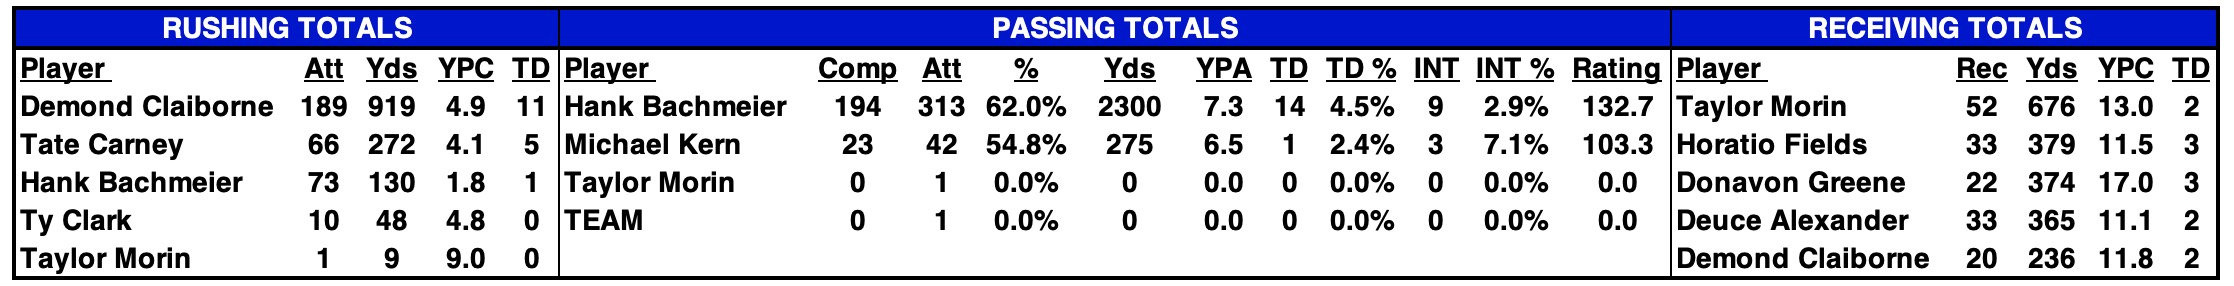
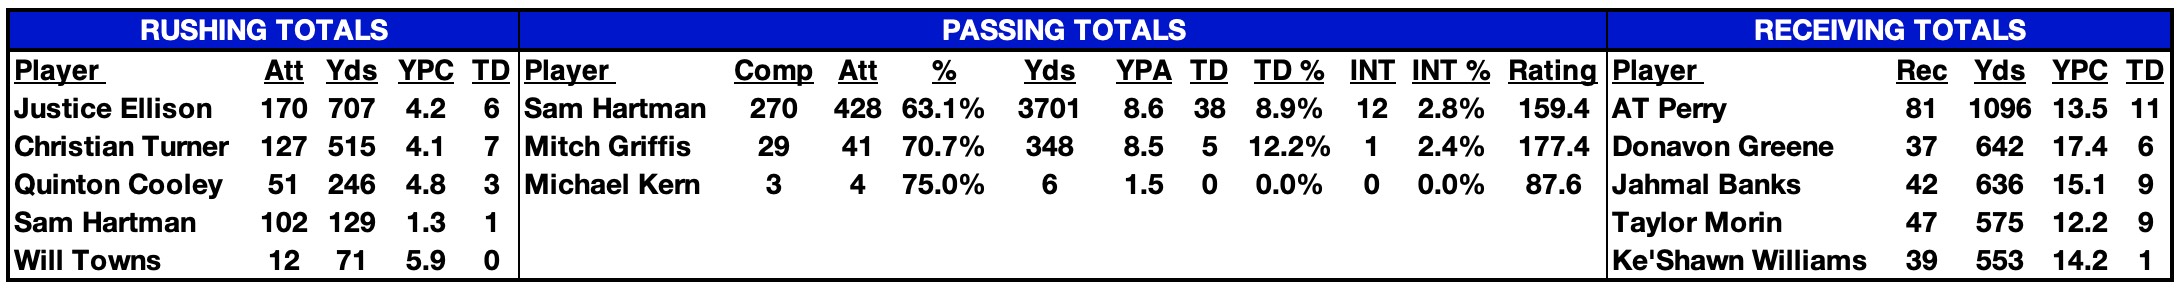
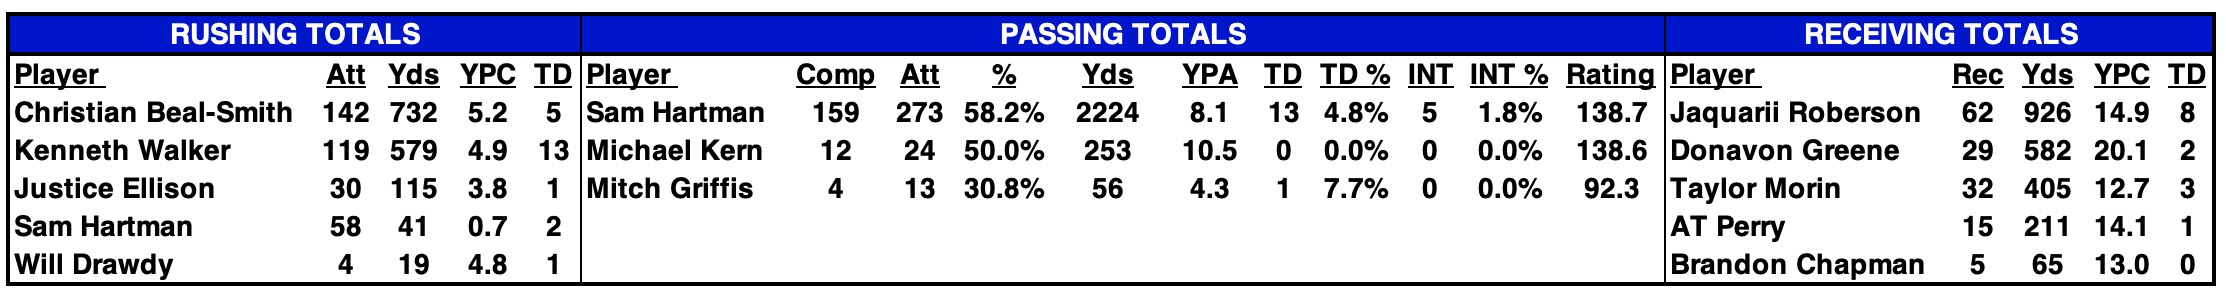
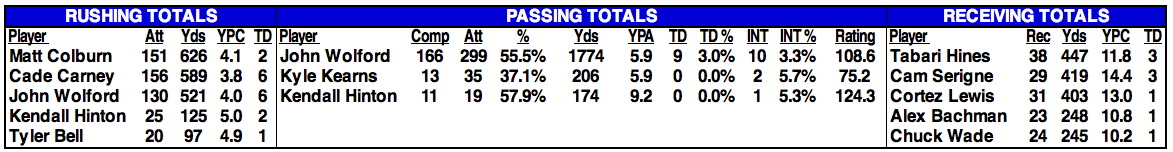
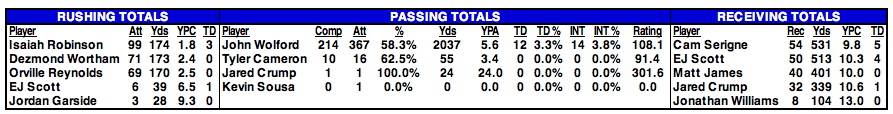
2024 STATISTICAL LEADERS |
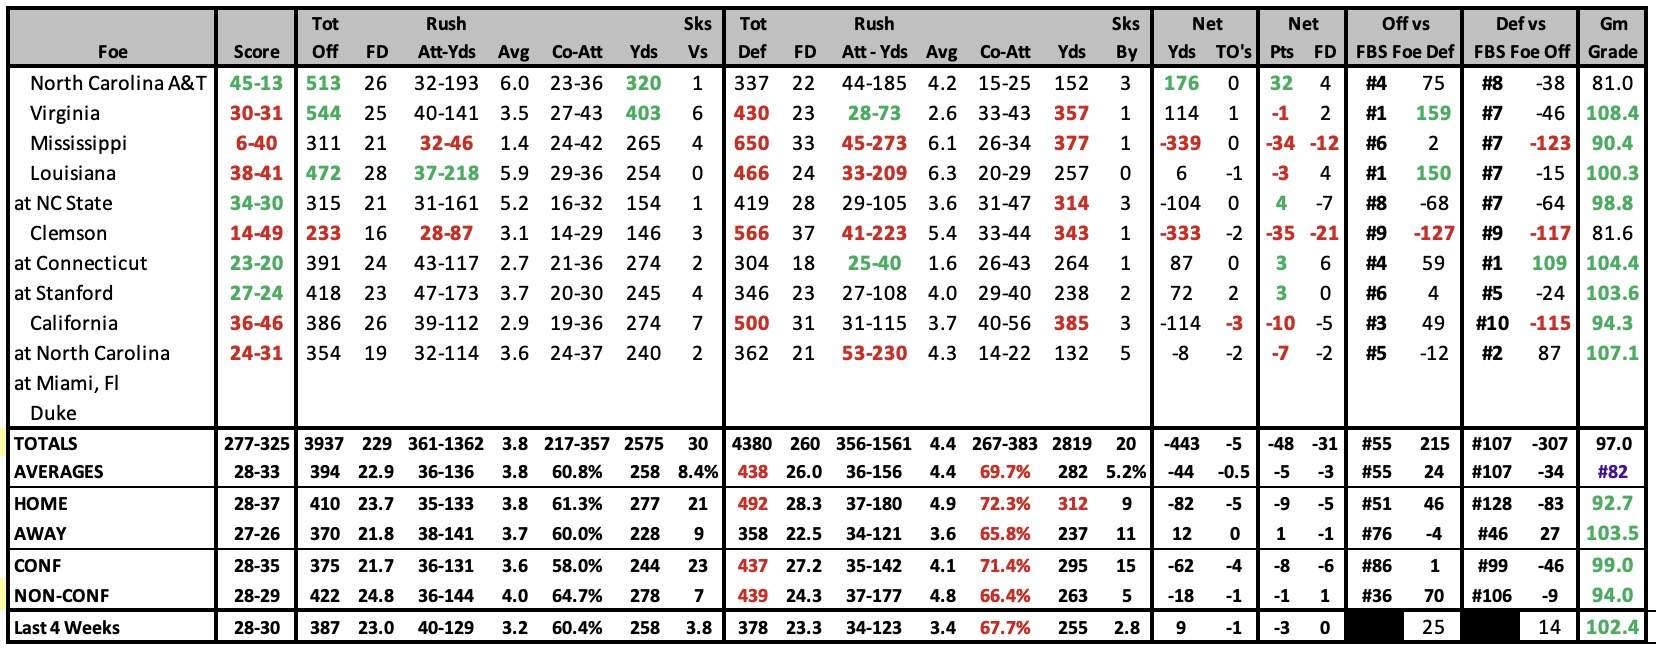
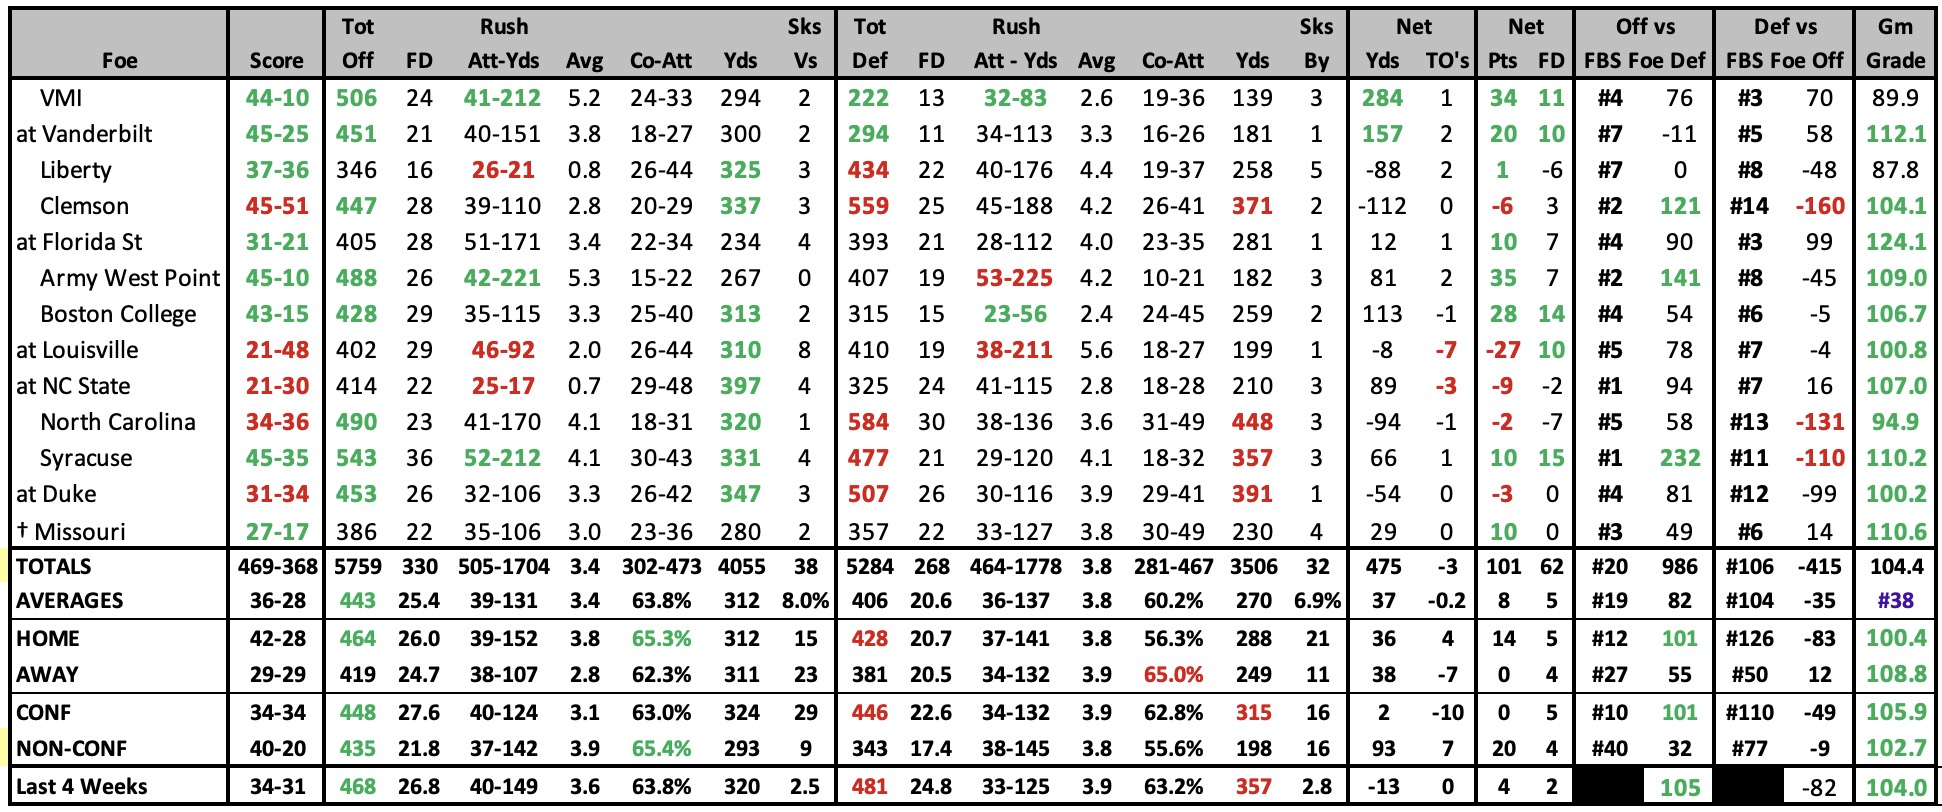
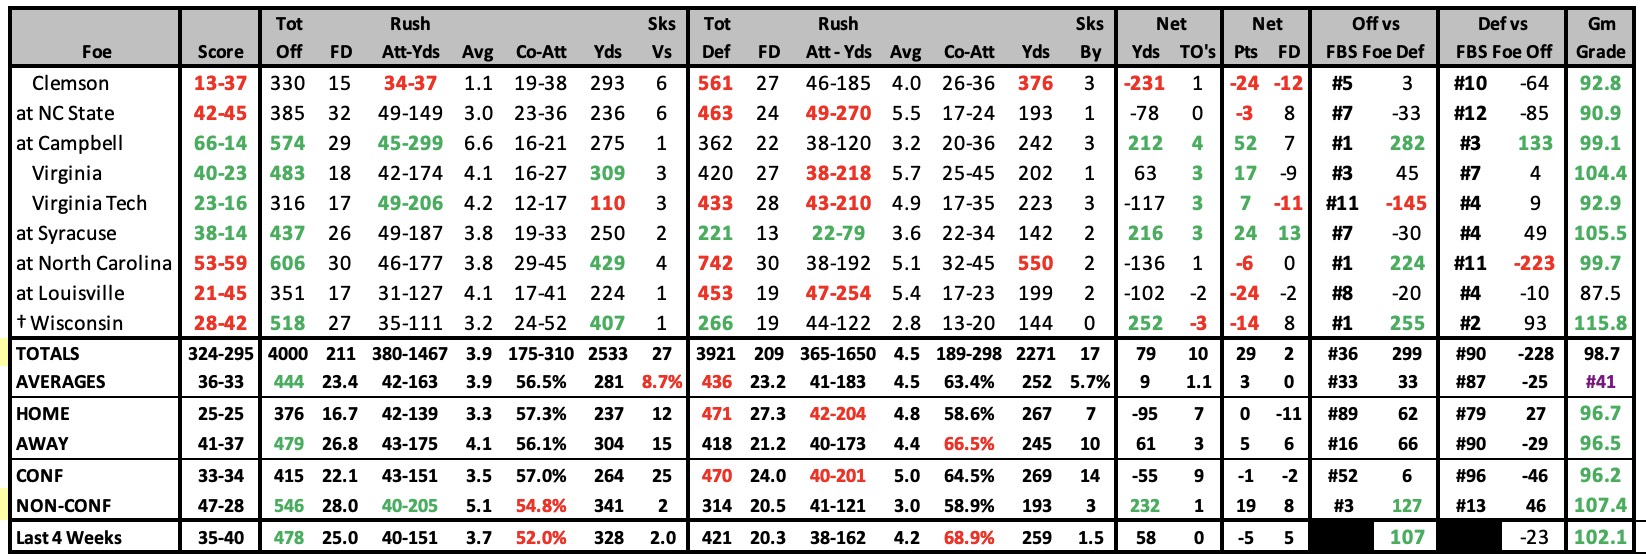
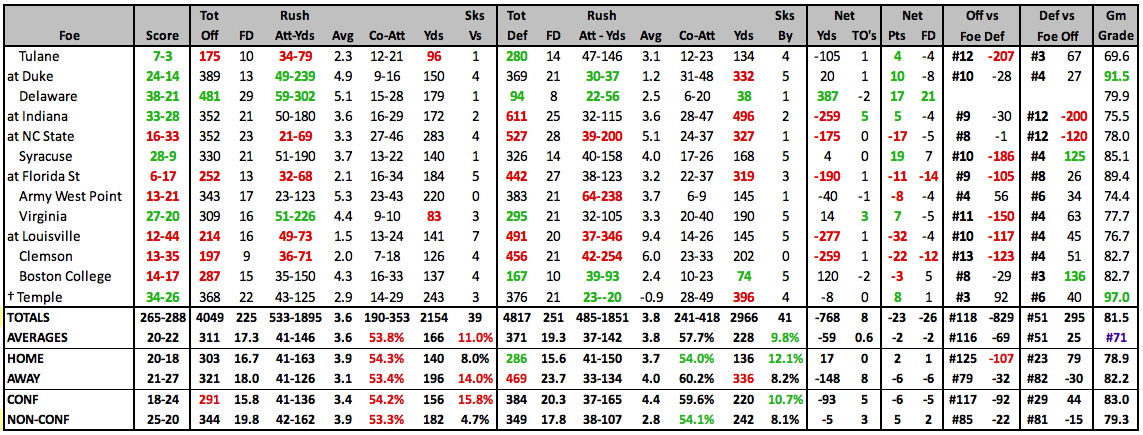
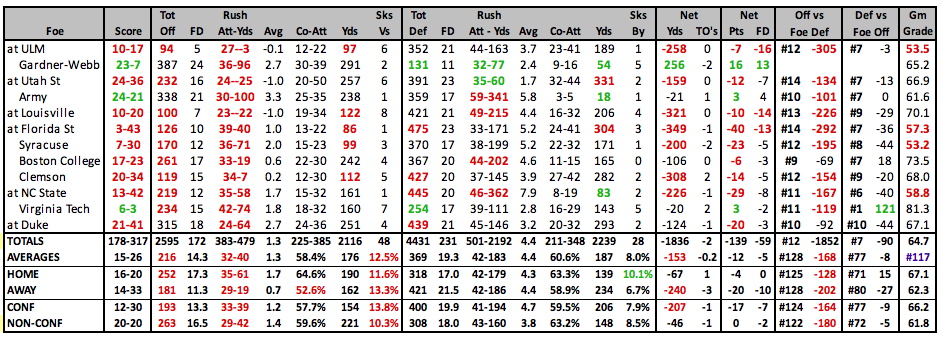
2024 GAME BY GAME STATS |
 |
2024 SCHEDULE |
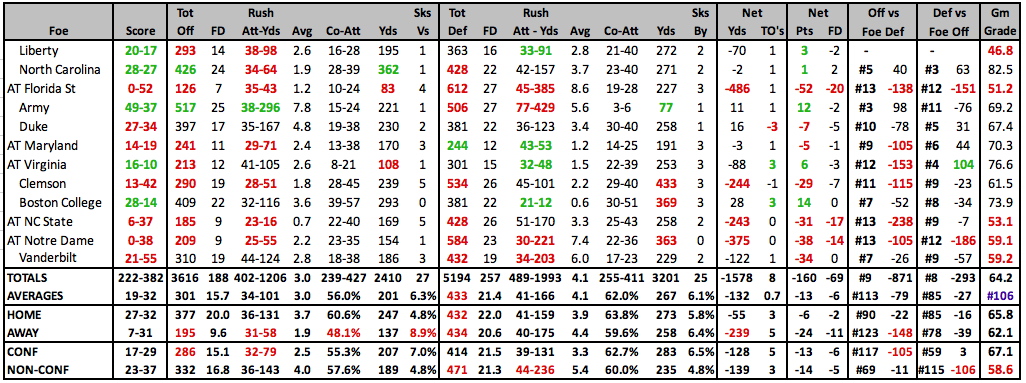
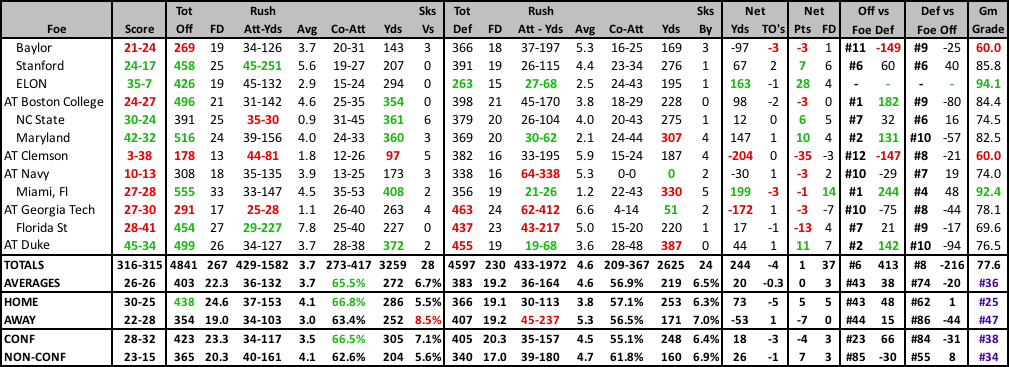
2023 RESULTS |
||||||||||||||||||||||||||||||||||||||||||||||||||||||||||||||||||||||||||||||||||||||||||||||||||||||||||||||||||||||||||||||||||||||||||||||||||||||||||||||||||||||||||||||||||||||||||||||||
|
|
2023 STATISTICAL LEADERS |
2023 GAME BY GAME STATS |
 |
2023 SCHEDULE |
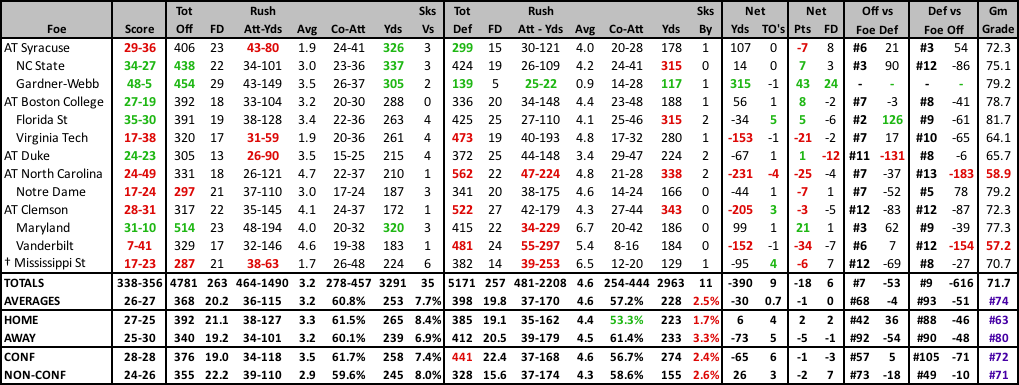
2022 RESULTS |
||||||||||||||||||||||||||||||||||||||||||||||||||||||||||||||||||||||||||||||||||||||||||||||||||||||||||||||||||||||||||||||||||||||||||||||||||||||||||||||||||||||||||||||||||||||||||||||||||||||
|
|
||||||||||||||||||||||||||||||||||||||||||||||||||||||||||||||||||||||||||||||||||||||||||||||||||||||||||||||||||||||||||||||||||||||||||||||||||||||||||||||||||||||||||||||||||||||||||||||||||||||
2022 STATISTICAL LEADERS |
2022 GAME BY GAME STATS |
 |
2022 SCHEDULE |
2021 RESULTS |
||||||||||||||||||||||||||||||||||||||||||||||||||||||||||||||||||||||||||||||||||||||||||||||||||||||||||||||||||||||||||||||||||||||||||||||||||||||||||||||||||||||||||||||||||||||||||||||||||||||||||||||||||
|
|
||||||||||||||||||||||||||||||||||||||||||||||||||||||||||||||||||||||||||||||||||||||||||||||||||||||||||||||||||||||||||||||||||||||||||||||||||||||||||||||||||||||||||||||||||||||||||||||||||||||||||||||||||
2021 STATISTICAL LEADERS |
2021 GAME BY GAME STATS |
 |
2021 SCHEDULE |
2020 RESULTS |
||||||||||||||||||||||||||||||||||||||||||||||||||||||||||||||||||||||||||||||||||||||||||||||||||||||||||||||||||||||||||||||||||||||||||||||||||||||||||||||||||||||||||||||||||||||||||||||||||||||||||||||||||
|
|
||||||||||||||||||||||||||||||||||||||||||||||||||||||||||||||||||||||||||||||||||||||||||||||||||||||||||||||||||||||||||||||||||||||||||||||||||||||||||||||||||||||||||||||||||||||||||||||||||||||||||||||||||
2020 STATISTICAL LEADERS |
2020 GAME BY GAME STATS |
 |
2020 SCHEDULE |
2019 RESULTS |
||||||||||||||||||||||||||||||||||||||||||||||||||||||||||||||||||||||||||||||||||||||||||||||||||||||||||||||||||||||||||||||||||||||||||||||||||||||||||||||||||||||||||||||||||||||||||||||||||||||||||||||||||||||||
|
|
||||||||||||||||||||||||||||||||||||||||||||||||||||||||||||||||||||||||||||||||||||||||||||||||||||||||||||||||||||||||||||||||||||||||||||||||||||||||||||||||||||||||||||||||||||||||||||||||||||||||||||||||||||||||
2019 STATISTICAL LEADERS |
2019 GAME BY GAME STATS |
 |
2019 SCHEDULE |
2018 RESULTS |
||||||||||||||||||||||||||||||||||||||||||||||||||||||||||||||||||||||||||||||||||||||||||||||||||||||||||||||||||||||||||||||||||||||||||||||||||||||||||||||||||||||||||||||||||||||||||||||||||||||||||||||||||||||||||||||||||
|
|
||||||||||||||||||||||||||||||||||||||||||||||||||||||||||||||||||||||||||||||||||||||||||||||||||||||||||||||||||||||||||||||||||||||||||||||||||||||||||||||||||||||||||||||||||||||||||||||||||||||||||||||||||||||||||||||||||
2018 STATISTICAL LEADERS |
2018 GAME BY GAME STATS |
 |
2018 SCHEDULE |
2017 RESULTS |
|||||||||||||||||||||||||||||||||||||||||||||||||||||||||||||||||||||||||||||||||||||||||||||||||||||||||||||||||||||||||||||||||||||||||||||||||||||||||||||||||||||||||||||||||||||||||||||||||||||||||||||||||||||||||||||||||||||||
|
|
|||||||||||||||||||||||||||||||||||||||||||||||||||||||||||||||||||||||||||||||||||||||||||||||||||||||||||||||||||||||||||||||||||||||||||||||||||||||||||||||||||||||||||||||||||||||||||||||||||||||||||||||||||||||||||||||||||||||
2017 STATISTICAL LEADERS |
2017 GAME BY GAME STATS |
 |
2017 SCHEDULE |
2016 RESULTS |
||||||||||||||||||||||||||||||||||||||||||||||||||||||||||||||||||||||||||||||||||||||||||||||||||||||||||||||||||||||||||||||||||||||||||||||||||||||||||||||||||||||||||||||||||||||||||||||||||||||||||||||||||||||||||||||||||||||||||||||
|
|
||||||||||||||||||||||||||||||||||||||||||||||||||||||||||||||||||||||||||||||||||||||||||||||||||||||||||||||||||||||||||||||||||||||||||||||||||||||||||||||||||||||||||||||||||||||||||||||||||||||||||||||||||||||||||||||||||||||||||||||
2016 STATISTICAL LEADERS |
2016 GAME BY GAME STATS |
 |
2015 STATISTICAL LEADERS |
2015 GAME BY GAME STATS |
 |
2015 SCHEDULE |
2014 RESULTS |
|||||||||||||||||||||||||||||||||||||||||||||||||||||||||||||||||||||||||||||||||||||||||||||||||||||||||||||||||||||||||||||||||||||||||||||||||||||||||||||||||||||||||||||||||||||||||||||||||||||||||||||||||||
|
|
2014 STATISTICAL LEADERS |
2014 GAME BY GAME STATS |
 |
2013 STATISTICAL LEADERS |
| Player | Att | Yds | YPC | TD | Player | Comp | Att | % | Yds | YPA | TD | INT | Rating | Player | Rec | Yds | YPC | TD |
| Josh Harris | 114 | 441 | 3.9 | 4 | Tanner Price | 206 | 378 | 54.5% | 2233 | 5.9 | 13 | 10 | 110.2 | Michael Campanaro | 67 | 803 | 12.0 | 6 |
| Tanner Price | 122 | 255 | 2.1 | 5 | Tyler Cameron | 7 | 24 | 29.2% | 85 | 3.5 | 0 | 3 | 33.9 | Spencer Bishop | 19 | 257 | 13.5 | 2 |
| Dominique Gibson | 53 | 138 | 2.6 | 1 | Michael Campanaro | 2 | 2 | 100.0% | 29 | 14.5 | 1 | 0 | 386.8 | Jonathan Williams | 17 | 221 | 13.0 | 0 |
2013 GAME BY GAME STATS |
 |
2013 RESULTS |
2012 RESULTS |
|||||||||||||||||||||||||||||||||||||||||||||||||||||||||||||||||||||||||||||||||||||||||||||||||||||||||||||||||||||||||||||||||||||||||||||||||||||||||||||||||||||||||||||||||||||||||||||||||||||||||||||||||||||||||||||||||||||||||||||||||||||||
|
|
|||||||||||||||||||||||||||||||||||||||||||||||||||||||||||||||||||||||||||||||||||||||||||||||||||||||||||||||||||||||||||||||||||||||||||||||||||||||||||||||||||||||||||||||||||||||||||||||||||||||||||||||||||||||||||||||||||||||||||||||||||||||
2012 STATISTICAL LEADERS |
| Player | Att | Yds | YPC | TD | Player | Comp | Att | % | Yds | YPA | TD | INT | Rating | Player | Rec | Yds | YPC | TD | ||
| Josh Harris | 137 | 608 | 4.4 | 5 | Tanner Price | 228 | 410 | 55.6% | 2300 | 5.6 | 12 | 7 | 109.0 | Michael Campanaro | 79 | 763 | 9.7 | 6 | ||
| Deandre Martin | 128 | 484 | 3.8 | 6 | Deandre Martin | 3 | 4 | 75.0% | 48 | 12.0 | 0 | 0 | 175.8 | Terence Davis | 43 | 544 | 12.7 | 2 | ||
| Michael Campanaro | 16 | 82 | 5.1 | 1 | Michael Campanaro | 1 | 1 | 100.0% | 39 | 39.0 | 1 | 0 | 757.6 | Brandon Terry | 15 | 290 | 19.3 | 0 |
| 2012 Individual Player Stats • 2012 Start Chart/Starters Lost |
|---|
2012 GAME BY GAME STATS |
 |
2011 STATISTICAL LEADERS |
| Player | Att | Yds | YPC | TD | Player | Comp | Att | % | Yds | YPA | TD | INT | Rating | Player | Rec | Yds | YPC | TD | ||
| Brandon Pendergrass | 188 | 823 | 4.4 | 9 | Tanner Price | 253 | 422 | 60.0% | 3017 | 7.1 | 20 | 6 | 132.8 | Chris Givens | 83 | 1330 | 16.0 | 9 | ||
| Josh Harris | 101 | 432 | 4.3 | 3 | Ted Stachitas | 18 | 26 | 69.2% | 152 | 5.8 | 0 | 1 | 110.6 | Michael Campanaro | 73 | 833 | 11.4 | 2 | ||
| Orville Reynolds | 28 | 109 | 3.9 | 0 | Michael Campanaro | 3 | 4 | 75.0% | 106 | 26.5 | 2 | 1 | 412.6 | Danny Dembry | 36 | 423 | 11.8 | 1 |
| 2011 Individual Player Stats • 2011 START CHART/STARTERS LOST |
|---|
2011 GAME BY GAME STATS |
2011 RESULTS |
2010 RESULTS |
|
|
|||||||||||||||||||||||||||||||||||||||||||||||||||||||||||||||||||||||||||||||||||||||||||||||||||||||||||||||||||||||||||||||||||||||||||||||||||||||||||||||||||||||||||||||||||||||||||||
|---|---|---|---|---|---|---|---|---|---|---|---|---|---|---|---|---|---|---|---|---|---|---|---|---|---|---|---|---|---|---|---|---|---|---|---|---|---|---|---|---|---|---|---|---|---|---|---|---|---|---|---|---|---|---|---|---|---|---|---|---|---|---|---|---|---|---|---|---|---|---|---|---|---|---|---|---|---|---|---|---|---|---|---|---|---|---|---|---|---|---|---|---|---|---|---|---|---|---|---|---|---|---|---|---|---|---|---|---|---|---|---|---|---|---|---|---|---|---|---|---|---|---|---|---|---|---|---|---|---|---|---|---|---|---|---|---|---|---|---|---|---|---|---|---|---|---|---|---|---|---|---|---|---|---|---|---|---|---|---|---|---|---|---|---|---|---|---|---|---|---|---|---|---|---|---|---|---|---|---|---|---|---|---|---|---|---|---|---|---|---|
2010 STATISTICAL LEADERS |
| Player | Att | Yds | YPC | TD | Player | Comp | Att | % | Yds | YPA | TD | INT | Rating | Player | Rec | Yds | YPC | TD | ||
| Josh Harris | 108 | 582 | 5.39 | 6 | Tanner Price | 127 | 227 | 55.9% | 1276 | 5.6 | 7 | 0 | 106.0 | 0.0 | Chris Givens | 34 | 505 | 14.9 | 4 | |
| Josh Adams | 80 | 274 | 3.43 | 2 | Ted Stachitas | 12 | 23 | 52.2% | 131 | 5.7 | 0 | 0 | 91.0 | 0.0 | Devon Brown | 35 | 265 | 7.6 | 1 | |
| Ted Stachitas | 35 | 171 | 4.89 | 2 | Marshall Williams | 2 | 3 | 66.7% | 122 | 40.7 | 2 | 1 | 628.0 | 0.0 | Marshall Williams | 22 | 260 | 11.8 | 2 |
2010 GAME BY GAME STATS |
2009 STATISTICAL LEADERS |
| Player | Att | Y ds | YPC | TD | Player | Comp | Att | % | Yds | YPA | TD | INT | Rating | Player | Rec | Yds | YPC | TD | ||
| Josh Adams | 113 | 541 | 4.79 | 4 | Riley Skinner | 264 | 400 | 66.0% | 3160 | 7.9 | 26 | 12 | 147.8 | Marshall Williams | 60 | 867 | 14.5 | 6 | ||
| B Pendergrass | 83 | 399 | 4.81 | 1 | Marshall Williams | 3 | 3 | 100.0% | 52 | 17.3 | 0 | 0 | 245.6 | Devon Brown | 61 | 671 | 11.0 | 6 | ||
| Kevin Harris | 36 | 156 | 4.33 | 2 | Ryan McManus | 6 | 14 | 42.9% | 47 | 3.4 | 0 | 0 | 71.1 | Chris Givens | 45 | 629 | 14.0 | 8 |
| 2009 Individual Player Stats |
|---|
2009 GAME BY GAME STATS |
2009 RESULTS |
2008 RESULTS |
|
|
||||||||||||||||||||||||||||||||||||||||||||||||||||||||||||||||||||||||||||||||||||||||||||||||||||||||||||||||||||||||||||||||||||||||
| 2008 Individual Player Stats • 2007 Individual Player Stats |
|---|