
IOWA ST CYCLONES
|
|
STADIUM: Jack Trice PLAYING SURFACE: Grass • CAPACITY: 61,500 STARTERS RETURNING (O/D): 7*/6 LETTERMAN RETURNING: 53 (23,26,4) • LETTERMAN LOST: 26 (9,15,2) |
 |
|
| LOCATION: Ames, IA | |
| FOUNDED: 1858 | |
| ENROLLMENT: 25,808 | |
| COLORS: Cardinal & Gold | |
| MASCOT: Cy & Cardinal | |
| CONFERENCE: Big 12 | |
| HEAD COACH: Matt Campbell |
|
| YEARS WITH TEAM: 10th | |
| OVERALL RECORD: 99-66 | |
| RECORD W/ TEAM: 64-51 |
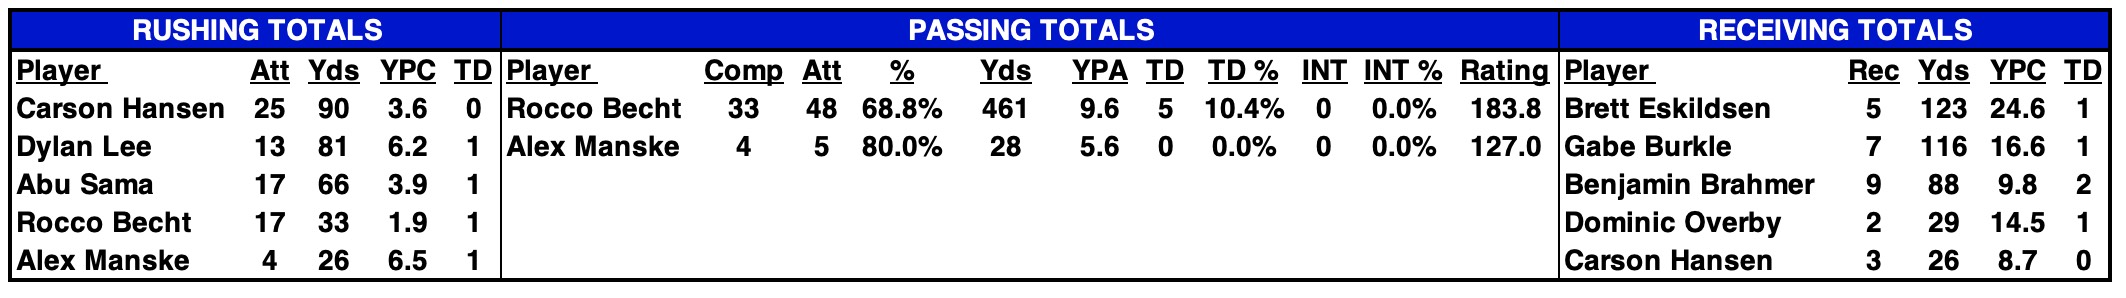
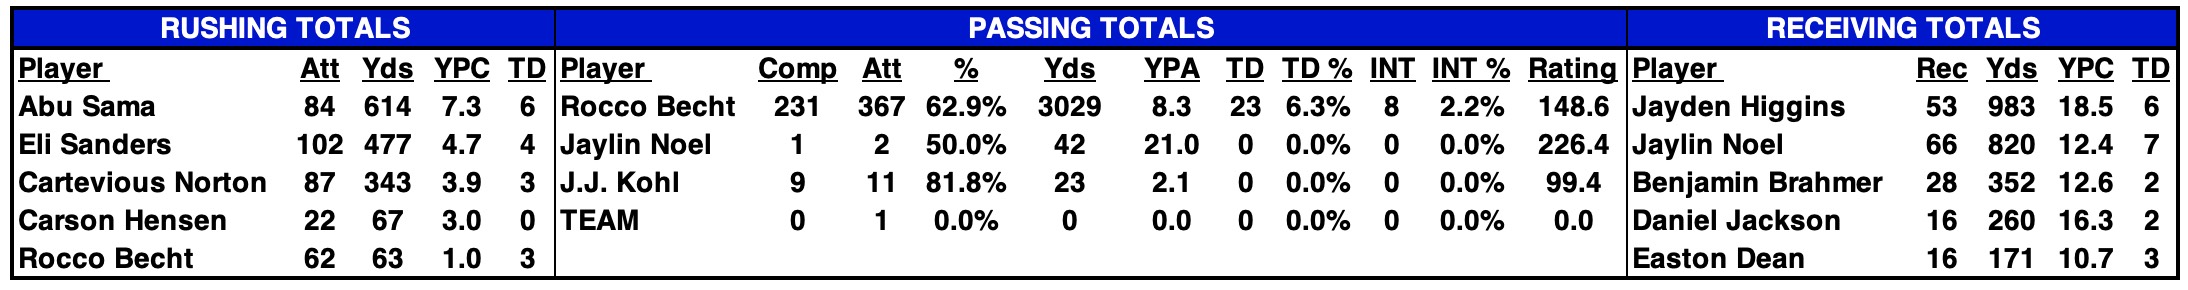
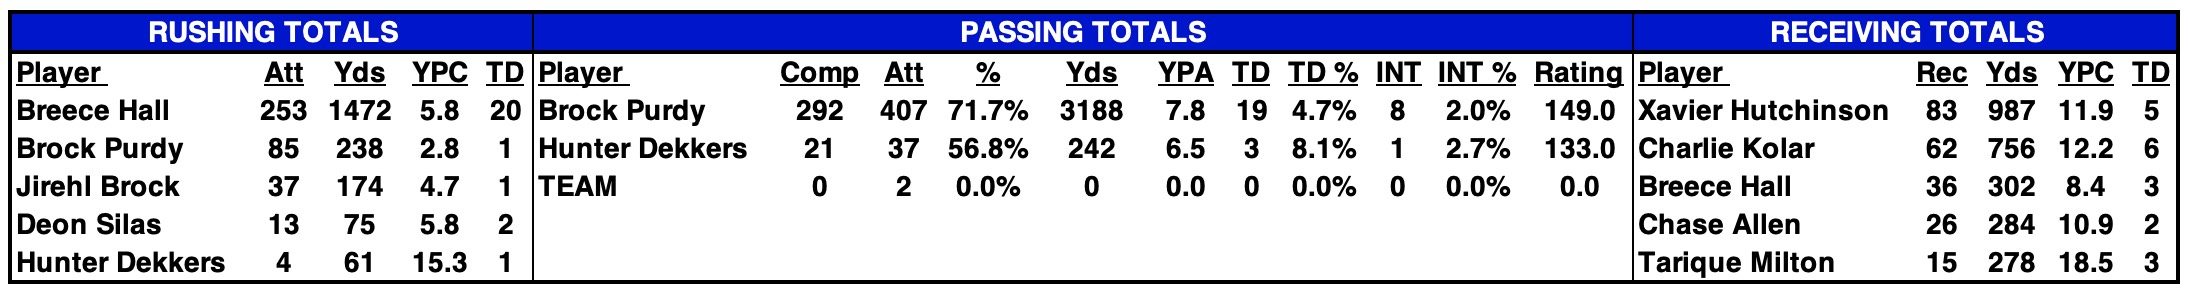
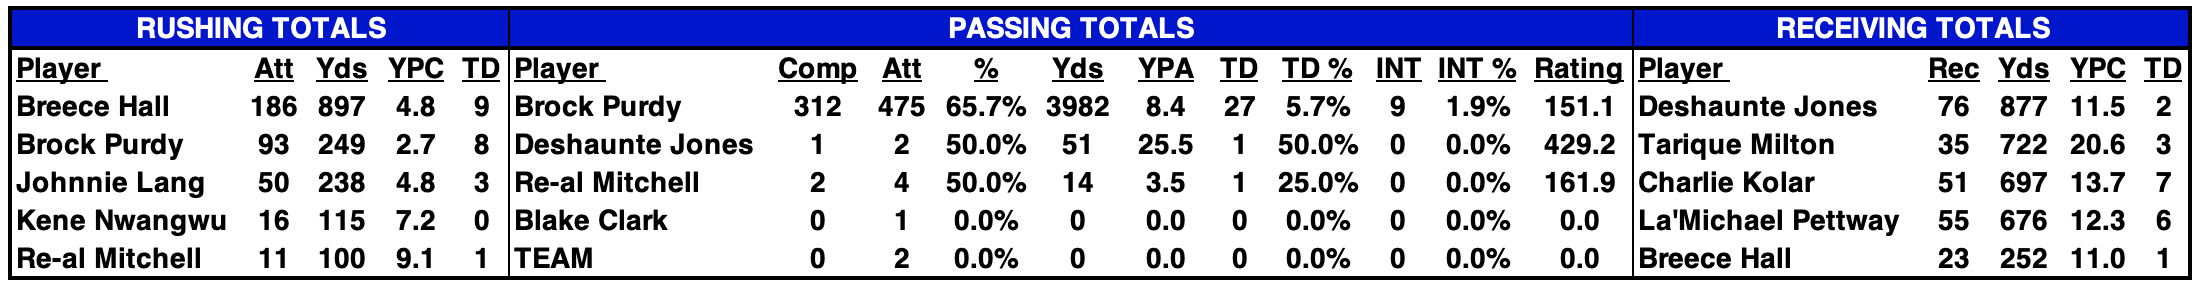
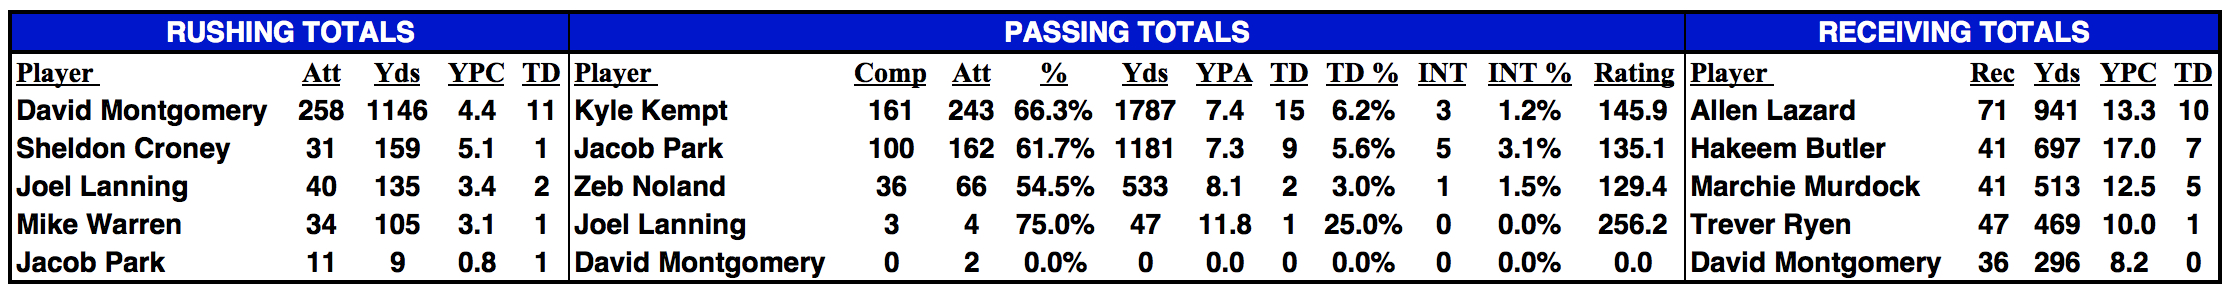
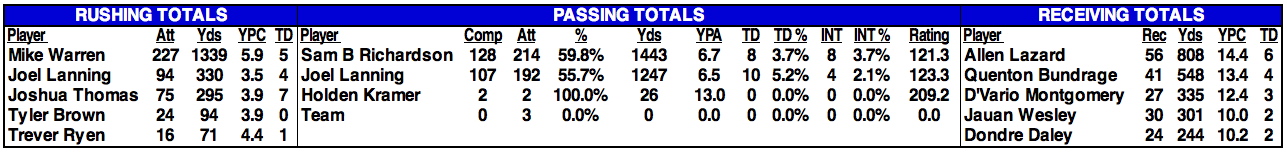
2025 STATISTICAL LEADERS
|
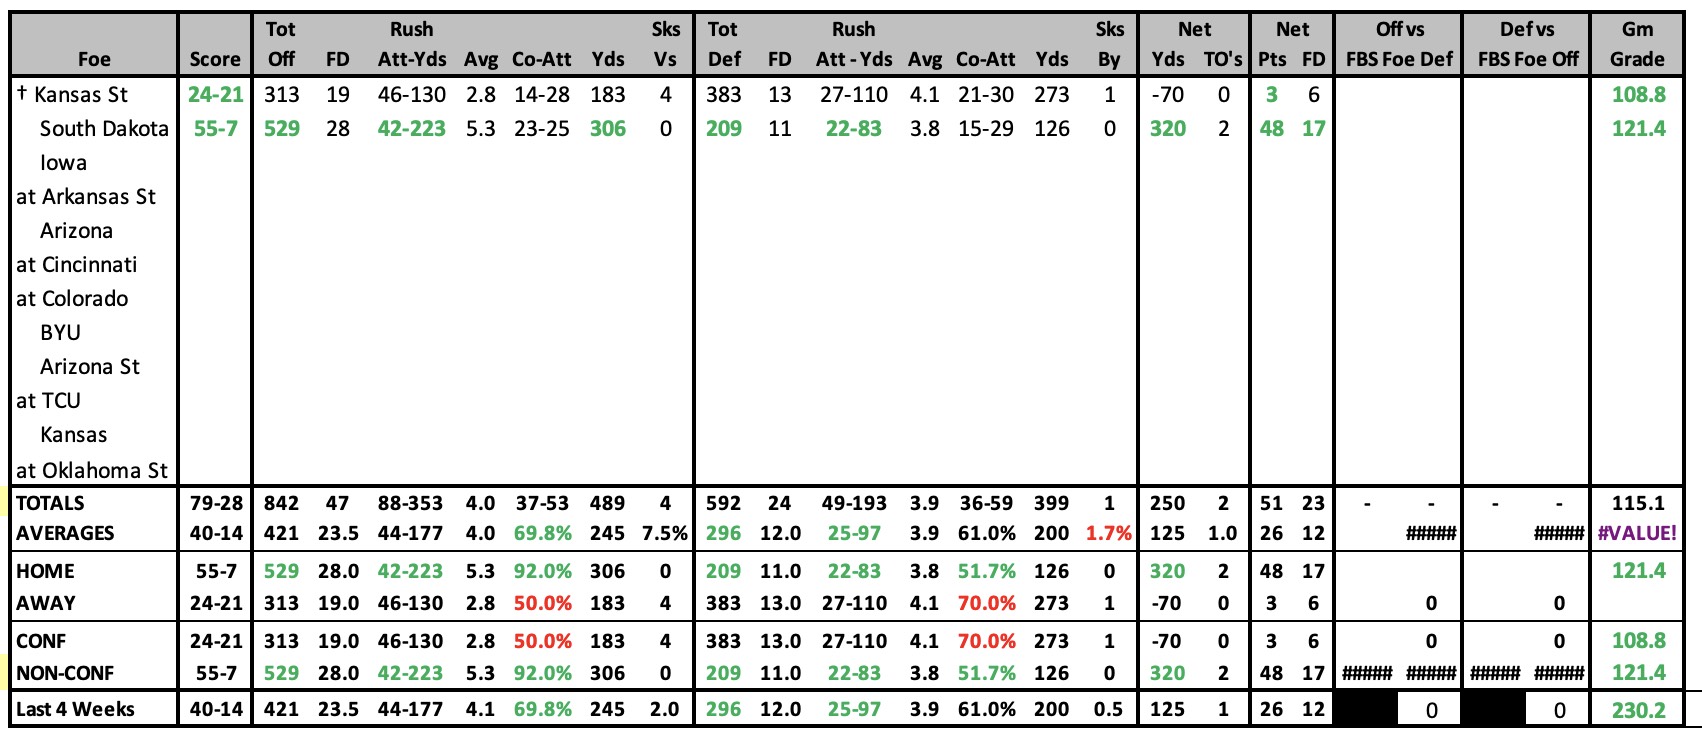
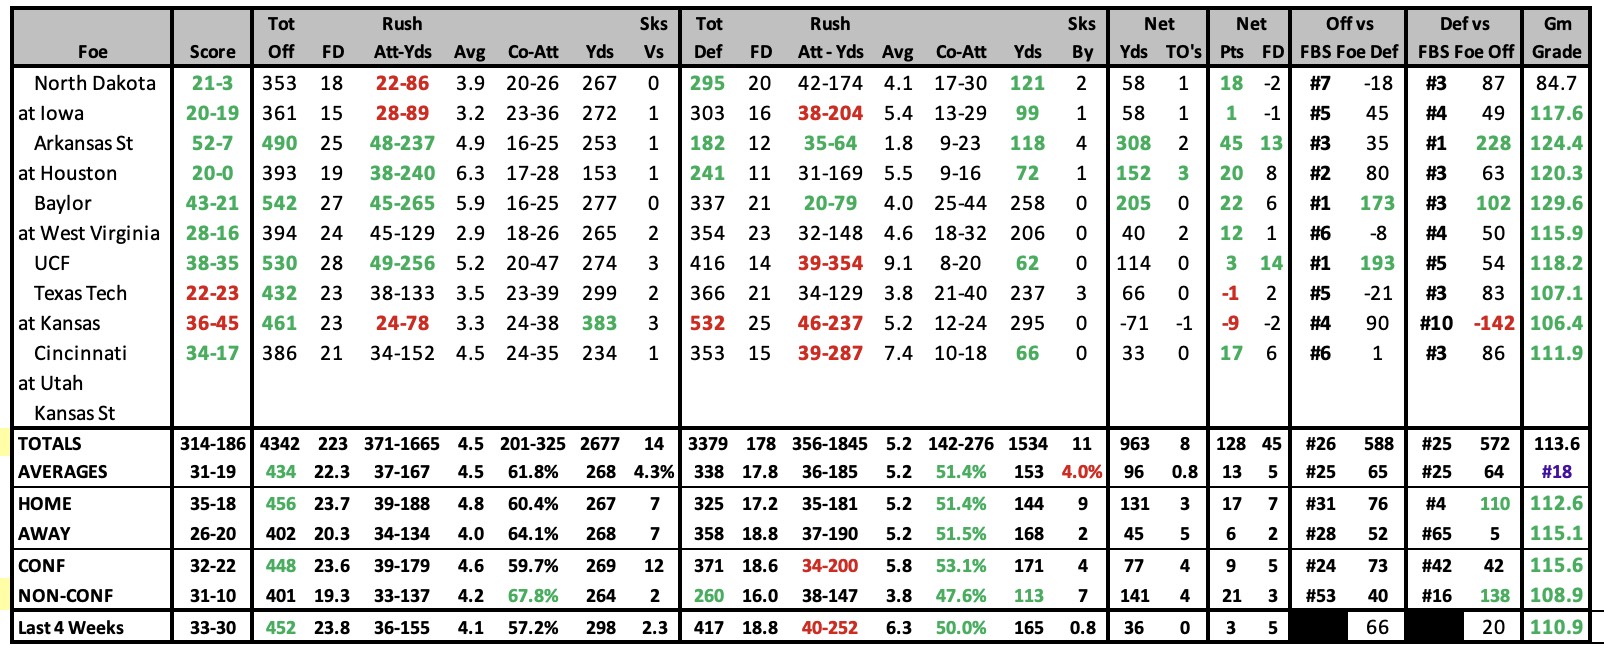
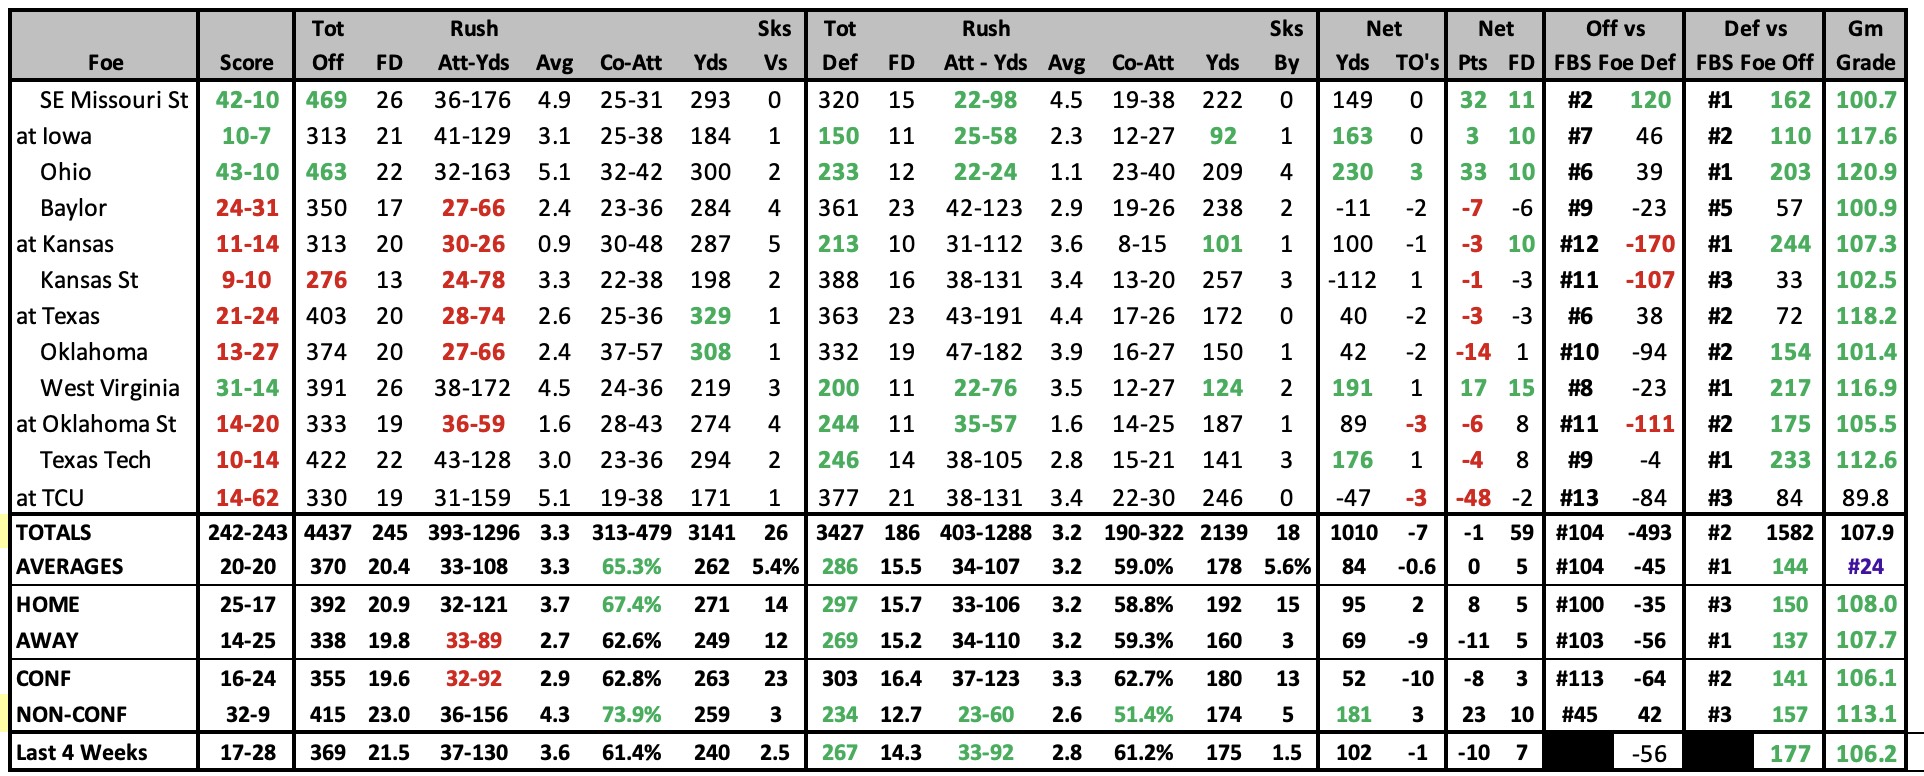
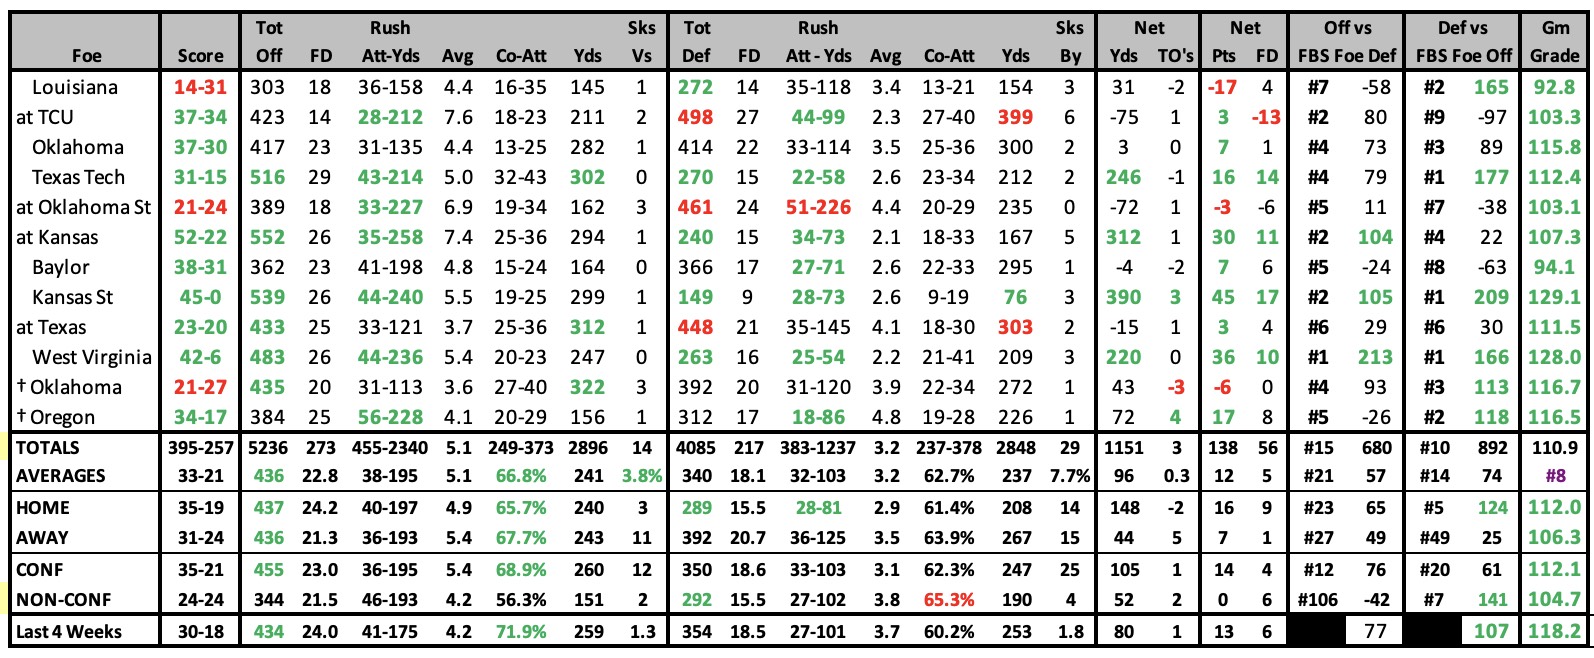
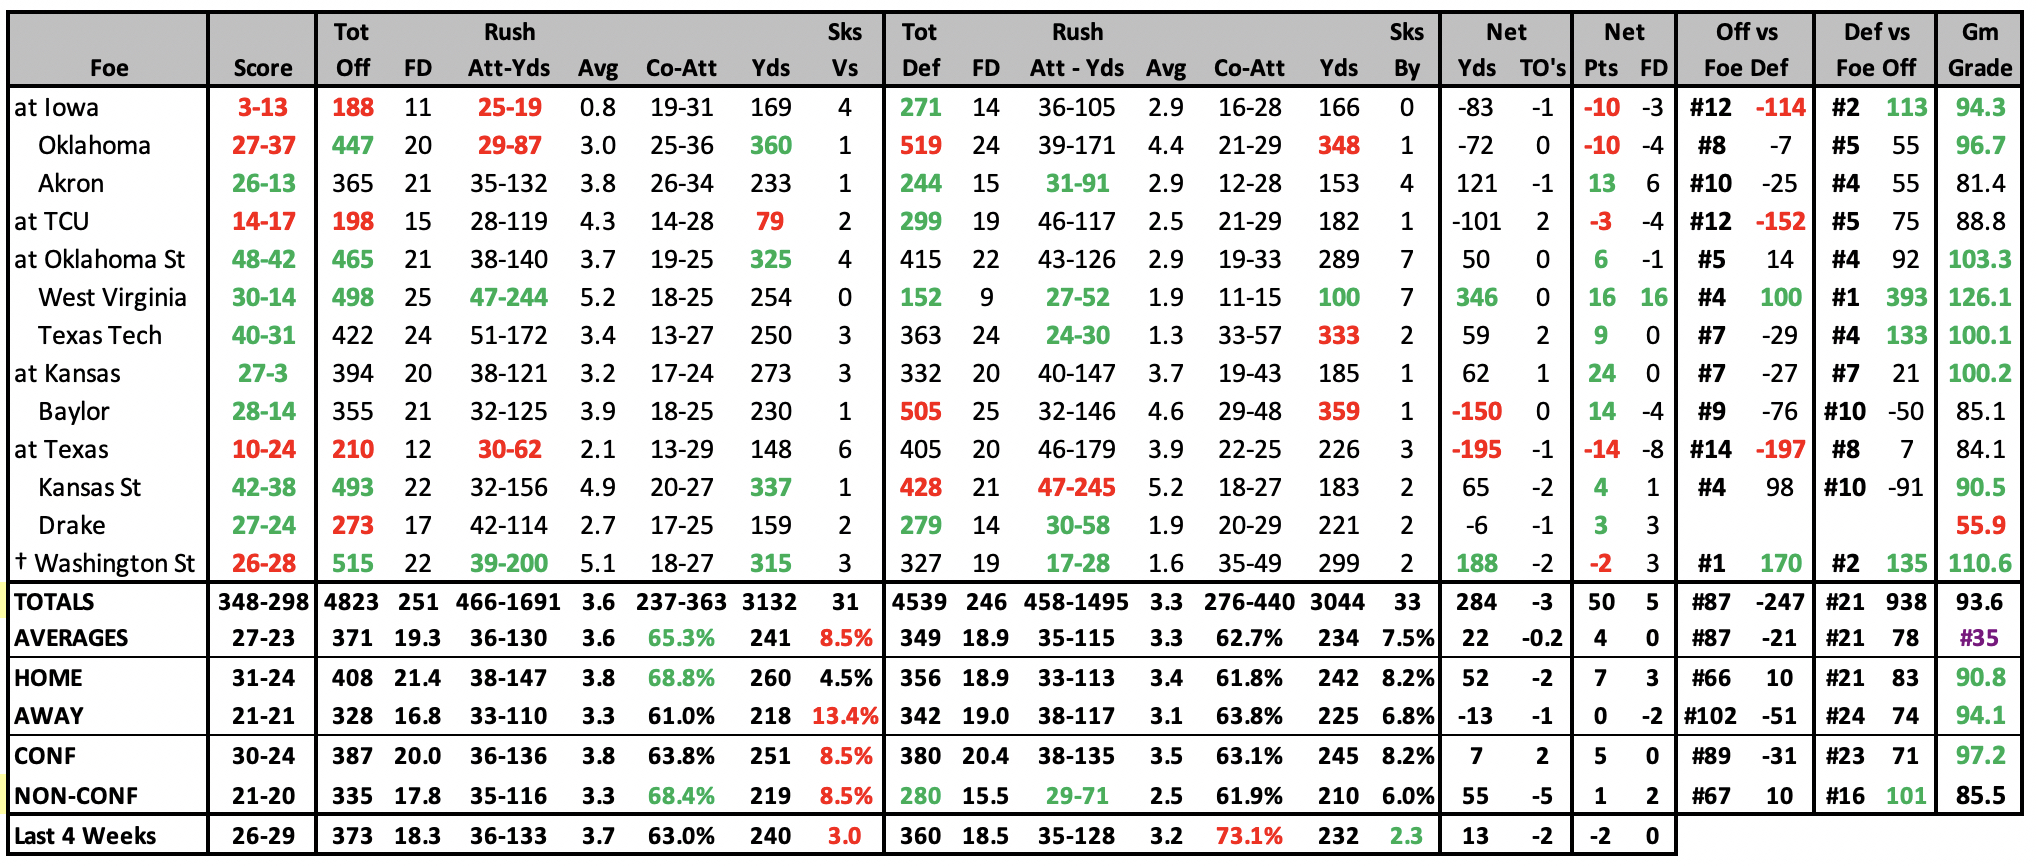
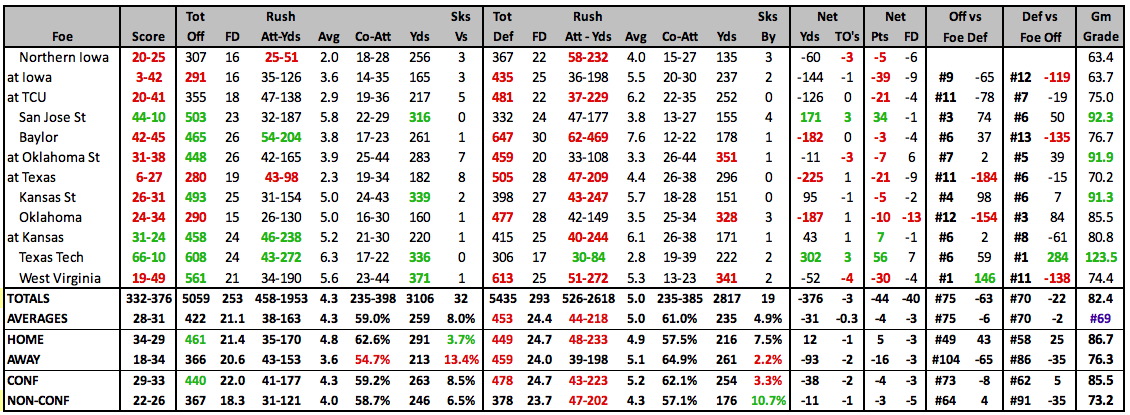
2025 GAME BY GAME STATS
|
 |
2025 SCHEDULE |
2024 RESULTS |
||||||||||||||||||||||||||||||||||||||||||||||||||||||||||||||||||||||||||||||||||||||||||||||||||||||||||||||||||||||||||||||||||||||||||||||||||||||||||||||||||||||||||||||||||||||||||||||||||||||||||||||||||||||||
|
|
||||||||||||||||||||||||||||||||||||||||||||||||||||||||||||||||||||||||||||||||||||||||||||||||||||||||||||||||||||||||||||||||||||||||||||||||||||||||||||||||||||||||||||||||||||||||||||||||||||||||||||||||||||||||
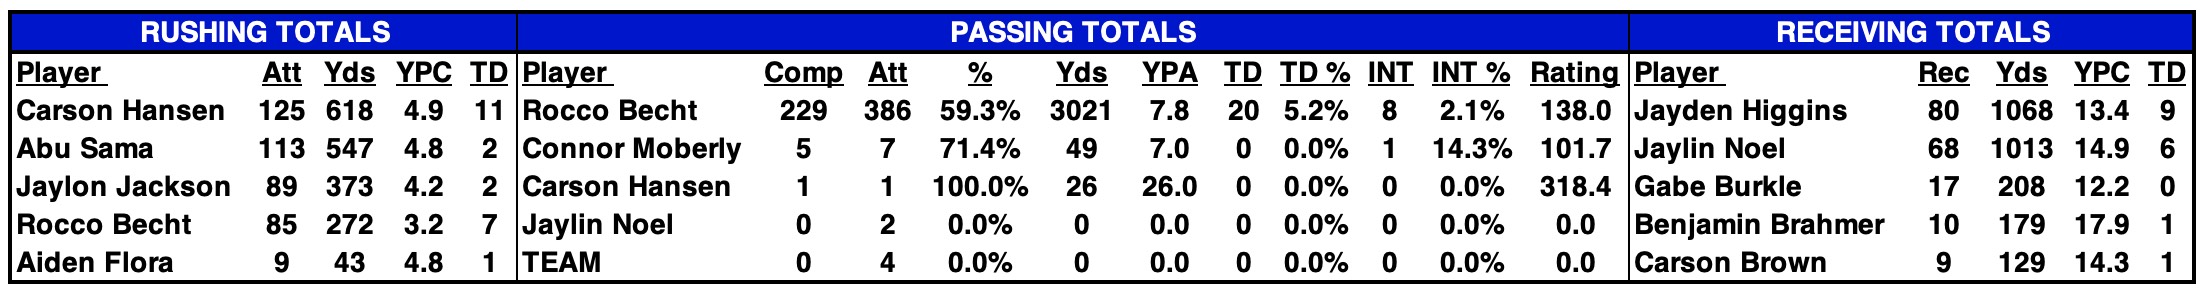
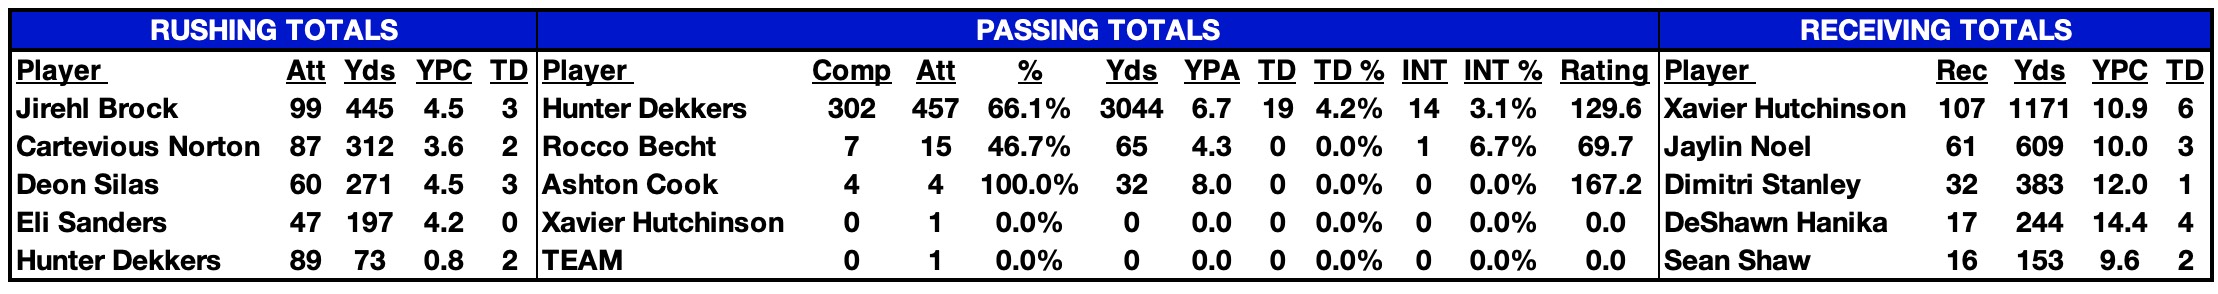
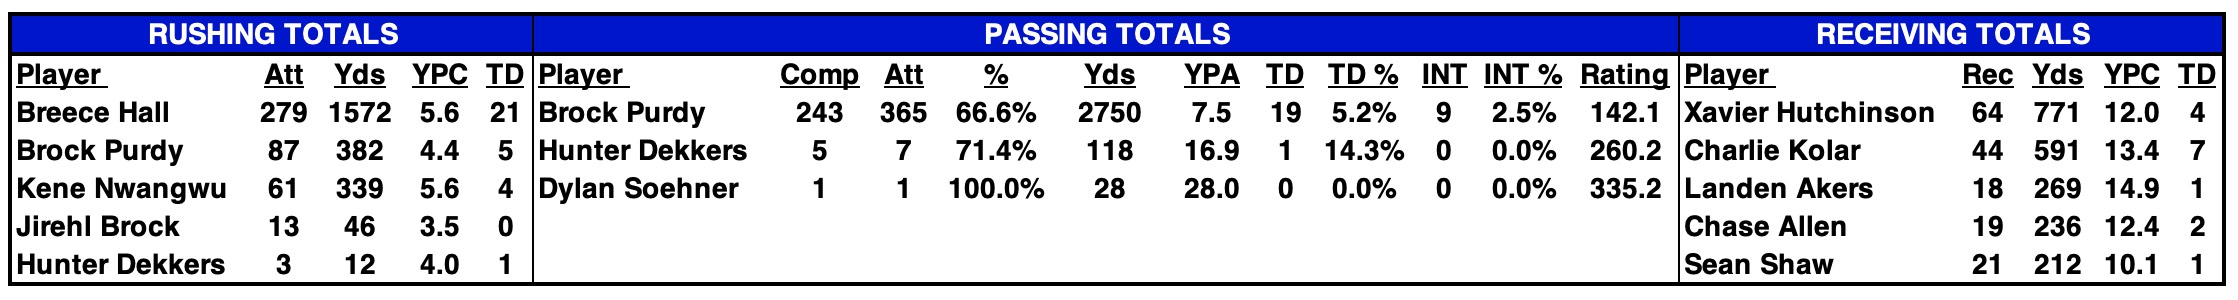
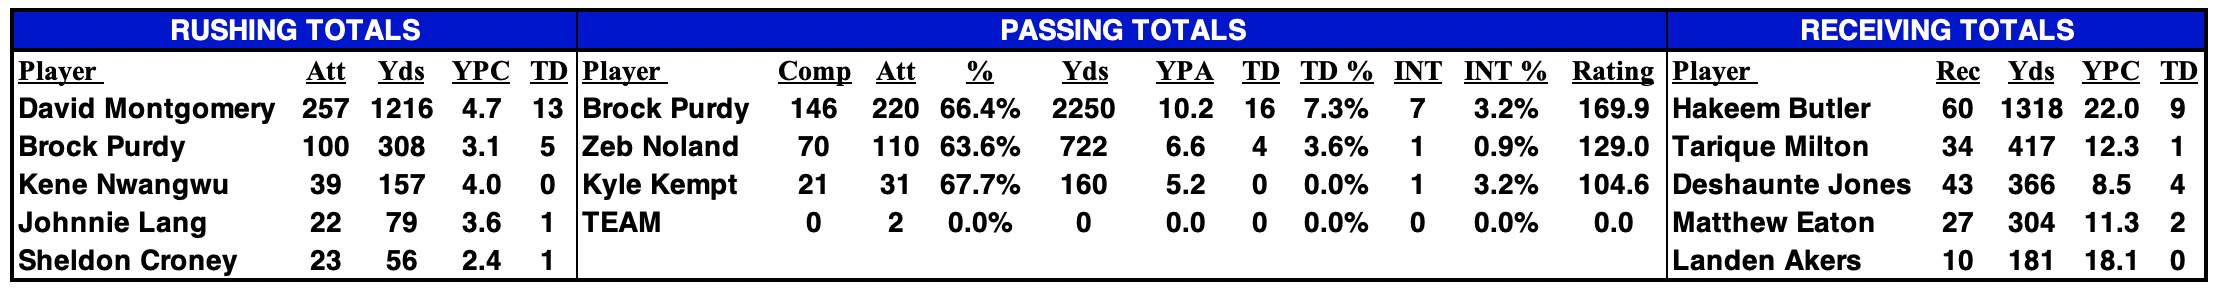
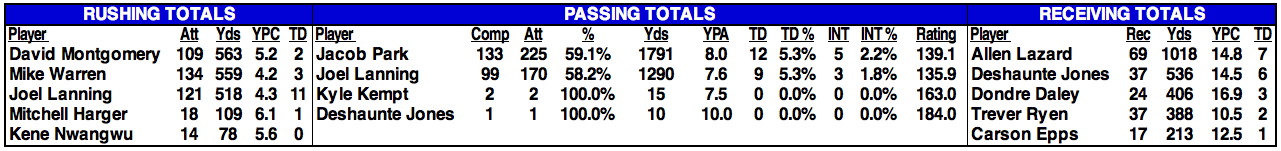
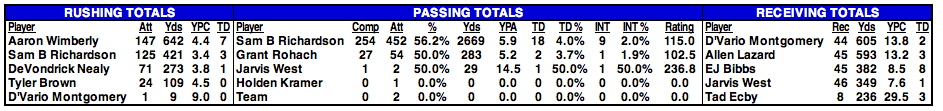
2024 STATISTICAL LEADERS
|
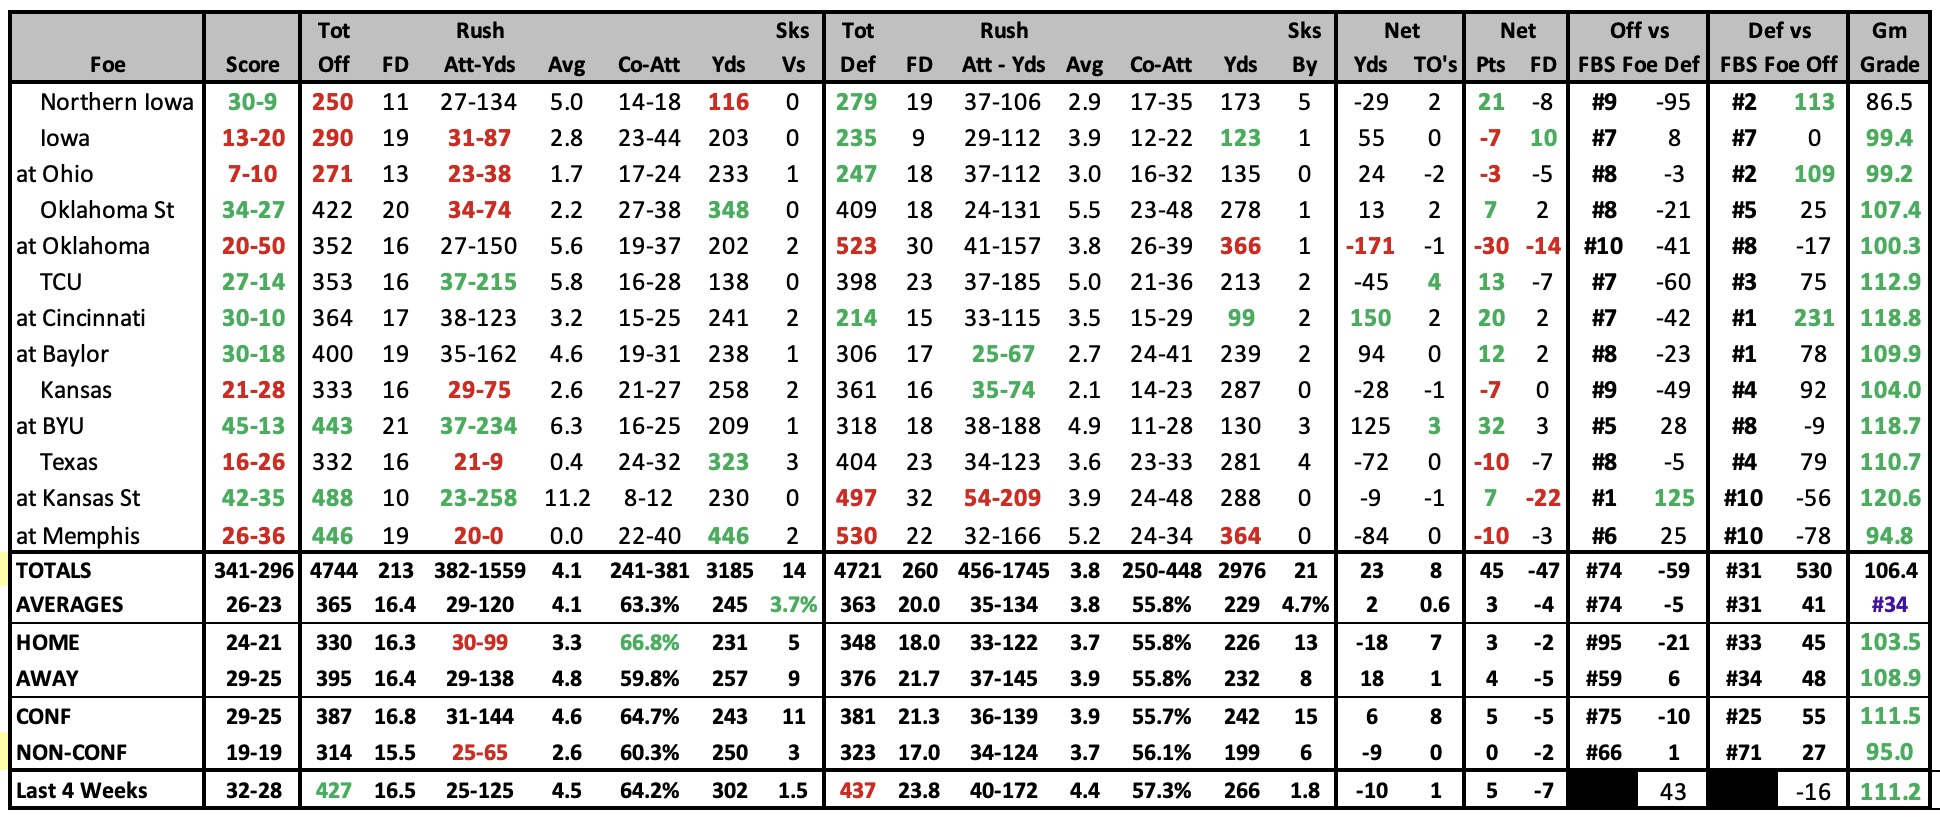
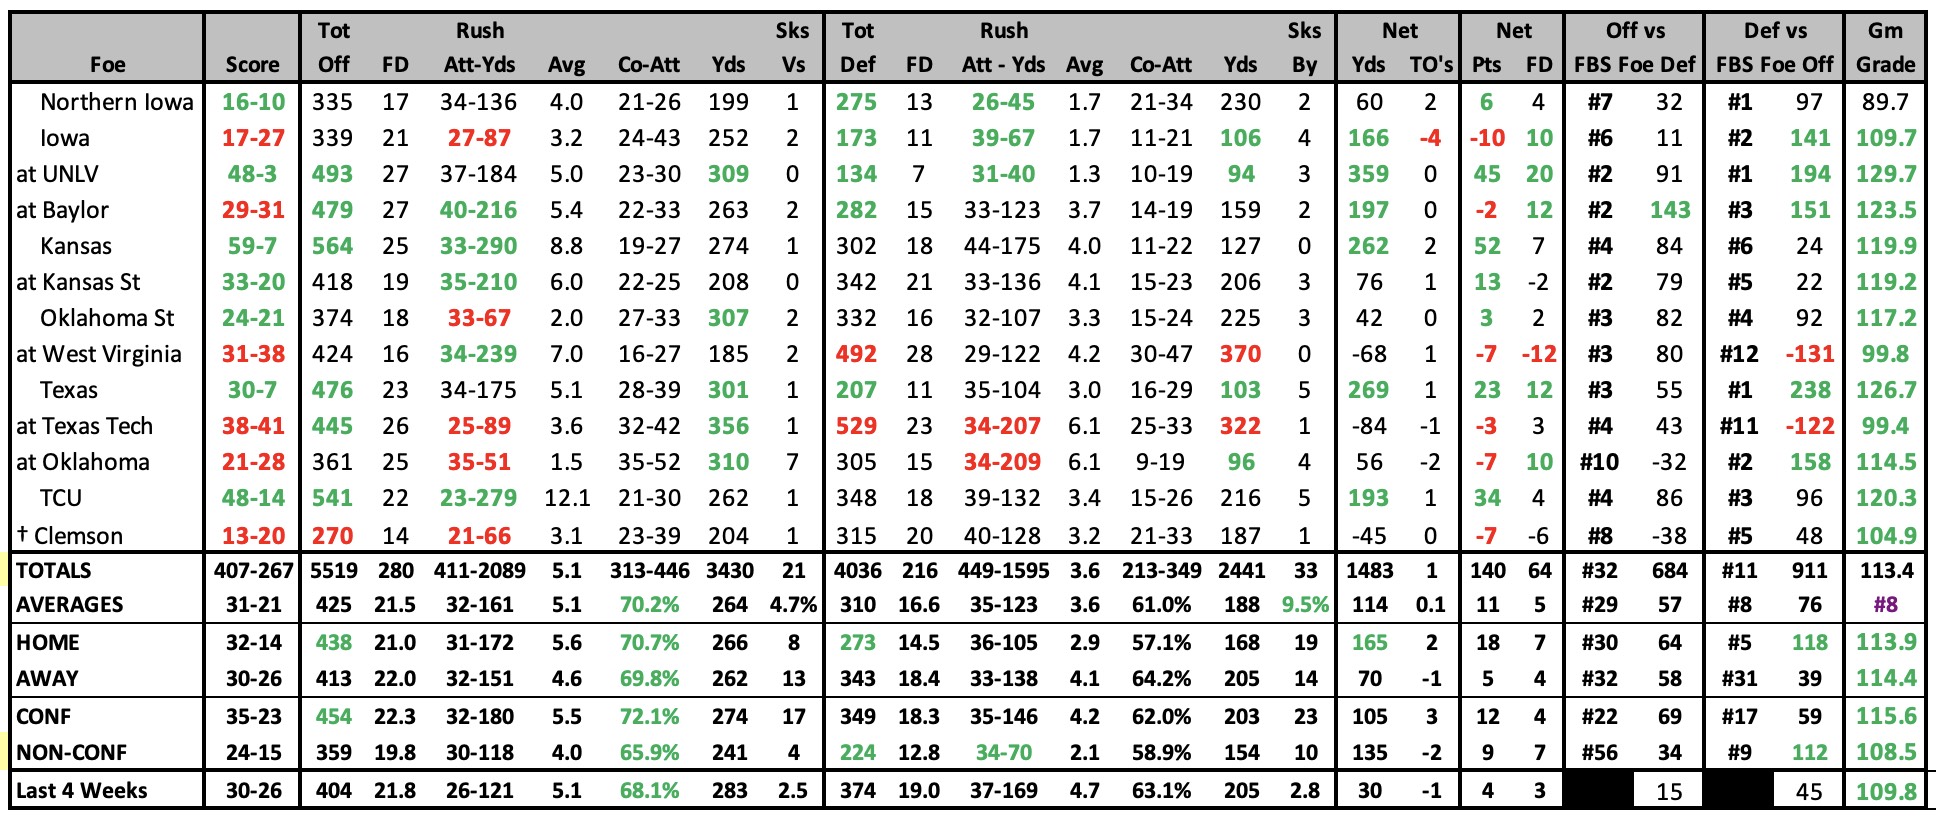
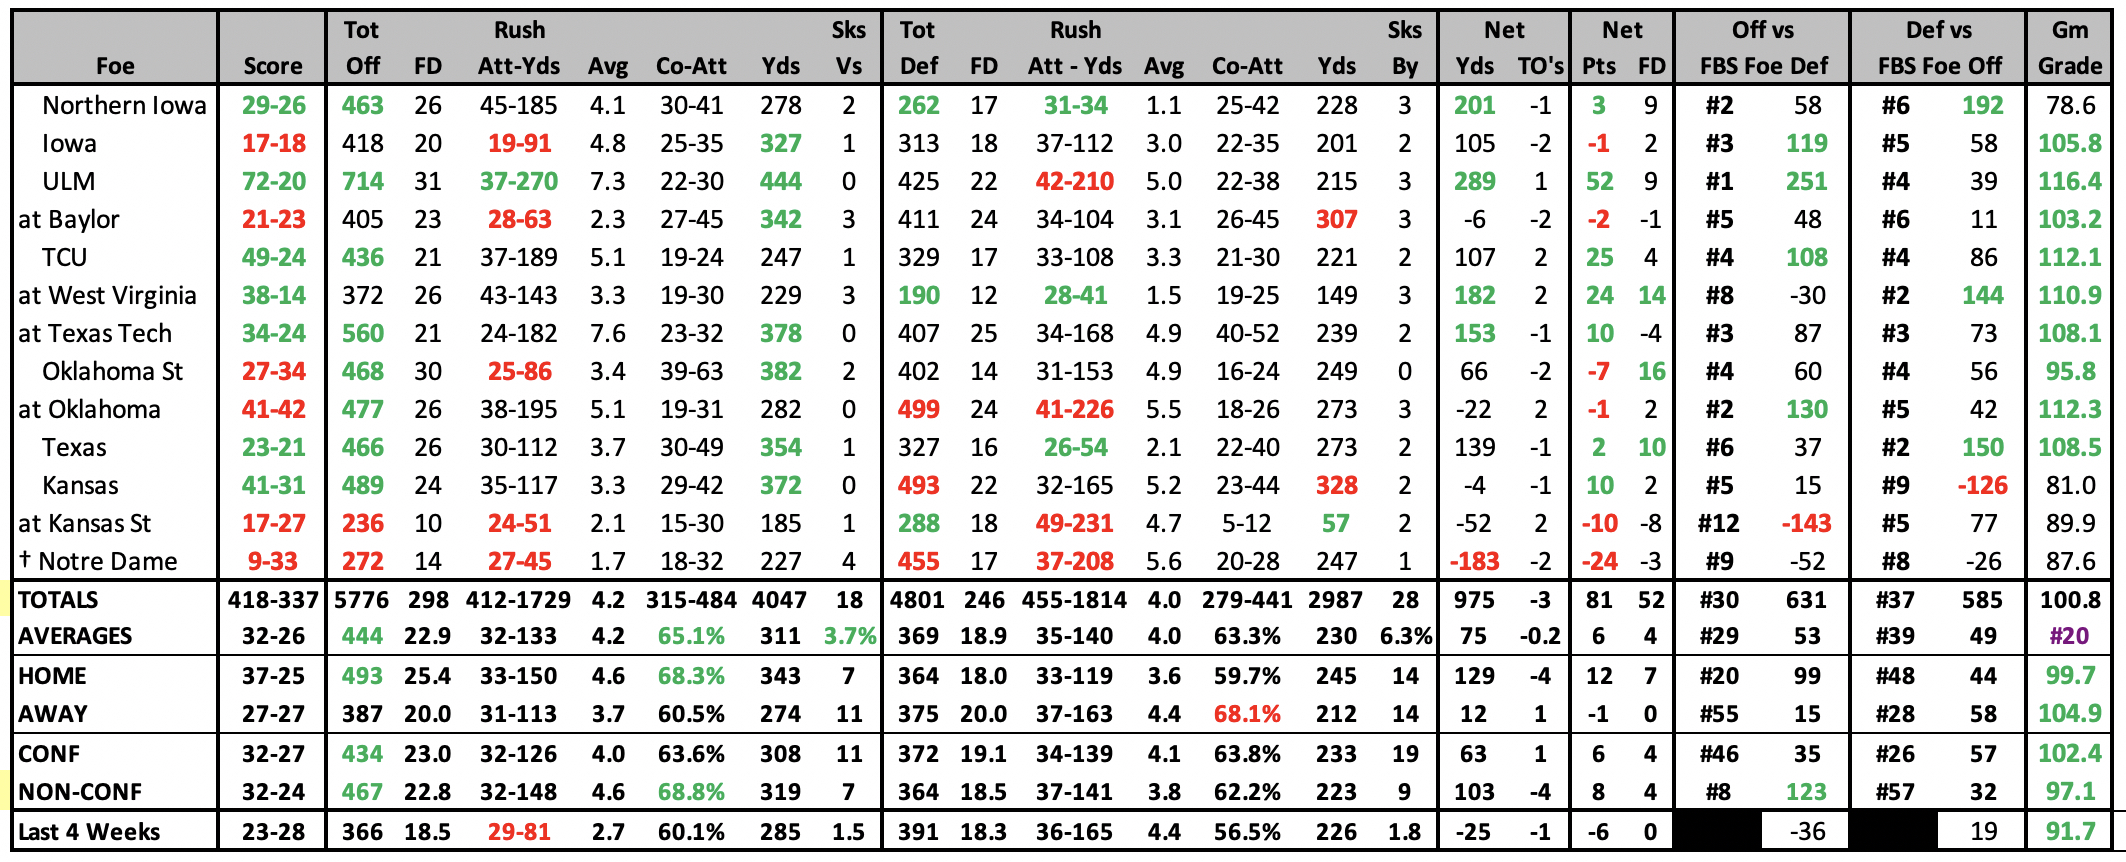
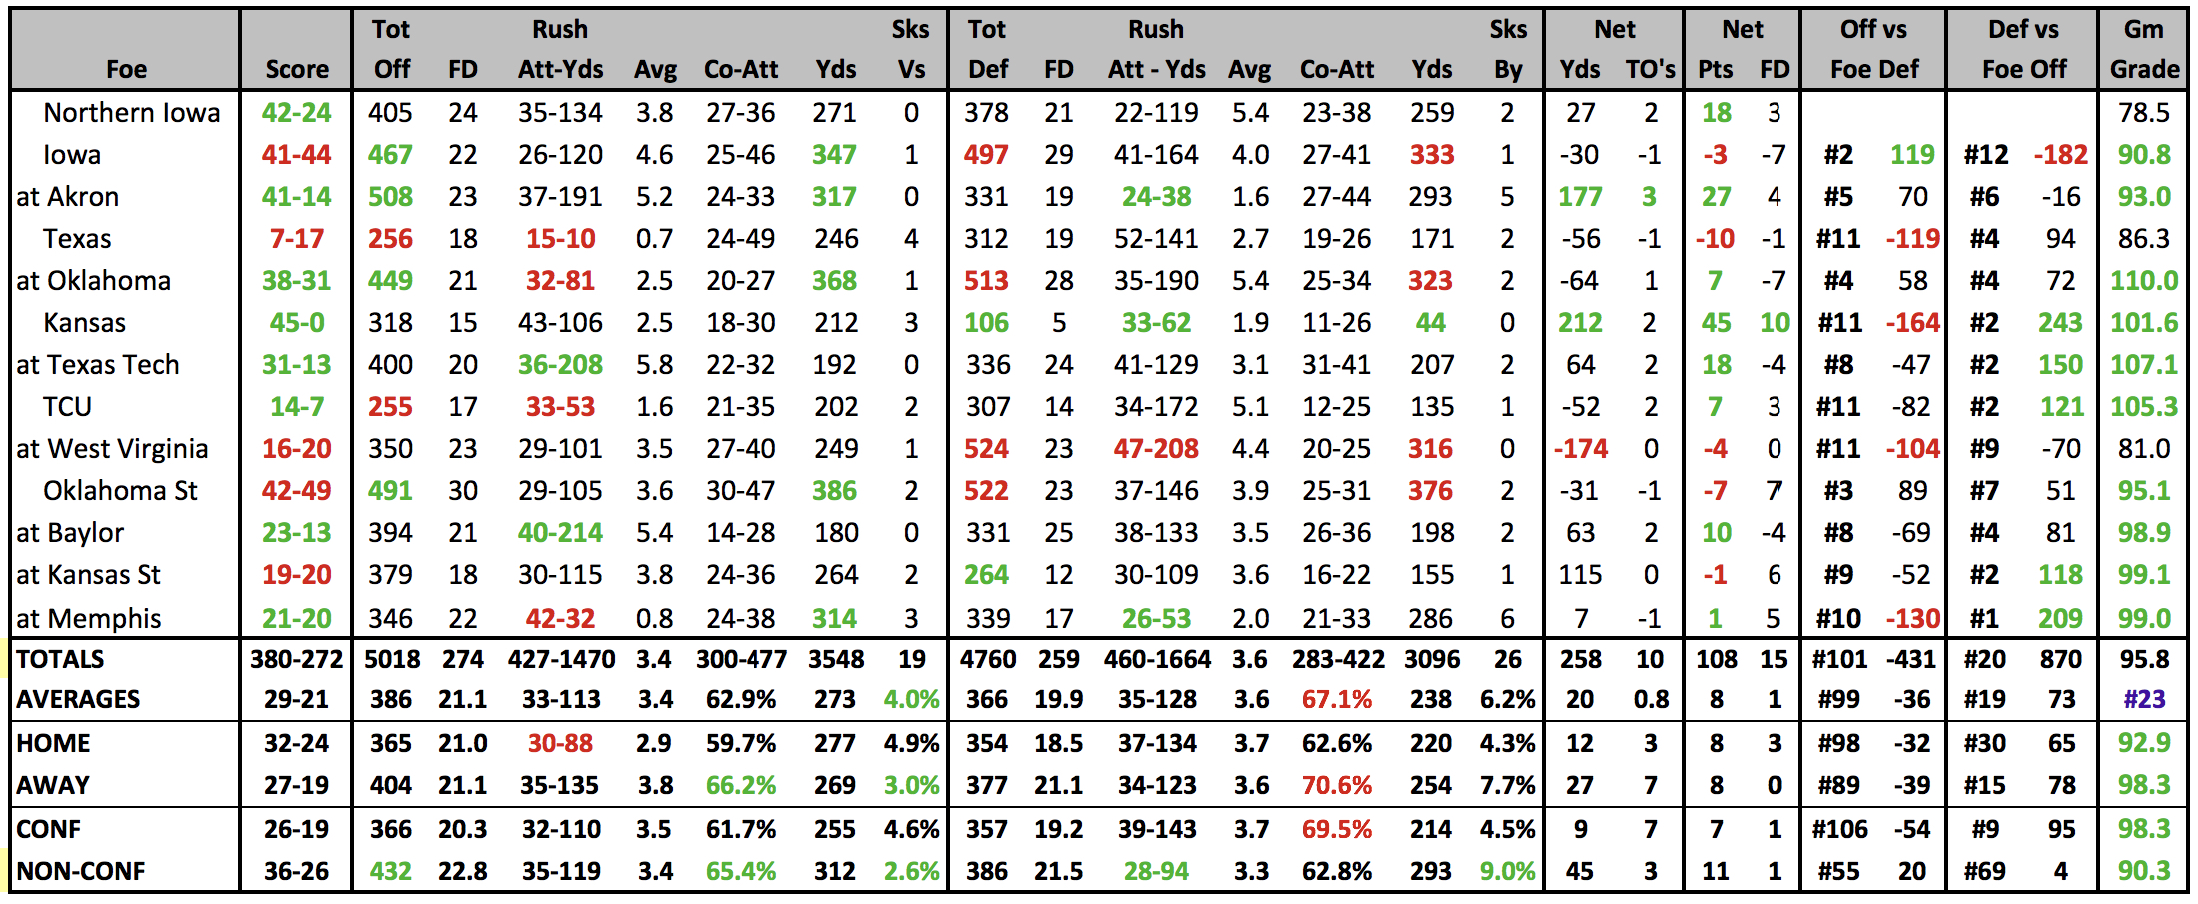
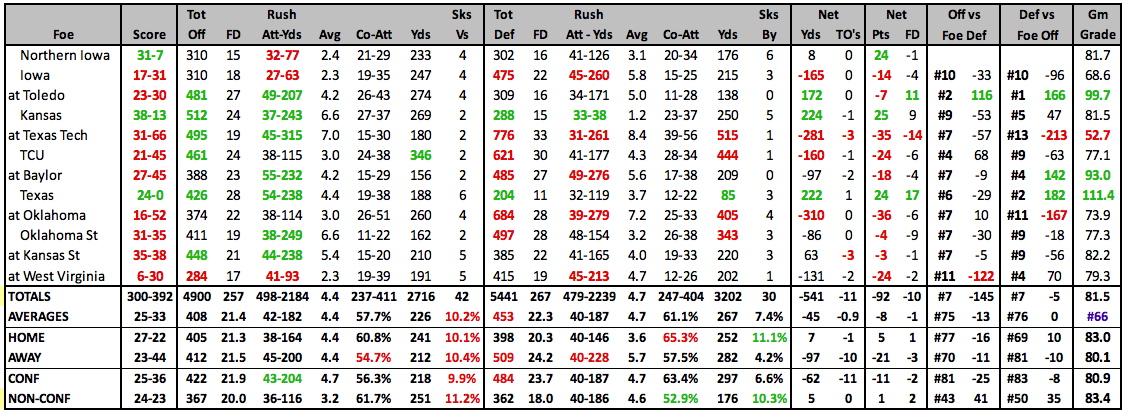
2024 GAME BY GAME STATS
|
 |
2024 SCHEDULE |
2023 RESULTS |
||||||||||||||||||||||||||||||||||||||||||||||||||||||||||||||||||||||||||||||||||||||||||||||||||||||||||||||||||||||||||||||||||||||||||||||||||||||||||||||||||||||||||||||||||||||||||||||||||||||||||||||||||||||||
|
|
||||||||||||||||||||||||||||||||||||||||||||||||||||||||||||||||||||||||||||||||||||||||||||||||||||||||||||||||||||||||||||||||||||||||||||||||||||||||||||||||||||||||||||||||||||||||||||||||||||||||||||||||||||||||
2023 STATISTICAL LEADERS
|
2023 GAME BY GAME STATS
|
 |
2023 SCHEDULE |
2022 RESULTS |
||||||||||||||||||||||||||||||||||||||||||||||||||||||||||||||||||||||||||||||||||||||||||||||||||||||||||||||||||||||||||||||||||||||||||||||||||||||||||||||||||||||||||||||||||||||||||||||||
|
|
||||||||||||||||||||||||||||||||||||||||||||||||||||||||||||||||||||||||||||||||||||||||||||||||||||||||||||||||||||||||||||||||||||||||||||||||||||||||||||||||||||||||||||||||||||||||||||||||
2022 STATISTICAL LEADERS
|
2022 GAME BY GAME STATS
|
 |
2022 SCHEDULE |
2021 RESULTS |
||||||||||||||||||||||||||||||||||||||||||||||||||||||||||||||||||||||||||||||||||||||||||||||||||||||||||||||||||||||||||||||||||||||||||||||||||||||||||||||||||||||||||||||||||||||||||||||||
|
|
||||||||||||||||||||||||||||||||||||||||||||||||||||||||||||||||||||||||||||||||||||||||||||||||||||||||||||||||||||||||||||||||||||||||||||||||||||||||||||||||||||||||||||||||||||||||||||||||
2021 STATISTICAL LEADERS
|
2021 GAME BY GAME STATS
|
 |
2021 SCHEDULE |
2020 RESULTS |
||||||||||||||||||||||||||||||||||||||||||||||||||||||||||||||||||||||||||||||||||||||||||||||||||||||||||||||||||||||||||||||||||||||||||||||||||||||||||||||||||||||||||||||||||||||||||||||||||||||||||||
|
|
||||||||||||||||||||||||||||||||||||||||||||||||||||||||||||||||||||||||||||||||||||||||||||||||||||||||||||||||||||||||||||||||||||||||||||||||||||||||||||||||||||||||||||||||||||||||||||||||||||||||||||
2020 STATISTICAL LEADERS
|
2020 GAME BY GAME STATS
|
 |
2020 SCHEDULE |
2019 RESULTS |
||||||||||||||||||||||||||||||||||||||||||||||||||||||||||||||||||||||||||||||||||||||||||||||||||||||||||||||||||||||||||||||||||||||||||||||||||||||||||||||||||||||||||||||||||||||||||||||||||||||||||||||||||||||||
|
|
||||||||||||||||||||||||||||||||||||||||||||||||||||||||||||||||||||||||||||||||||||||||||||||||||||||||||||||||||||||||||||||||||||||||||||||||||||||||||||||||||||||||||||||||||||||||||||||||||||||||||||||||||||||||
2019 STATISTICAL LEADERS
|
2019 GAME BY GAME STATS
|
 |
2019 SCHEDULE |
2018 RESULTS |
|||||||||||||||||||||||||||||||||||||||||||||||||||||||||||||||||||||||||||||||||||||||||||||||||||||||||||||||||||||||||||||||||||||||||||||||||||||||||||||||||||||||||||||||||||||||||||||||||||||||||||||||||||||||||||||||||||
|
|
|||||||||||||||||||||||||||||||||||||||||||||||||||||||||||||||||||||||||||||||||||||||||||||||||||||||||||||||||||||||||||||||||||||||||||||||||||||||||||||||||||||||||||||||||||||||||||||||||||||||||||||||||||||||||||||||||||
2018 STATISTICAL LEADERS
|
2018 GAME BY GAME STATS
|
 |
2018 SCHEDULE |
2017 RESULTS |
||||||||||||||||||||||||||||||||||||||||||||||||||||||||||||||||||||||||||||||||||||||||||||||||||||||||||||||||||||||||||||||||||||||||||||||||||||||||||||||||||||||||||||||||||||||||||||||||||||||||||||||||||||||||||||||||||||||||||||||
|
|
||||||||||||||||||||||||||||||||||||||||||||||||||||||||||||||||||||||||||||||||||||||||||||||||||||||||||||||||||||||||||||||||||||||||||||||||||||||||||||||||||||||||||||||||||||||||||||||||||||||||||||||||||||||||||||||||||||||||||||||
2017 STATISTICAL LEADERS
|
2017 GAME BY GAME STATS
|
 |
2017 SCHEDULE |
2016 RESULTS |
||||||||||||||||||||||||||||||||||||||||||||||||||||||||||||||||||||||||||||||||||||||||||||||||||||||||||||||||||||||||||||||||||||||||||||||||||||||||||||||||||||||||||||||||||||||||||||||||||||||||||||||||||||||||||||||||
|
|
||||||||||||||||||||||||||||||||||||||||||||||||||||||||||||||||||||||||||||||||||||||||||||||||||||||||||||||||||||||||||||||||||||||||||||||||||||||||||||||||||||||||||||||||||||||||||||||||||||||||||||||||||||||||||||||||
2016 STATISTICAL LEADERS
|
2016 GAME BY GAME STATS
|
 |
2015 STATISTICAL LEADERS
|
2015 GAME BY GAME STATS
|
 |
2015 SCHEDULE |
2014 RESULTS |
||||||||||||||||||||||||||||||||||||||||||||||||||||||||||||||||||||||||||||||||||||||||||||||||||||||||||||||||||||||||||||||||||||||||||||||||||||||||||||||||||||||||||||||||||||||||||||||||||||||||||||||||||||||||||||||||
|
|
||||||||||||||||||||||||||||||||||||||||||||||||||||||||||||||||||||||||||||||||||||||||||||||||||||||||||||||||||||||||||||||||||||||||||||||||||||||||||||||||||||||||||||||||||||||||||||||||||||||||||||||||||||||||||||||||
2014 STATISTICAL LEADERS
|
2014 GAME BY GAME STATS
|
 |
2013 STATISTICAL LEADERS
|
| Player | Att | Yds | YPC | TD | Player | Comp | Att | % | Yds | YPA | TD | INT | Rating | Player | Rec | Yds | YPC | TD |
| Aaron Wimberly | 141 | 567 | 4.0 | 2 | Sam Richardson | 121 | 220 | 55.0% | 1397 | 6.4 | 11 | 7 | 118.5 | Quenton Bundrage | 48 | 676 | 14.1 | 9 |
| Shontrelle Johnson | 90 | 358 | 4.0 | 3 | Grant Rohach | 110 | 191 | 57.6% | 1208 | 6.3 | 8 | 7 | 117.2 | EJ Bibbs | 39 | 462 | 11.8 | 2 |
| Sam Richardson | 101 | 356 | 3.5 | 2 | Kirby Van Der Kamp | 1 | 1 | 1 | 25 | 25 | 0 | 0 | 310.0 | Justin Coleman | 31 | 442 | 14.3 | 3 |
2013 GAME BY GAME STATS
|
 |
2013 RESULTS |
2012 RESULTS |
|||||||||||||||||||||||||||||||||||||||||||||||||||||||||||||||||||||||||||||||||||||||||||||||||||||||||||||||||||||||||||||||||||||||||||||||||||||||||||||||||||||||||||||||||||||||||||||||||||||||||||||||||||||||||||||||||||||||||||||||||||||||||||||||||||||||
|
|
|||||||||||||||||||||||||||||||||||||||||||||||||||||||||||||||||||||||||||||||||||||||||||||||||||||||||||||||||||||||||||||||||||||||||||||||||||||||||||||||||||||||||||||||||||||||||||||||||||||||||||||||||||||||||||||||||||||||||||||||||||||||||||||||||||||||
2012 STATISTICAL LEADERS
|
| Player | Att | Yds | YPC | TD | Player | Comp | Att | % | Yds | YPA | TD | INT | Rating | Player | Rec | Yds | YPC | TD | ||
| Shontrelle Johnson | 115 | 506 | 4.4 | 2 | Steele Jantz | 167 | 269 | 62.1% | 1603 | 6.0 | 13 | 12 | 119.2 | Josh Lenz | 31 | 459 | 14.8 | 6 | ||
| James White | 99 | 505 | 5.1 | 2 | Jared Barnett | 52 | 108 | 48.1% | 623 | 5.8 | 6 | 4 | 107.5 | Chris Young | 38 | 411 | 10.8 | 2 | ||
| Sam Richardson | 41 | 233 | 5.7 | 1 | Sam Richardson | 46 | 79 | 58.2% | 541 | 6.8 | 8 | 1 | 146.6 | Aaron Horne | 39 | 369 | 9.5 | 3 |
| 2012 Individual Player Stats • 2012 Start Chart/ Starters Lost |
|---|
2012 GAME BY GAME STATS
|
 |
2011 STATISTICAL LEADERS
|
| Player | Att | Yds | YPC | TD | Player | Comp | Att | % | Yds | YPA | TD | INT | Rating | Player | Rec | Yds | YPC | TD | ||
| James White | 160 | 782 | 4.9 | 8 | Steele Jantz | 138 | 259 | 53.3% | 1519 | 5.9 | 10 | 11 | 106.8 | Darius Reynolds | 43 | 695 | 16.2 | 7 | ||
| Jared Barnett | 104 | 439 | 4.2 | 1 | Jared Barnett | 108 | 218 | 49.5% | 1198 | 5.5 | 6 | 6 | 99.3 | Josh Lenz | 39 | 509 | 13.1 | 2 | ||
| Jeff Woody | 90 | 371 | 4.1 | 6 | Josh Lenz | 1 | 1 | 100.0% | 40 | 40.0 | 1 | 0 | 766.0 | Aaron Horne | 38 | 431 | 11.3 | 0 |
| 2011 Individual Player Stats • 2011 START CHART/STARTERS LOST |
|---|
2011 GAME BY GAME STATS
|
2011 RESULTS |
2010 RESULTS |
||||||||||||||||||||||||||||||||||||||||||||||||||||||||||||||||||||||||||||||||||||||||||||||||||||||||||||||||||||||||||||||||||||||||||||||||||||||||||||||||||||||||||||||||||||||||||||||||||||
|
|
||||||||||||||||||||||||||||||||||||||||||||||||||||||||||||||||||||||||||||||||||||||||||||||||||||||||||||||||||||||||||||||||||||||||||||||||||||||||||||||||||||||||||||||||||||||||||||||||||||
2010 STATISTICAL LEADERS |
| Player | Att | Yds | YPC | TD | Player | Comp | Att | % | Yds | YPA | TD | INT | Rating | Player | Rec | Yds | YPC | TD | ||
| Alexander Robinson | 201 | 957 | 4.76 | 9 | Austen Arnaud | 171 | 290 | 59.0% | 1704 | 5.9 | 13 | 10 | 116.2 | Collin Franklin | 54 | 534 | 9.9 | 3 | ||
| Austen Arnaud | 103 | 285 | 2.77 | 2 | Jerome Tiller | 39 | 82 | 47.6% | 354 | 4.3 | 1 | 0 | 87.8 | Jake Williams | 34 | 396 | 11.6 | 4 | ||
| Shontrelle Johnson | 35 | 217 | 6.20 | 2 | Van Der Kamp | 1 | 1 | 100.0% | 25 | 25.0 | 0 | 0 | 310.0 | Darius Darks | 29 | 356 | 12.3 | 1 |
| 2010 Individual Player Stats |
|---|
2010 GAME BY GAME STATS
|
2009 STATISTICAL LEADERS
|
| Player | Att | Yds | YPC | TD | Player | Comp | Att | % | Yds | YPA | TD | INT | Rating | Player | Rec | Yds | YPC | TD | ||
| Alexan Robinson | 210 | 1058 | 5.04 | 6 | Austin Arnaud | 159 | 277 | 57.4% | 1799 | 6.5 | 13 | 11 | 119.5 | Marqui Hamilton | 46 | 574 | 12.5 | 4 | ||
| Austin Arnaud | 126 | 485 | 3.85 | 7 | Jerome Tiller | 41 | 73 | 56.2% | 376 | 5.2 | 1 | 4 | 93.0 | Jake Williams | 30 | 320 | 10.7 | 4 | ||
| Jeremi Schwartz | 71 | 264 | 3.72 | 0 | Alexander Robinson | 1 | 1 | 100.0% | 10 | 10.0 | 1 | 0 | 514.0 | Derrick Catlett | 27 | 289 | 10.7 | 2 |
| 2009 Individual Player Stats |
|---|
2009 GAME BY GAME STATS
|
2009 RESULTS |
2008 RESULTS |
|||||||||||||||||||||||||||||||||||||||||||||||||||||||||||||||||||||||||||||||||||||||||||||||||||||||||||||||||||||||||||||||||||||||||||||||||
|
|
|||||||||||||||||||||||||||||||||||||||||||||||||||||||||||||||||||||||||||||||||||||||||||||||||||||||||||||||||||||||||||||||||||||||||||||||||
| 2008 Individual Player Stats • 2007 Individual Player Stats |
|---|