
OKLAHOMA SOONERS |
|
STADIUM: Gaylord Family Memorial Stadium PLAYING SURFACE: Grass • CAPACITY: 86,112 STARTERS RETURNING (O/D): 7*/6
|
 |
|
| LOCATION: Norman, OK | |
| FOUNDED:1890 | |
| ENROLLMENT: 22,152 | |
| COLORS: Crimson & Cream | |
| MASCOT: Sooner Schooner | |
| CONFERENCE: Big 12 | |
| HEAD COACH: Brent Venables | |
| YRS WITH TM: 2nd | |
| OVERALL RECORD: 6-7 | |
| RECORD WITH TM: 6-7 | |
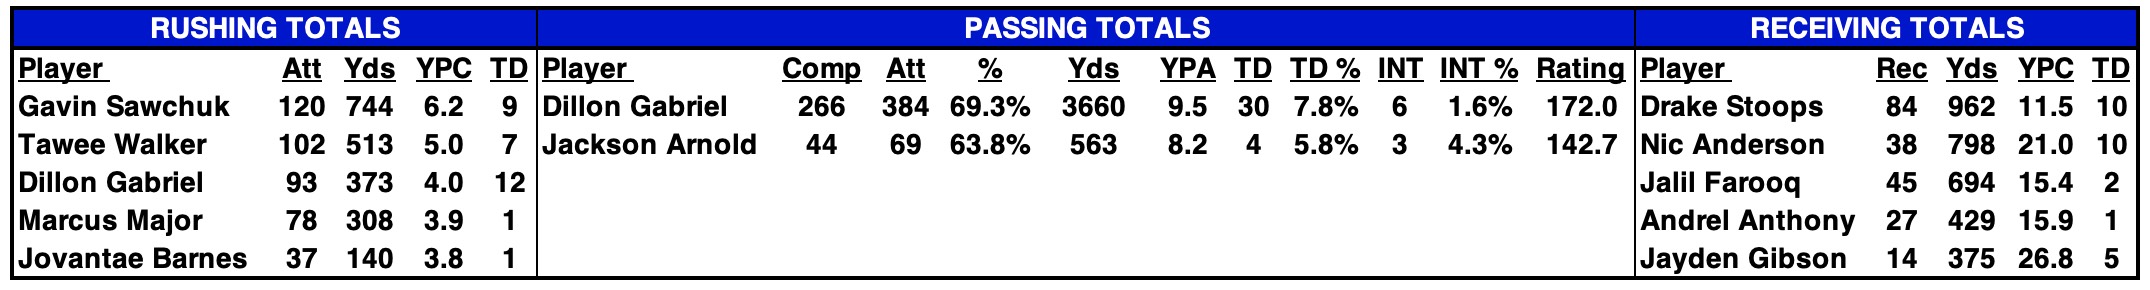
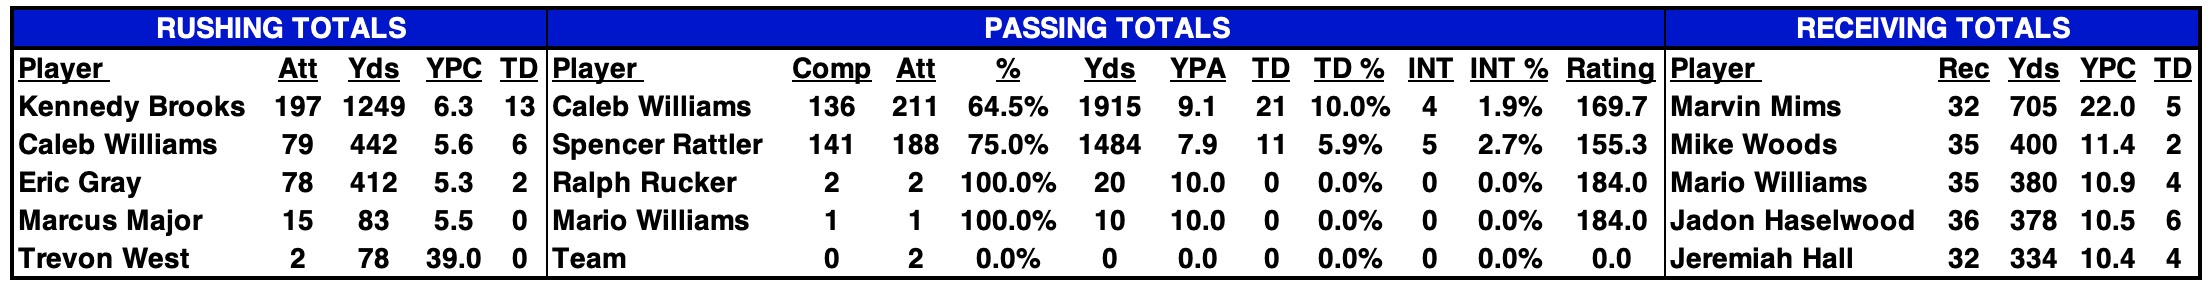
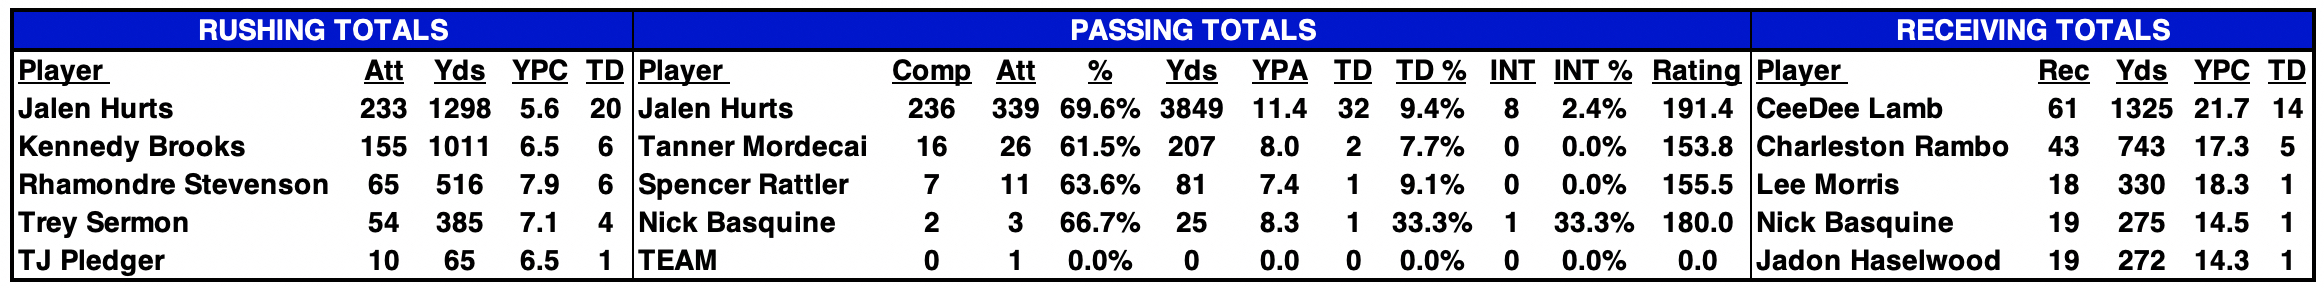
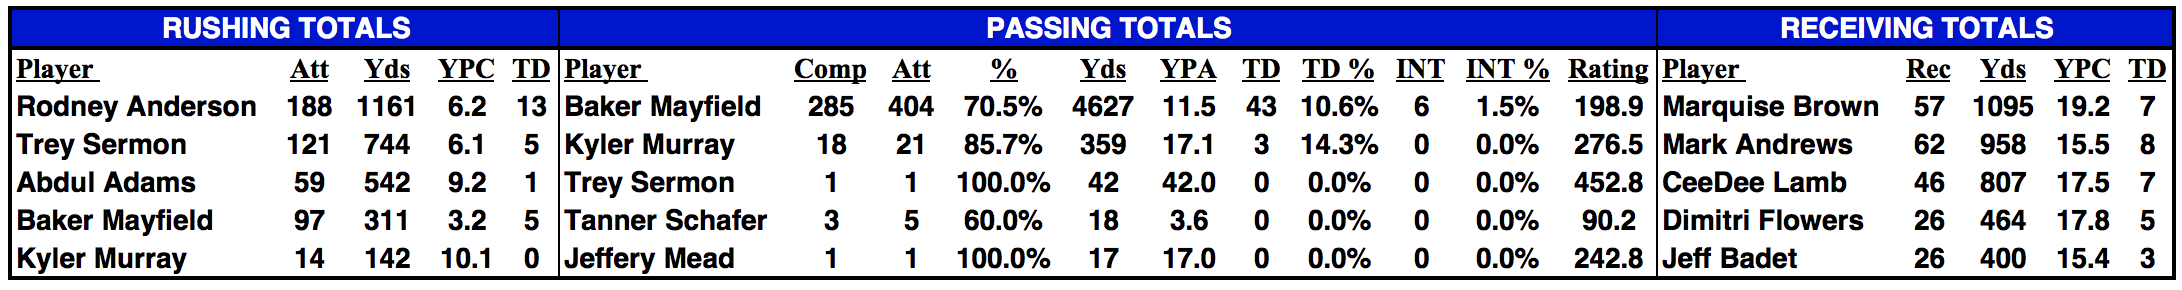
2023 STATISTICAL LEADERS |
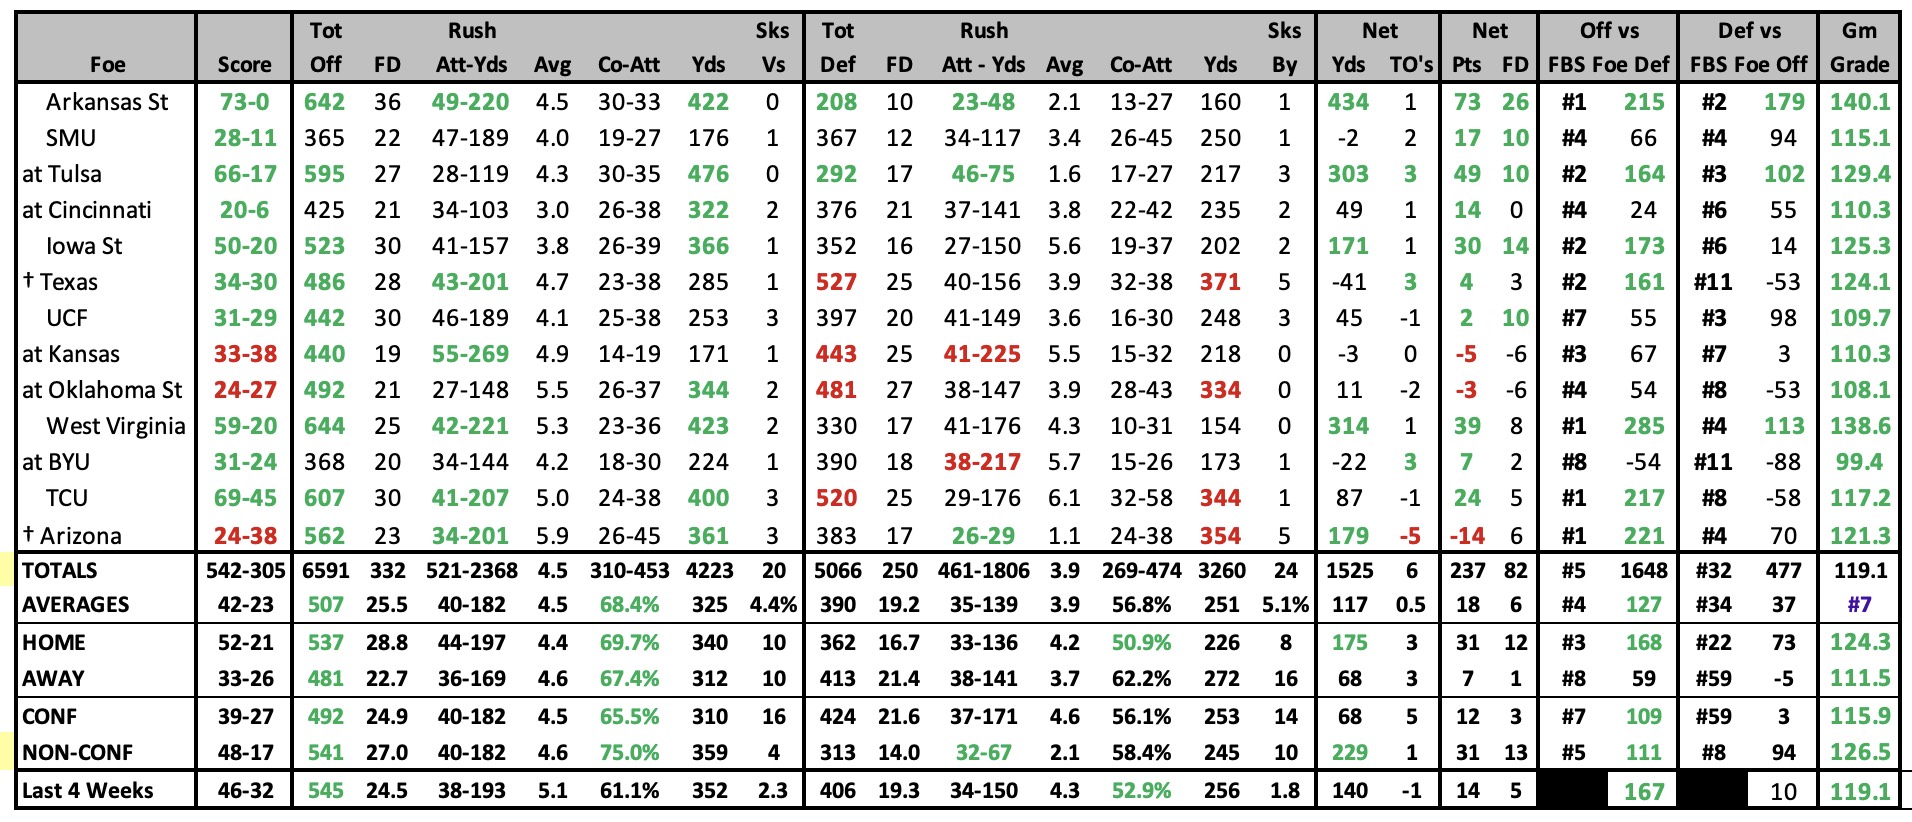
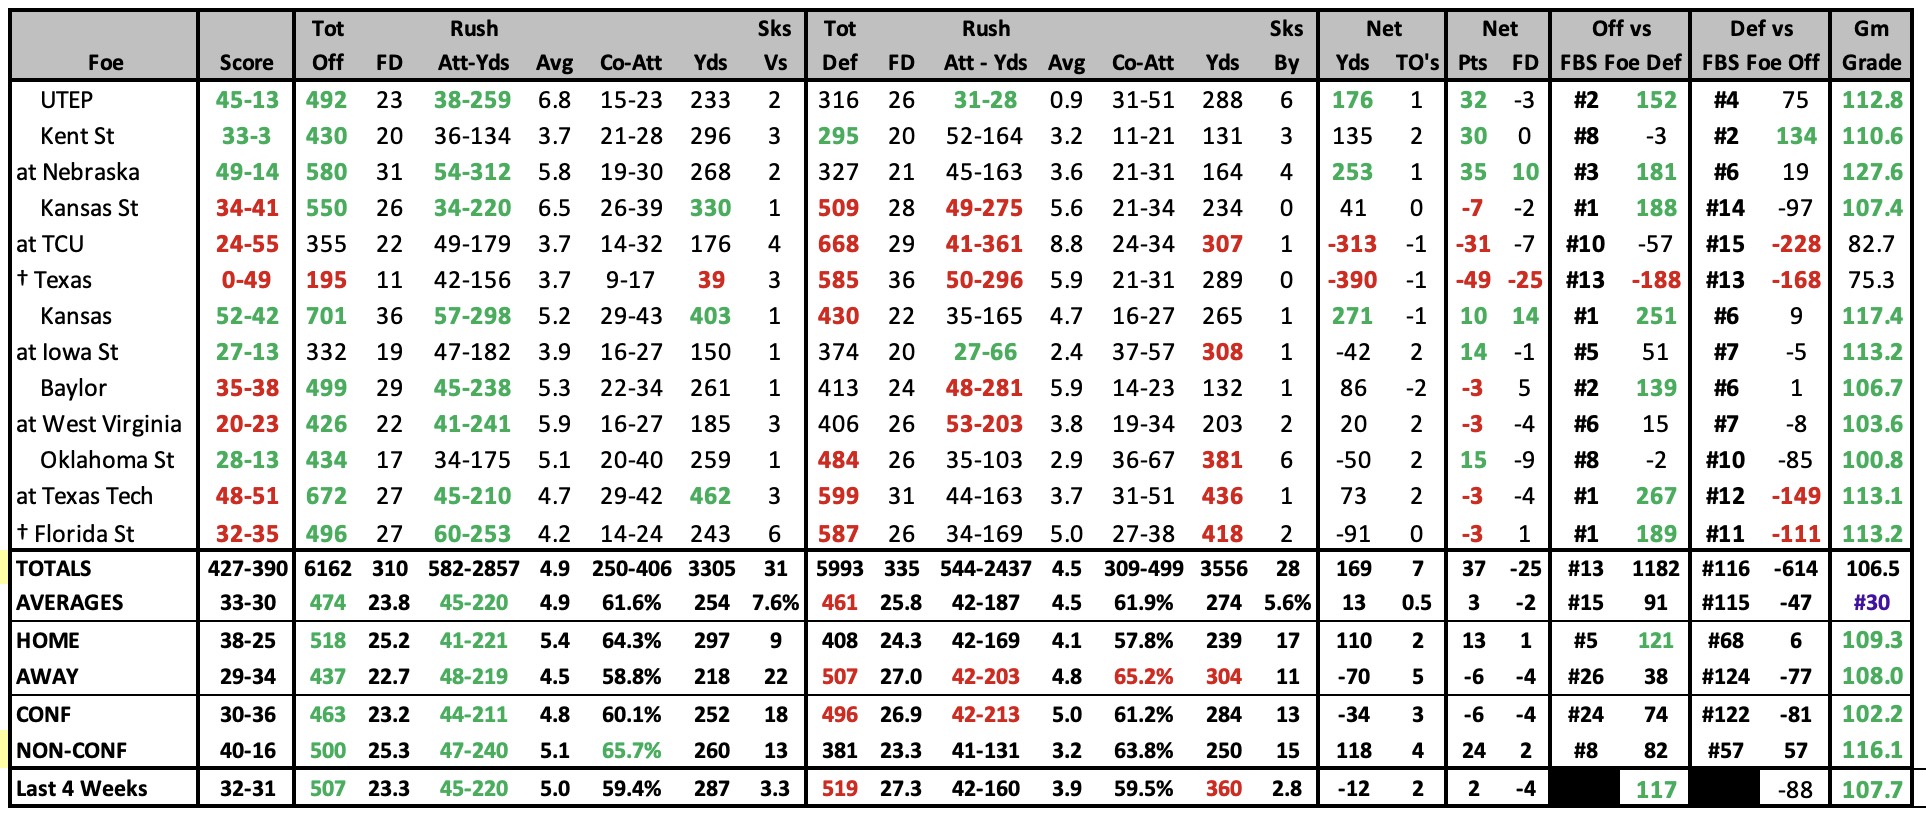
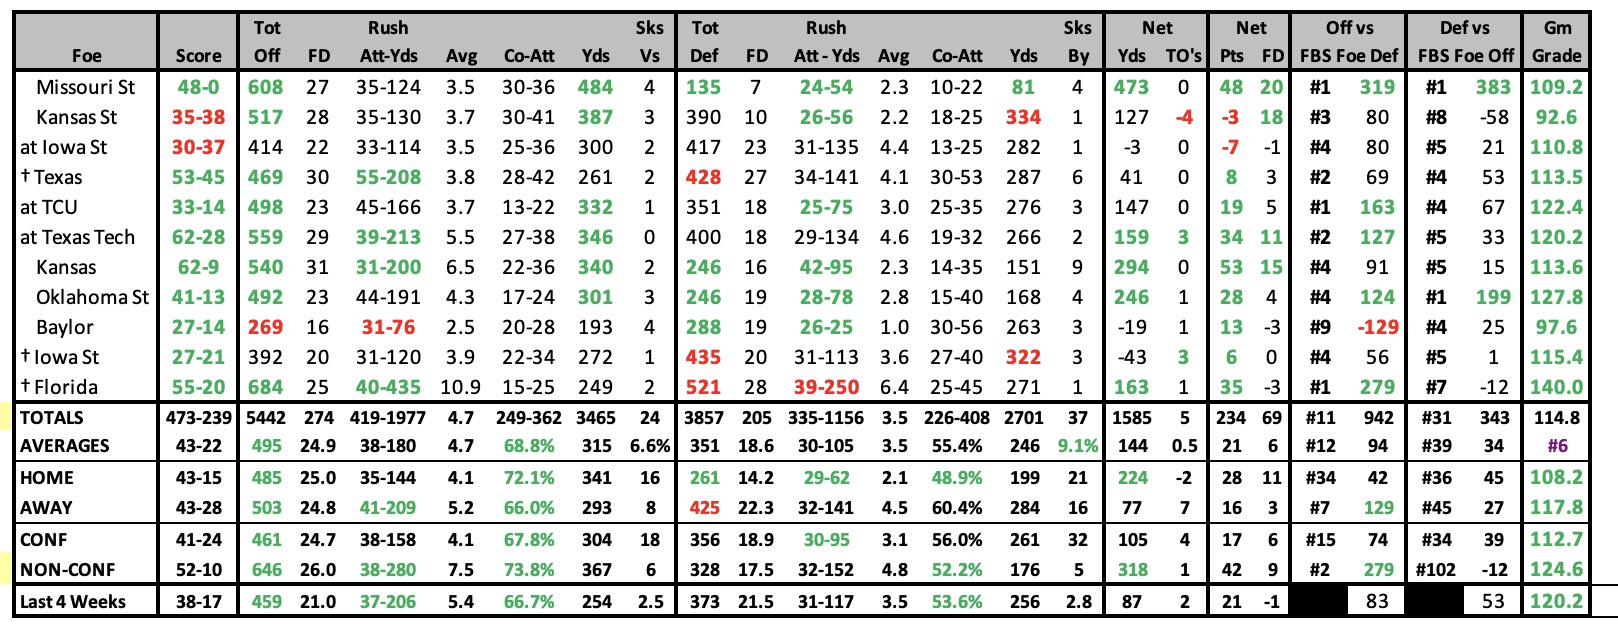
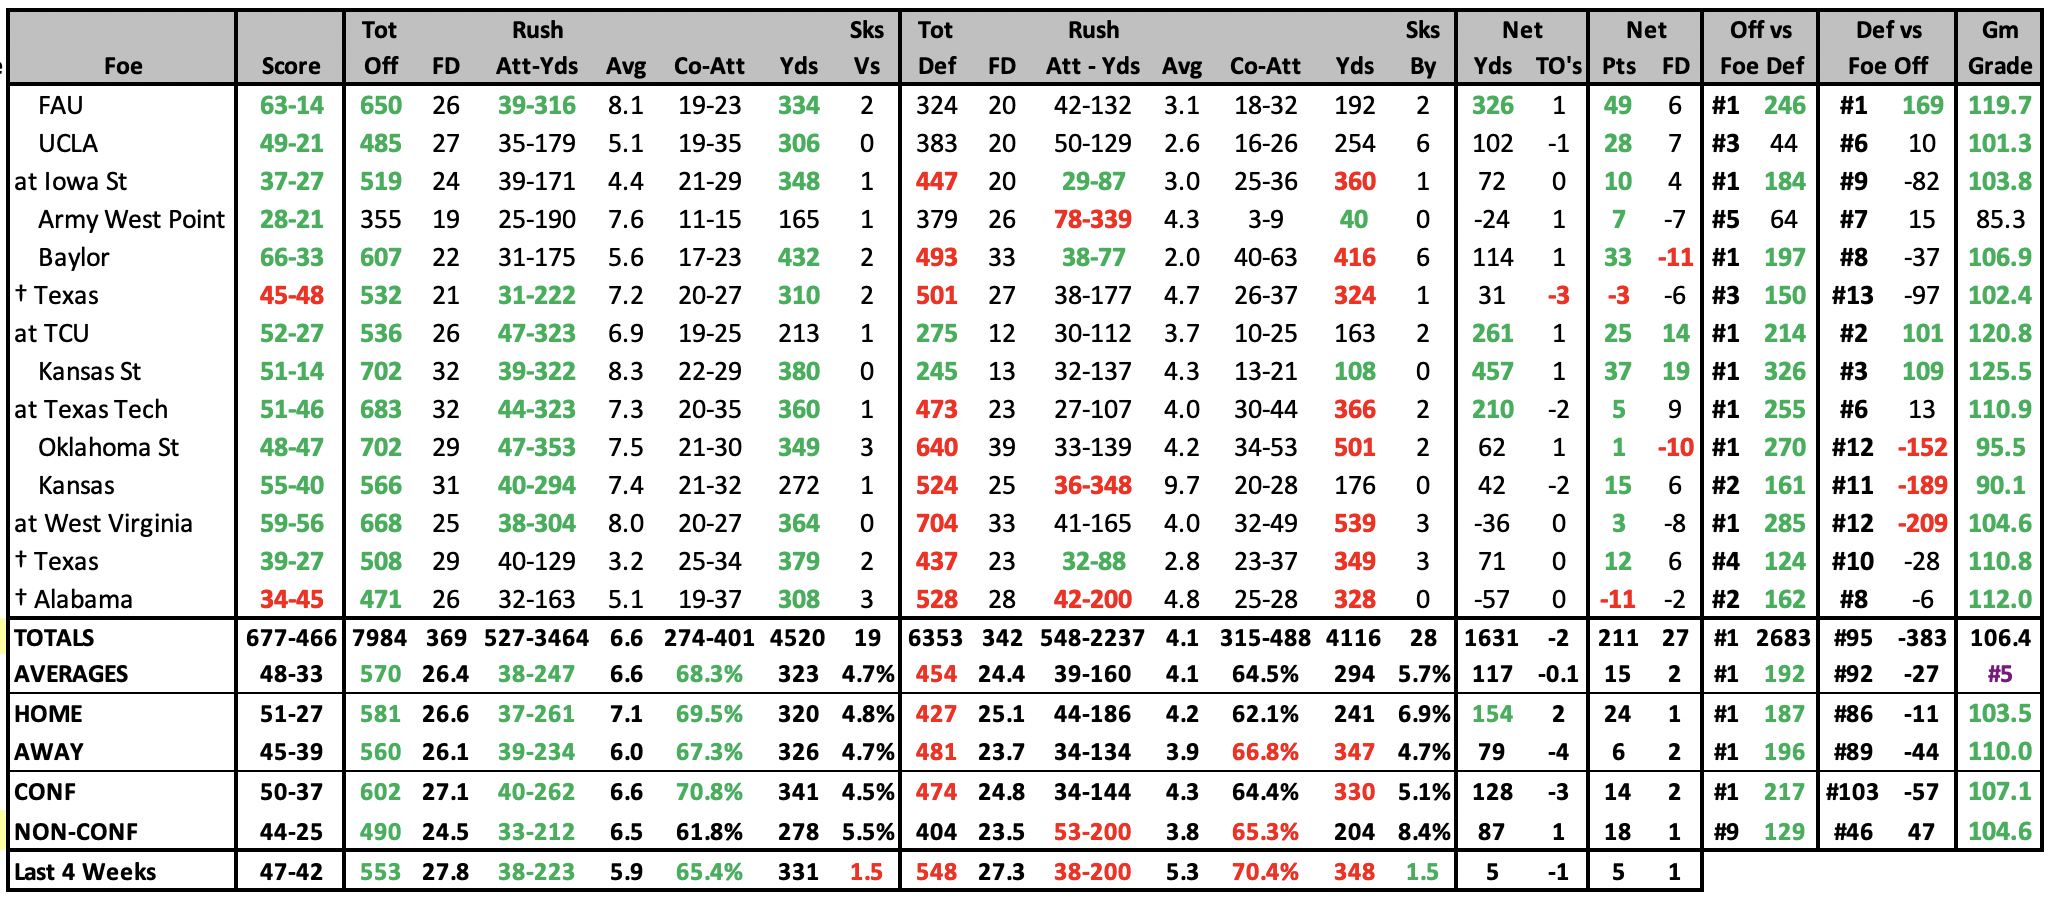
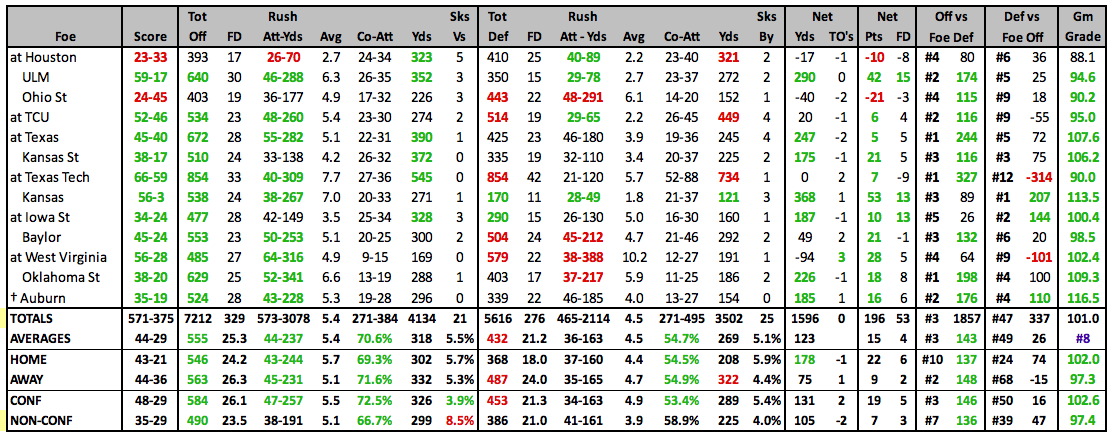
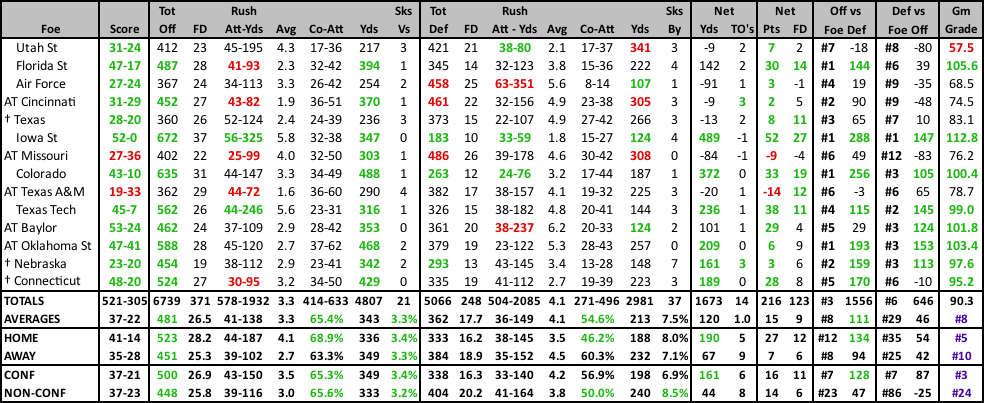
2023 GAME BY GAME STATS |
 |
2023 SCHEDULE |
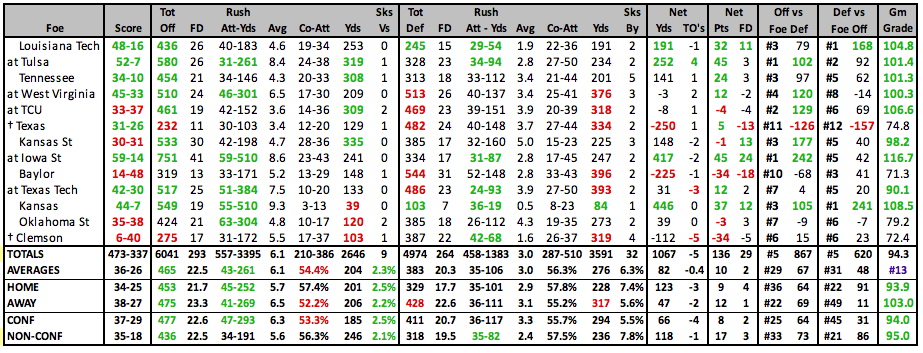
2022 RESULTS |
||||||||||||||||||||||||||||||||||||||||||||||||||||||||||||||||||||||||||||||||||||||||||||||||||||||||||||||||||||||||||||||||||||||||||||||||||||||||||||||||||||||||||||||||||||||||||||||||||||||
|
|
||||||||||||||||||||||||||||||||||||||||||||||||||||||||||||||||||||||||||||||||||||||||||||||||||||||||||||||||||||||||||||||||||||||||||||||||||||||||||||||||||||||||||||||||||||||||||||||||||||||
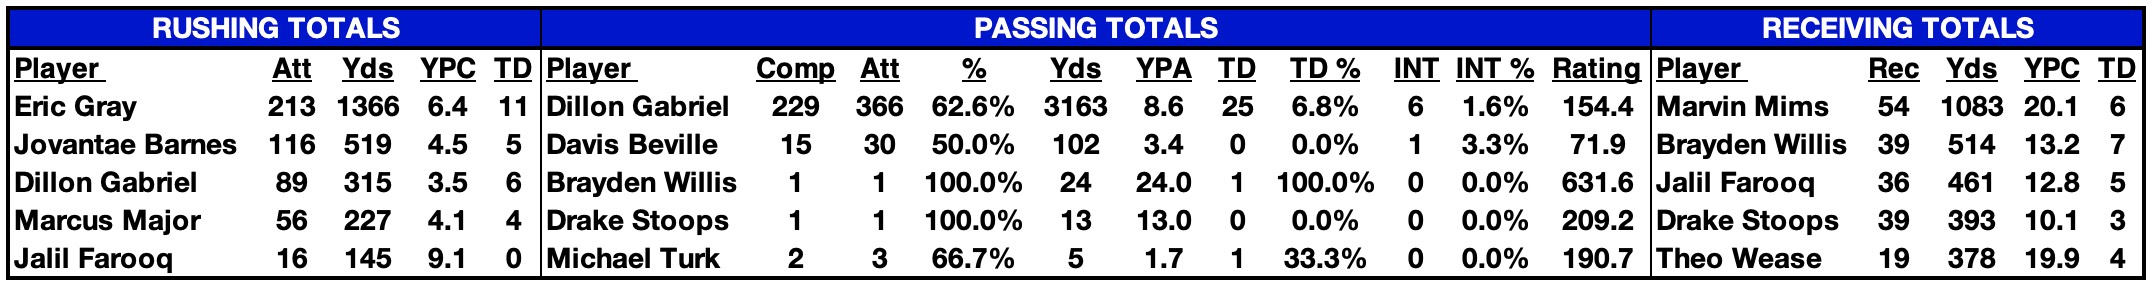
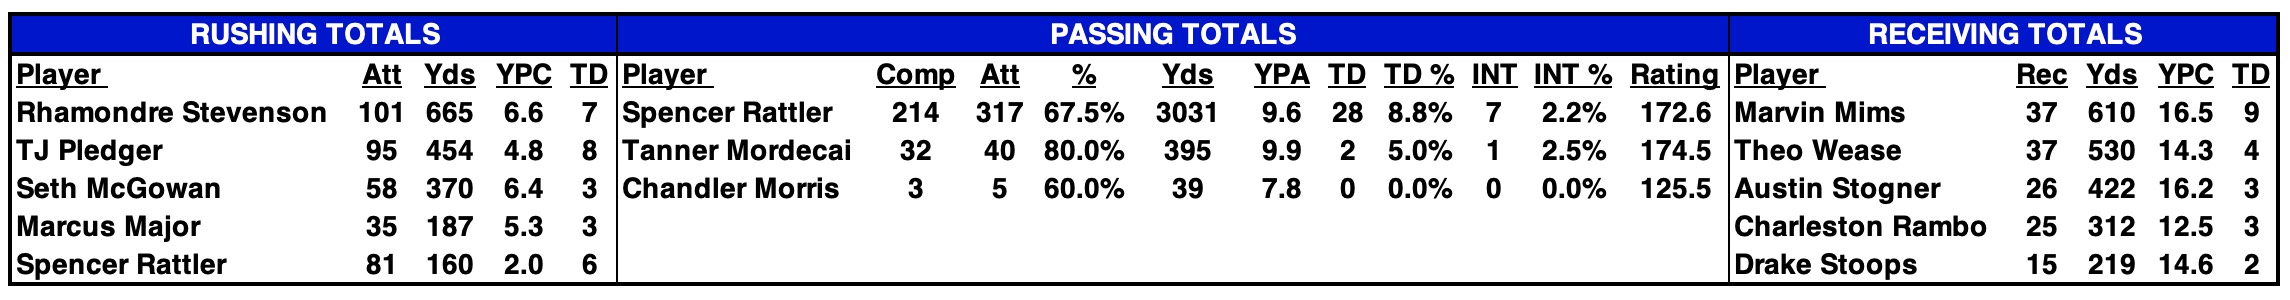
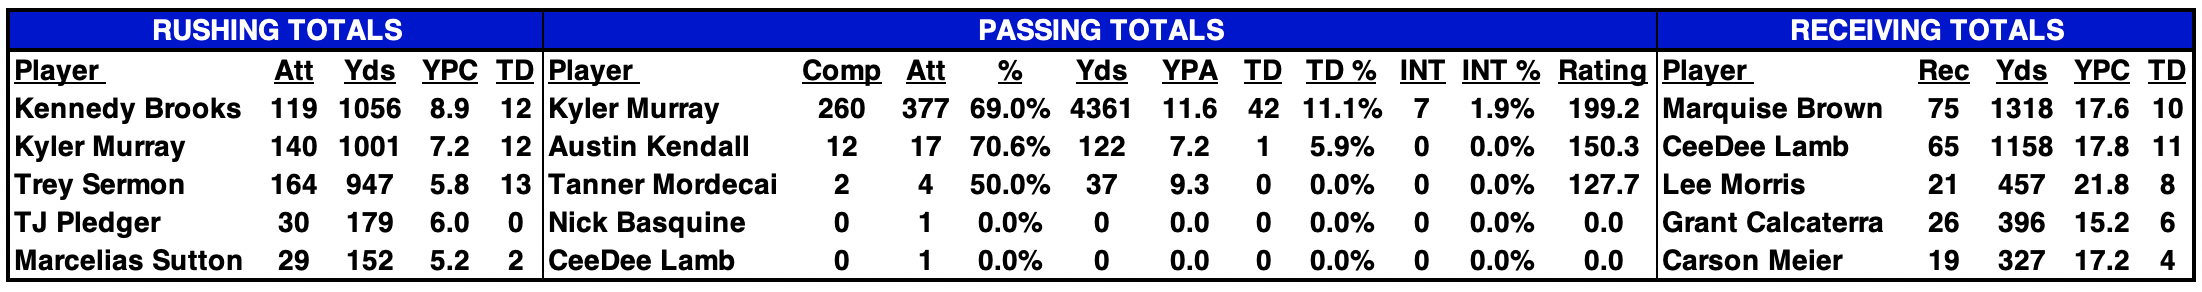
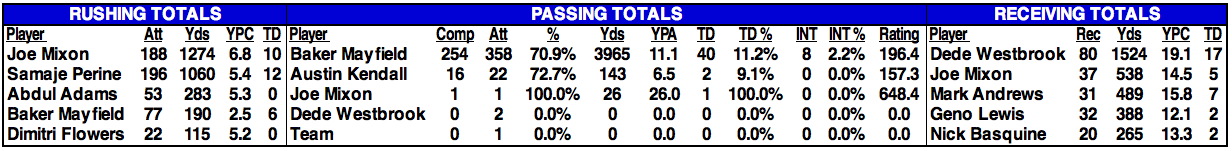
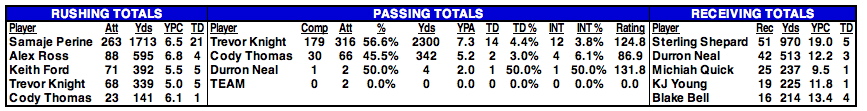
2022 STATISTICAL LEADERS |
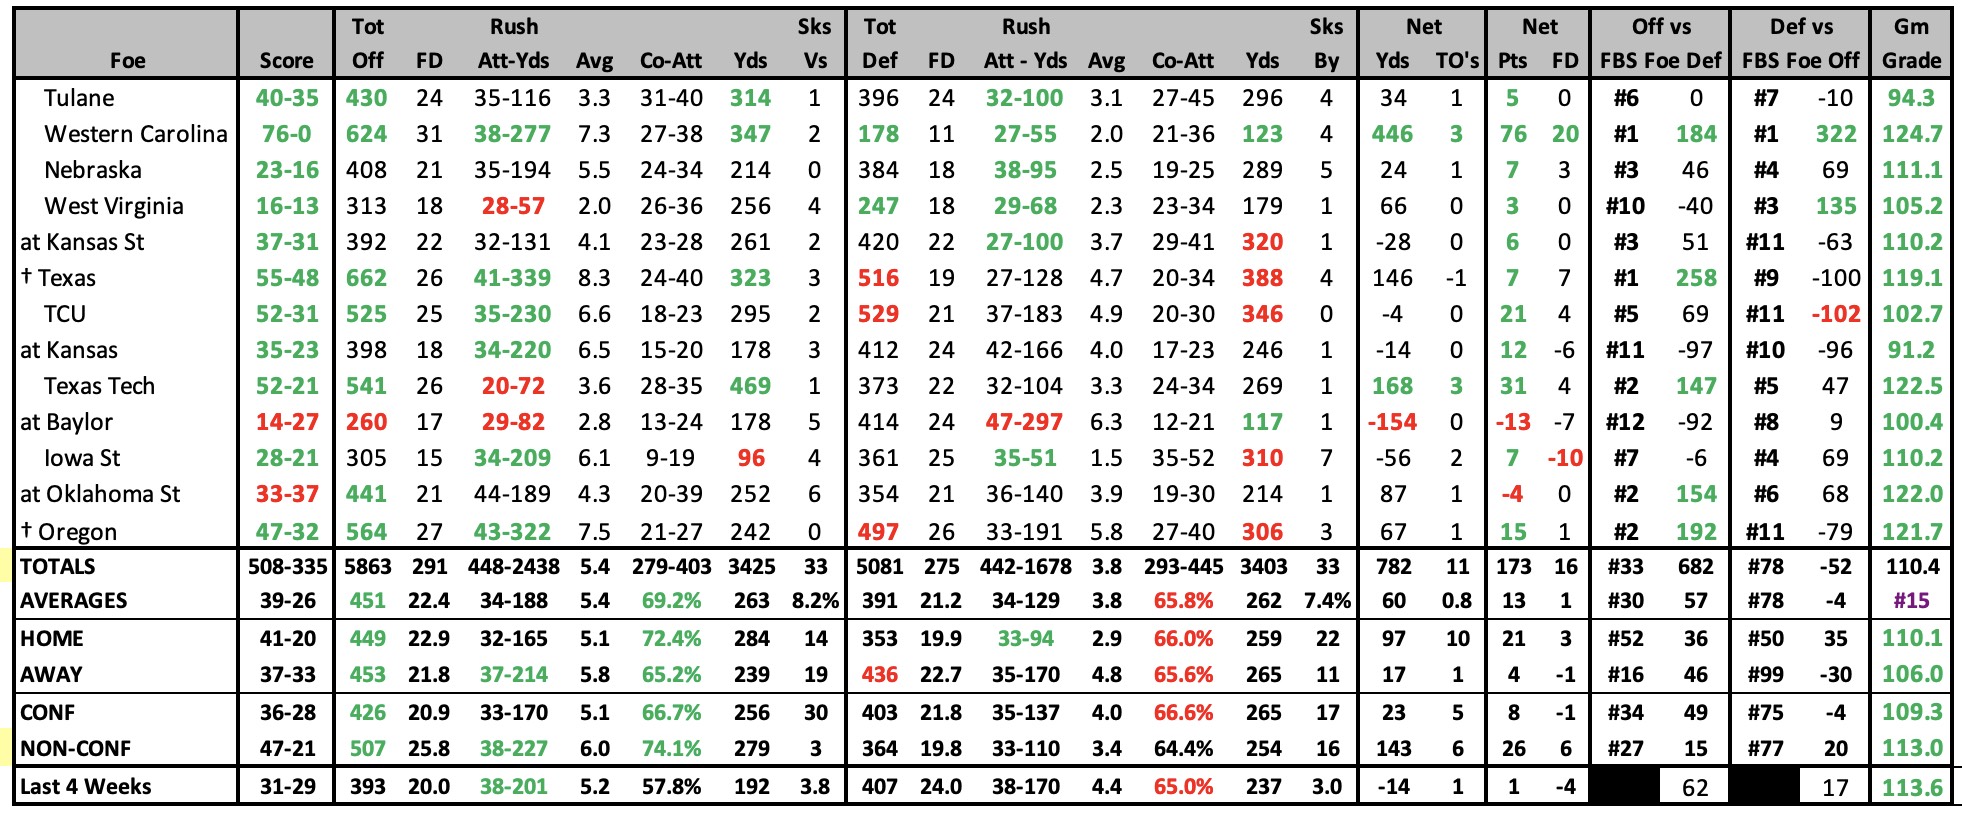
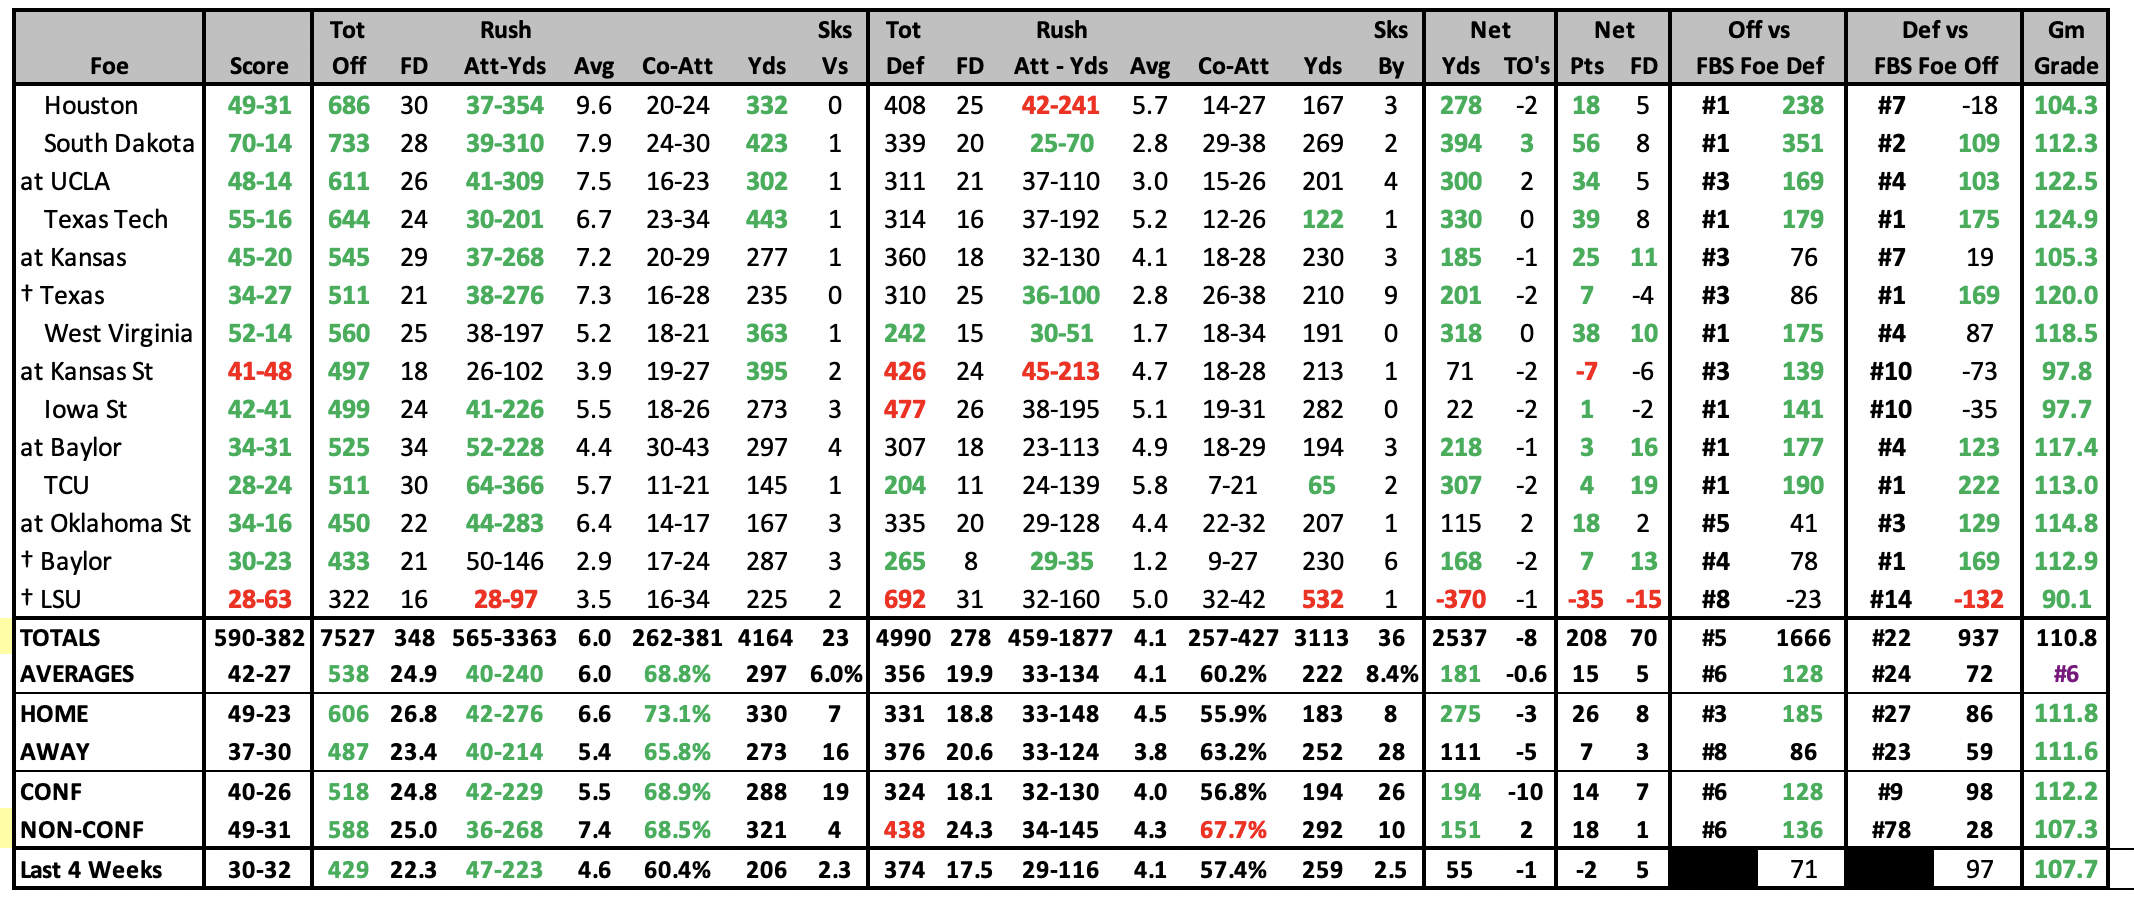
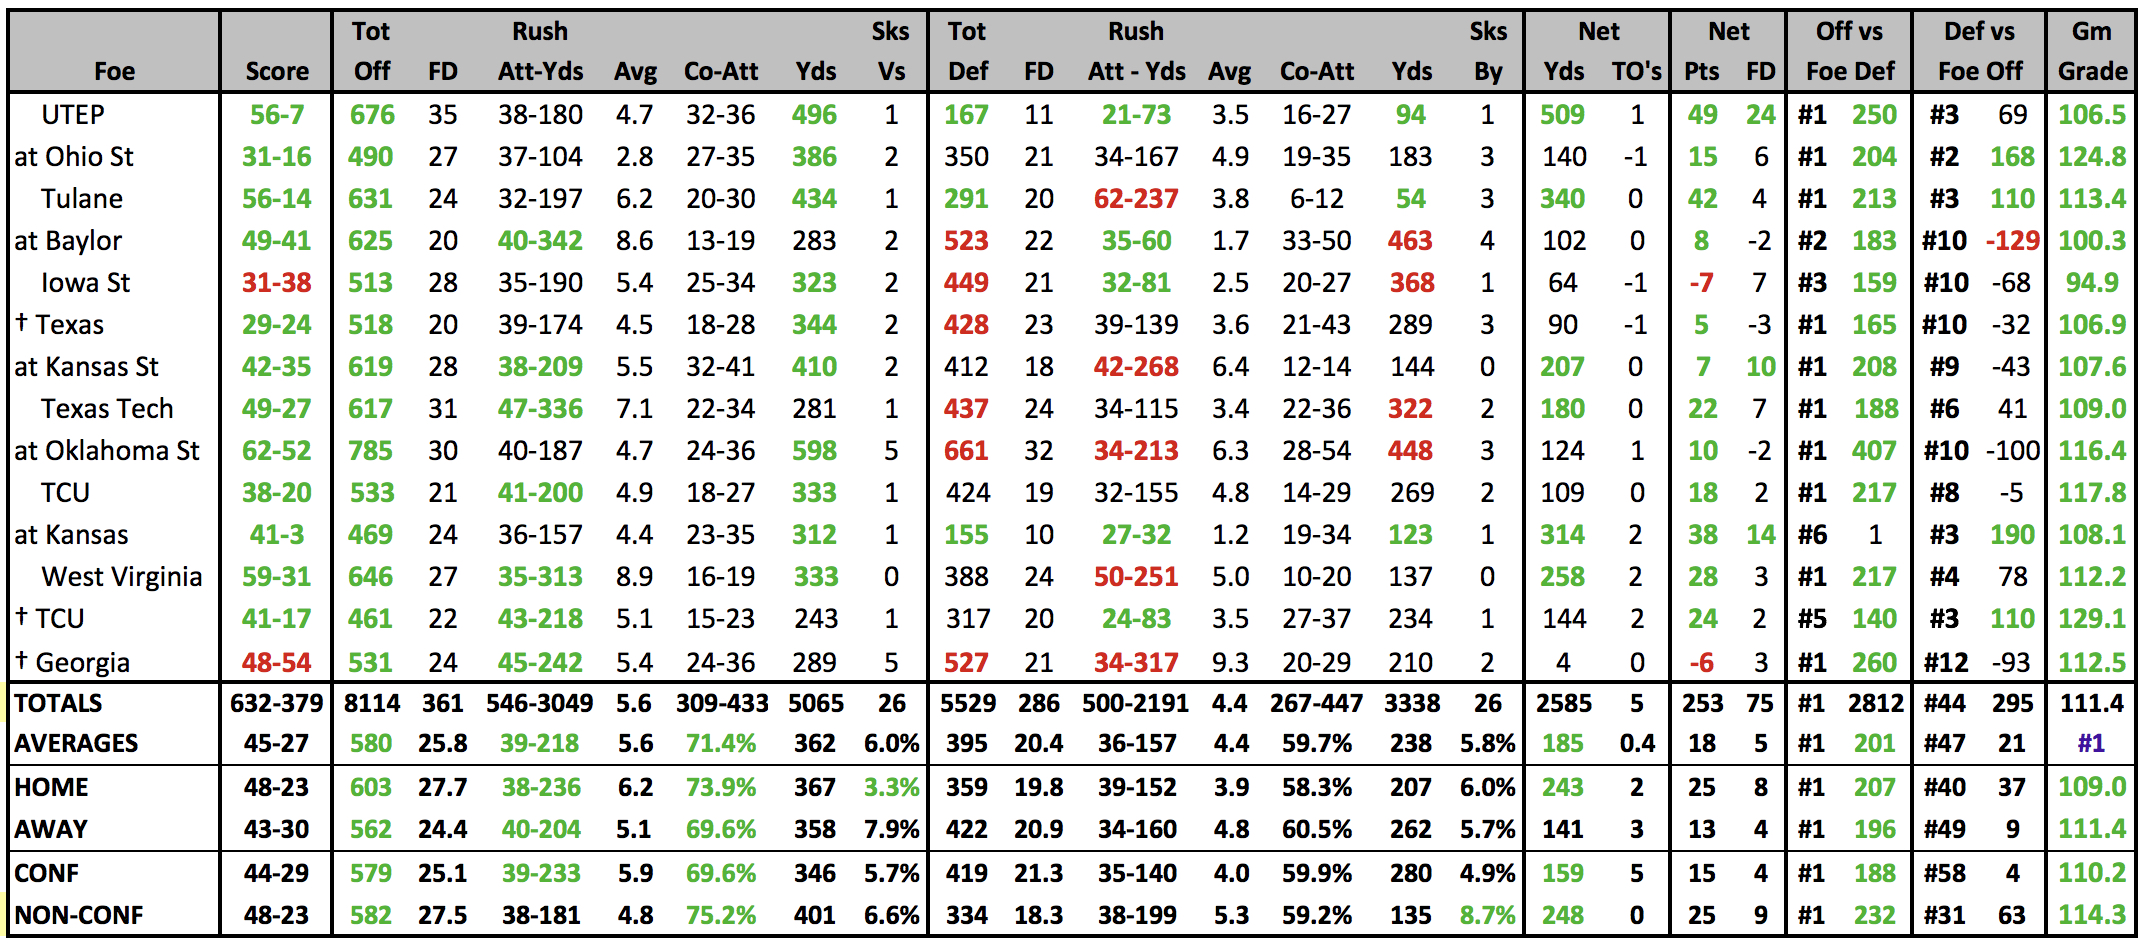
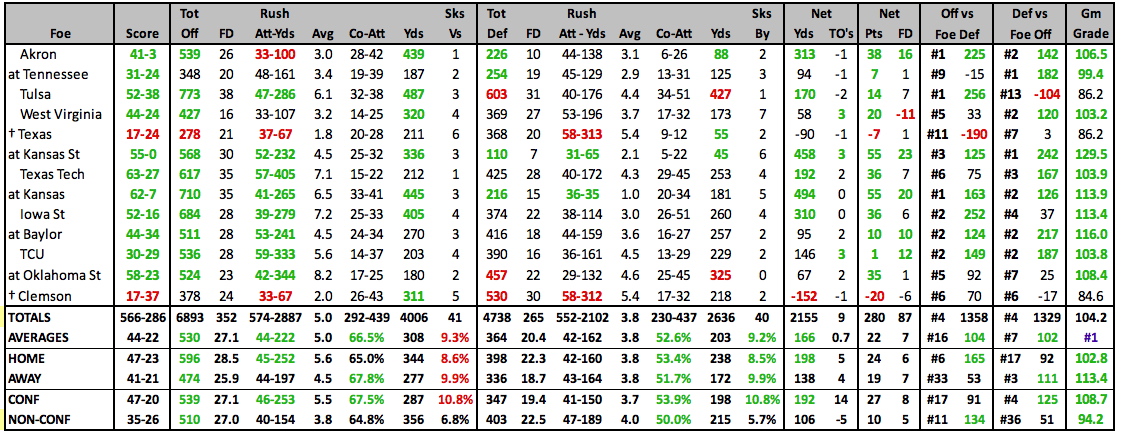
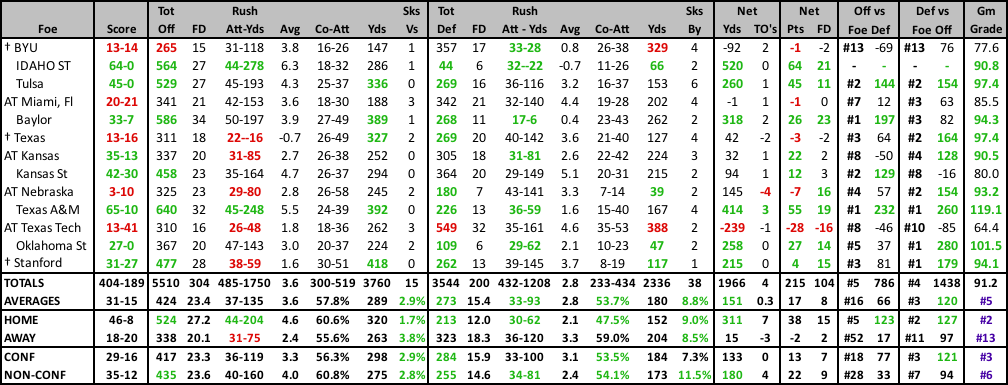
2022 GAME BY GAME STATS |
 |
2022 SCHEDULE |
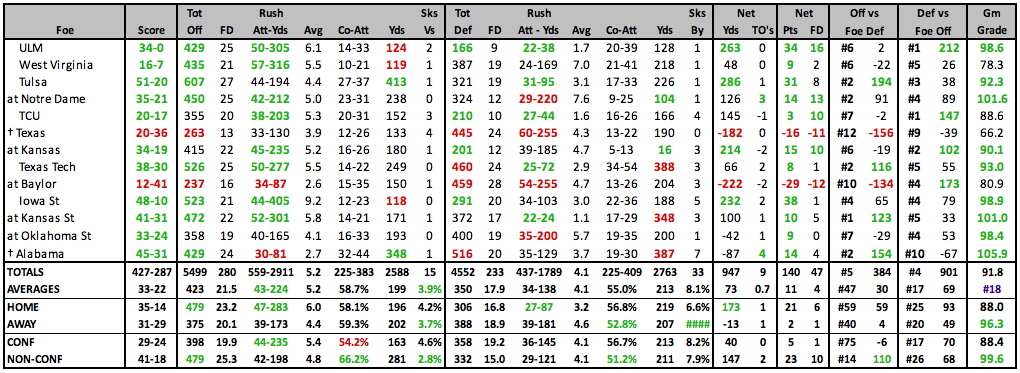
2021 RESULTS |
||||||||||||||||||||||||||||||||||||||||||||||||||||||||||||||||||||||||||||||||||||||||||||||||||||||||||||||||||||||||||||||||||||||||||||||||||||||||||||||||||||||||||||||||||||||||||||||||||||||
|
|
||||||||||||||||||||||||||||||||||||||||||||||||||||||||||||||||||||||||||||||||||||||||||||||||||||||||||||||||||||||||||||||||||||||||||||||||||||||||||||||||||||||||||||||||||||||||||||||||||||||
2021 STATISTICAL LEADERS |
2021 GAME BY GAME STATS |
 |
2021 SCHEDULE |
2020 RESULTS |
||||||||||||||||||||||||||||||||||||||||||||||||||||||||||||||||||||||||||||||||||||||||||||||||||||||||||||||||||||||||||||||||||||||||||||||||||||||||||||||||||||||||||||||||||||||||||||||||||||||||||||||||||
|
|
||||||||||||||||||||||||||||||||||||||||||||||||||||||||||||||||||||||||||||||||||||||||||||||||||||||||||||||||||||||||||||||||||||||||||||||||||||||||||||||||||||||||||||||||||||||||||||||||||||||||||||||||||
2020 STATISTICAL LEADERS |
2020 GAME BY GAME STATS |
 |
2020 SCHEDULE |
2019 RESULTS |
||||||||||||||||||||||||||||||||||||||||||||||||||||||||||||||||||||||||||||||||||||||||||||||||||||||||||||||||||||||||||||||||||||||||||||||||||||||||||||||||||||||||||||||||||||||||||||||||||||||||||||||||||||||||||||||||||||
|
|
||||||||||||||||||||||||||||||||||||||||||||||||||||||||||||||||||||||||||||||||||||||||||||||||||||||||||||||||||||||||||||||||||||||||||||||||||||||||||||||||||||||||||||||||||||||||||||||||||||||||||||||||||||||||||||||||||||
2019 STATISTICAL LEADERS |
2019 GAME BY GAME STATS |
 |
2019 SCHEDULE |
2018 RESULTS |
||||||||||||||||||||||||||||||||||||||||||||||||||||||||||||||||||||||||||||||||||||||||||||||||||||||||||||||||||||||||||||||||||||||||||||||||||||||||||||||||||||||||||||||||||||||||||||||||||||||||||||||||||||||||||||||||||||||||||||||||
|
|
||||||||||||||||||||||||||||||||||||||||||||||||||||||||||||||||||||||||||||||||||||||||||||||||||||||||||||||||||||||||||||||||||||||||||||||||||||||||||||||||||||||||||||||||||||||||||||||||||||||||||||||||||||||||||||||||||||||||||||||||
2018 STATISTICAL LEADERS |
2018 GAME BY GAME STATS |
 |
2018 SCHEDULE |
2017 RESULTS |
||||||||||||||||||||||||||||||||||||||||||||||||||||||||||||||||||||||||||||||||||||||||||||||||||||||||||||||||||||||||||||||||||||||||||||||||||||||||||||||||||||||||||||||||||||||||||||||||||||||||||||||||||||||||||||||||||||||||||||||||||||||||||||
|
|
||||||||||||||||||||||||||||||||||||||||||||||||||||||||||||||||||||||||||||||||||||||||||||||||||||||||||||||||||||||||||||||||||||||||||||||||||||||||||||||||||||||||||||||||||||||||||||||||||||||||||||||||||||||||||||||||||||||||||||||||||||||||||||
2017 STATISTICAL LEADERS |
2017 GAME BY GAME STATS |
 |
2017 SCHEDULE |
2016 RESULTS |
|||||||||||||||||||||||||||||||||||||||||||||||||||||||||||||||||||||||||||||||||||||||||||||||||||||||||||||||||||||||||||||||||||||||||||||||||||||||||||||||||||||||||||||||||||||||||||||||||||||||||||||||||||||||||||||||||||||||||||||||||||||
|
|
|||||||||||||||||||||||||||||||||||||||||||||||||||||||||||||||||||||||||||||||||||||||||||||||||||||||||||||||||||||||||||||||||||||||||||||||||||||||||||||||||||||||||||||||||||||||||||||||||||||||||||||||||||||||||||||||||||||||||||||||||||||
2016 STATISTICAL LEADERS |
2016 GAME BY GAME STATS |
 |
2015 STATISTICAL LEADERS |
2015 GAME BY GAME STATS |
 |
2015 SCHEDULE |
2014 RESULTS |
||||||||||||||||||||||||||||||||||||||||||||||||||||||||||||||||||||||||||||||||||||||||||||||||||||||||||||||||||||||||||||||||||||||||||||||||||||||||||||||||||||||||||||||||||||||||||||||||||||||||||||||||||||||||||||||||||||||||||||||||||||||||||||||||||||
|
|
||||||||||||||||||||||||||||||||||||||||||||||||||||||||||||||||||||||||||||||||||||||||||||||||||||||||||||||||||||||||||||||||||||||||||||||||||||||||||||||||||||||||||||||||||||||||||||||||||||||||||||||||||||||||||||||||||||||||||||||||||||||||||||||||||||
2014 STATISTICAL LEADERS |
2014 GAME BY GAME STATS |
 |
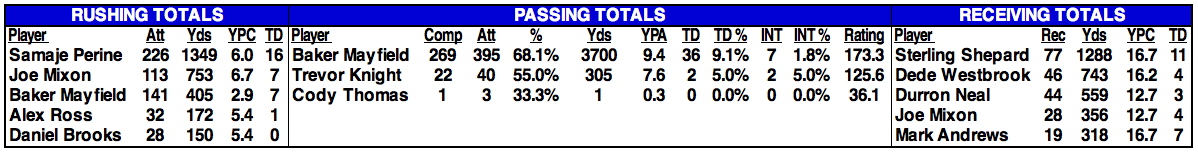
2013 STATISTICAL LEADERS |
| Player | Att | Yds | YPC | TD | Player | Comp | Att | % | Yds | YPA | TD | INT | Rating | Player | Rec | Yds | YPC | TD |
| Brennan Clay | 164 | 915 | 5.6 | 6 | Blake Bell | 140 | 233 | 60.1% | 1648 | 7.1 | 12 | 5 | 132.2 | Jalen Saunders | 61 | 729 | 12.0 | 8 |
| Damien Williams | 114 | 553 | 4.9 | 7 | Trevor Knight | 79 | 134 | 59.0% | 819 | 6.1 | 9 | 5 | 125.0 | Sterling Shepard | 51 | 603 | 11.8 | 7 |
| Trevor Knight | 67 | 445 | 6.6 | 2 | Kendall Thompson | 4 | 13 | 30.8% | 64 | 4.9 | 1 | 1 | 82.1 | LaColtan Bester | 27 | 392 | 14.5 | 2 |
2013 GAME BY GAME STATS |
 |
2013 RESULTS |
2012 RESULTS |
|||||||||||||||||||||||||||||||||||||||||||||||||||||||||||||||||||||||||||||||||||||||||||||||||||||||||||||||||||||||||||||||||||||||||||||||||||||||||||||||||||||||||||||||||||||||||||||||||||||||||||||||||||||||||||||||||||||||||||||||||||||||||||||||||||||||||||||||||||||||
|
|
|||||||||||||||||||||||||||||||||||||||||||||||||||||||||||||||||||||||||||||||||||||||||||||||||||||||||||||||||||||||||||||||||||||||||||||||||||||||||||||||||||||||||||||||||||||||||||||||||||||||||||||||||||||||||||||||||||||||||||||||||||||||||||||||||||||||||||||||||||||||
2012 STATISTICAL LEADERS |
| Player | Att | Yds | YPC | TD | Player | Comp | Att | % | Yds | YPA | TD | INT | Rating | Player | Rec | Yds | YPC | TD | ||
| Damien Williams | 172 | 936 | 5.4 | 11 | Landry Jones | 366 | 555 | 65.9% | 4268 | 7.7 | 30 | 11 | 144.4 | Kenny Stills | 82 | 959 | 11.7 | 11 | ||
| Brennan Clay | 93 | 552 | 5.9 | 6 | Blake Bell | 9 | 16 | 56.3% | 107 | 6.7 | 0 | 0 | 112.4 | Justin Brown | 73 | 881 | 12.1 | 5 | ||
| Dom Whaley | 39 | 242 | 6.2 | 1 | Jalen Saunders | 61 | 812 | 13.3 | 3 |
| 2012 INDIVIDUAL PLAYER STATS • 2012 START CHART/ STARTERS LOST |
|---|
2012 GAME BY GAME STATS |
 |
2011 STATISTICAL LEADERS |
| Player | Att | Yds | YPC | TD | Player | Comp | Att | % | Yds | YPA | TD | INT | Rating | Player | Rec | Yds | YPC | TD | ||
| Dom Whaley | 113 | 628 | 5.6 | 9 | Landry Jones | 355 | 562 | 63.2% | 4453 | 7.9 | 29 | 15 | 141.4 | Ryan Broyles | 83 | 1151 | 13.9 | 10 | ||
| Roy Finch | 111 | 603 | 5.4 | 3 | Drew Allen | 10 | 18 | 55.6% | 79 | 4.4 | 0 | 0 | 92.4 | Kenny Stills | 61 | 850 | 13.9 | 8 | ||
| Brennan Clay | 75 | 275 | 3.7 | 1 | Blake Bell | 0 | 2 | 0.0% | 0 | 0.0 | 0 | 1 | -100.0 | Jaz Reynolds | 41 | 714 | 17.4 | 5 |
| 2011 Individual Player Stats • 2011 START CHARTS/STARTERS LOST |
|---|
2011 GAME BY GAME STATS |
2011 RESULTS |
2010 RESULTS |
||||||||||||||||||||||||||||||||||||||||||||||||||||||||||||||||||||||||||||||||||||||||||||||||||||||||||||||||||||||||||||||||||||||||||||||||||||||||||||||||||||||||||||||||||||||||||||||||||||||||||
|
|
||||||||||||||||||||||||||||||||||||||||||||||||||||||||||||||||||||||||||||||||||||||||||||||||||||||||||||||||||||||||||||||||||||||||||||||||||||||||||||||||||||||||||||||||||||||||||||||||||||||||||
2010 STATISTICAL LEADERS |
| Player | Att | Yds | YPC | TD | Player | Comp | Att | % | Yds | YPA | TD | INT | Rating | Player | Rec | Yds | YPC | TD | ||
| DeMarco Murray | 284 | 1226 | 4.3 | 15 | Landry Jones | 405 | 617 | 65.6% | 4699 | 7.6 | 38 | 12 | 146.0 | Ryan Broyles | 131 | 1618 | 12.4 | 14 | ||
| Roy Finch | 86 | 405 | 4.7 | 2 | Drew Allen | 9 | 14 | 64.3% | 91 | 6.5 | 0 | 0 | 118.9 | Kenny Stills | 61 | 784 | 12.9 | 5 | ||
| Mossis Madu | 59 | 250 | 4.2 | 1 | John Nimmo | 0 | 2 | 0.0% | 0 | 0.0 | 0 | 0 | 0.0 | DeMarco Murray | 70 | 581 | 8.3 | 5 |
| 2010 Individual Player Stats |
|---|
2010 GAME BY GAME STATS |
2009 STATISTICAL LEADERS |
| Player | Att | Yds | YPC | TD | Player | Comp | Att | % | Yds | YPA | TD | INT | Rating | Player | Rec | Yds | YPC | TD | ||
| Chris Brown | 170 | 703 | 4.14 | 7 | Landry Jones | 213 | 368 | 57.9% | 2592 | 7.0 | 22 | 13 | 129.7 | Ryan Broyles | 76 | 964 | 12.7 | 12 | ||
| DeMarco Murray | 151 | 678 | 4.49 | 7 | Sam Bradford | 39 | 69 | 56.5% | 562 | 8.1 | 2 | 0 | 134.5 | DeMarco Murray | 38 | 482 | 12.7 | 4 | ||
| Jeremy Calhoun | 45 | 220 | 4.89 | 1 | Austin Box | 18 | 30 | 60.0% | 188 | 6.3 | 1 | 0 | 123.6 | Brandon Caleb | 26 | 408 | 15.7 | 2 |
| 2009 Individual Player Stats |
|---|
2009 GAME BY GAME STATS |
2009 RESULTS |
2008 RESULTS |
||||||||||||||||||||||||||||||||||||||||||||||||||||||||||||||||||||||||||||||||||||||||||||||||||||||||||||||||||||||||||||||||||||||||||||||||||||||||||||||||
|
|
||||||||||||||||||||||||||||||||||||||||||||||||||||||||||||||||||||||||||||||||||||||||||||||||||||||||||||||||||||||||||||||||||||||||||||||||||||||||||||||||
| 2008 Individual Player Stats • 2007 Individual Player Stats |
|---|