
TEXAS TECH RED RAIDERS |
|
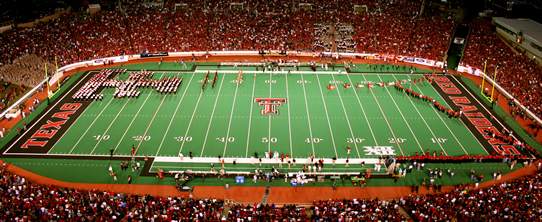
STADIUM: Jones AT&T PLAYING SURFACE: FieldTurf • 60,454 STARTERS RETURNING (O/D): 10*/11 LETTERMAN RETURNING: 36 (12,22,2) • LETTERMAN LOST: 33 (16,14,3) |
 |
|
| LOCATION: Lubbock, TX | |
| FOUNDED: 1923 | |
| ENROLLMENT: 33,749 | |
| COLORS: Scarlet & Black | |
| MASCOT: The Masked Rider, Raider Red |
|
| CONFERENCE: Big 12 | |
| HEAD COACH: Joey McGuire |
|
| YEARS WITH TM: 4th | |
| OVERALL RECORD: 23-16 | |
| RECORD WITH TM: 23-16 |
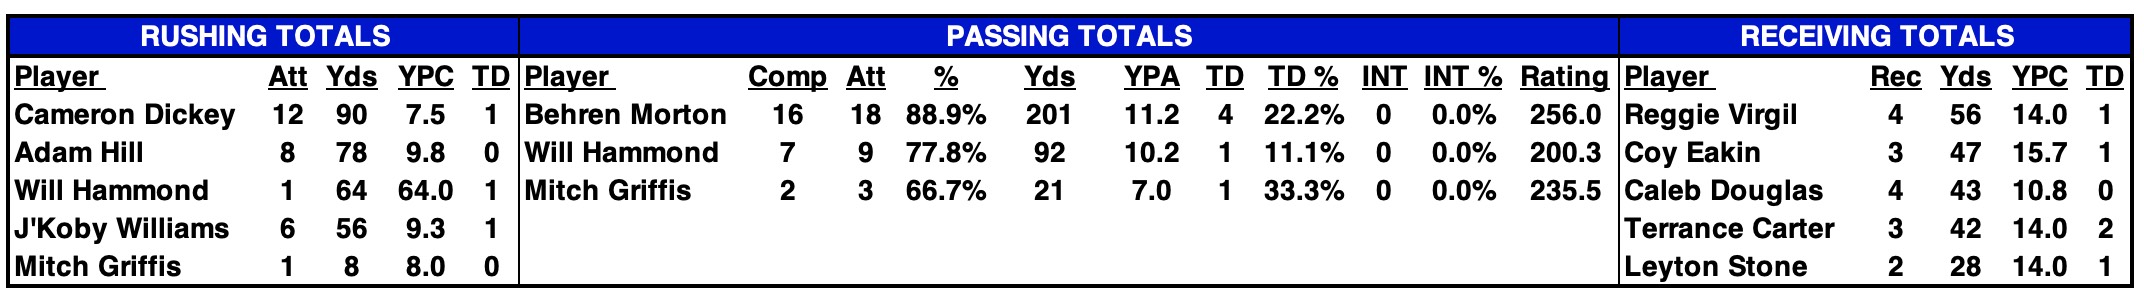
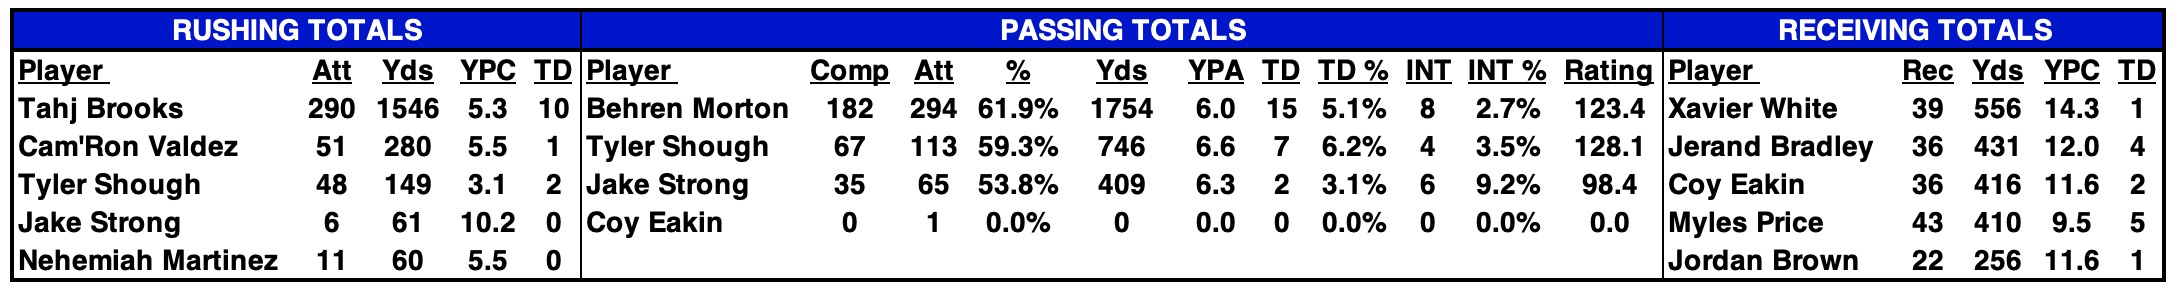
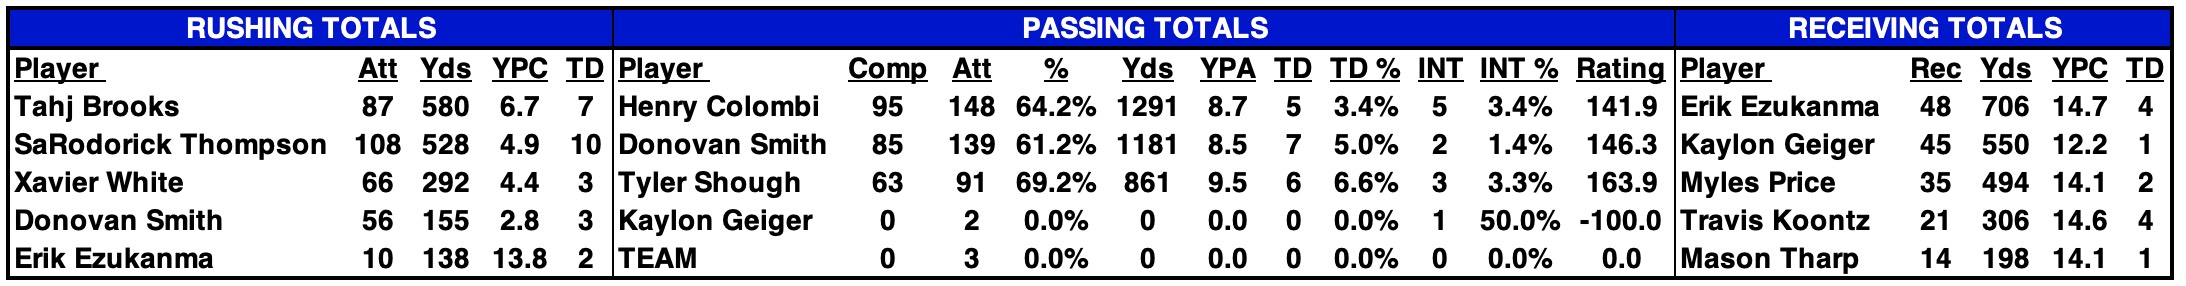
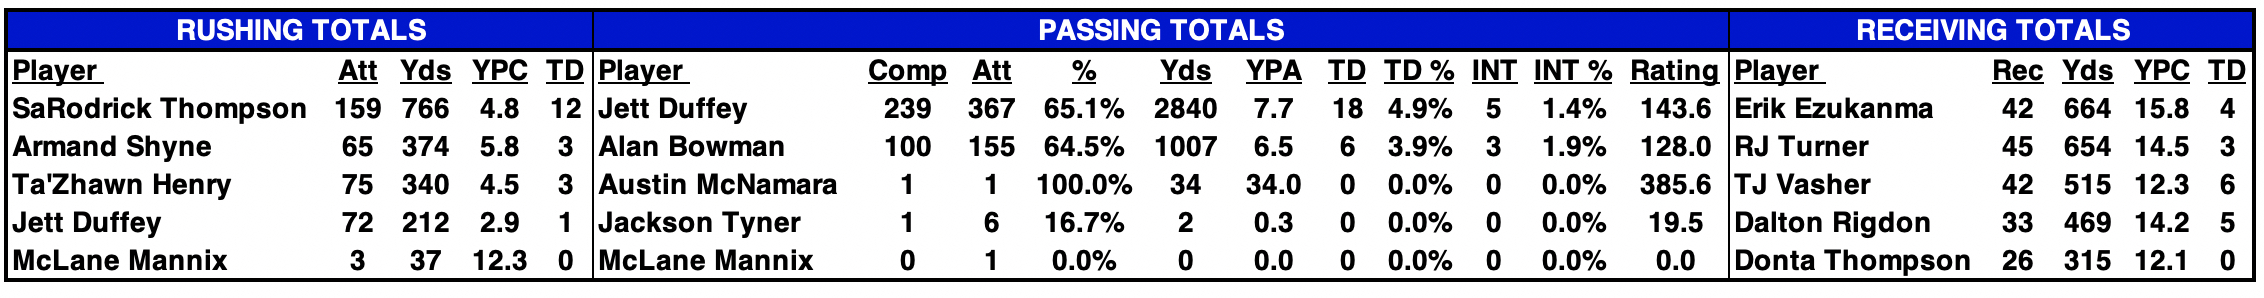
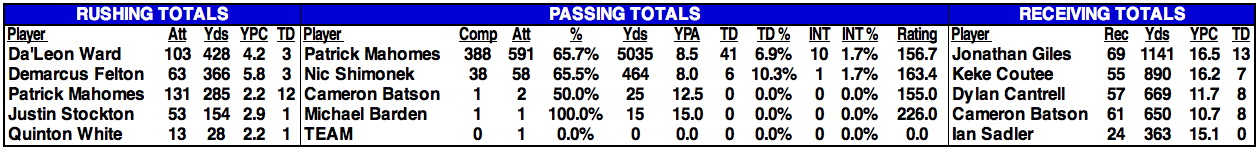
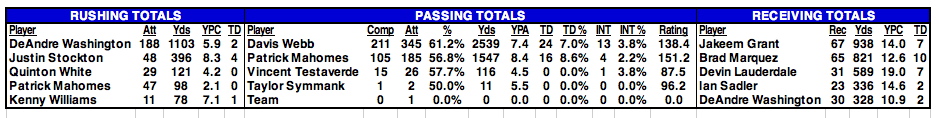
2025 STATISTICAL LEADERS |
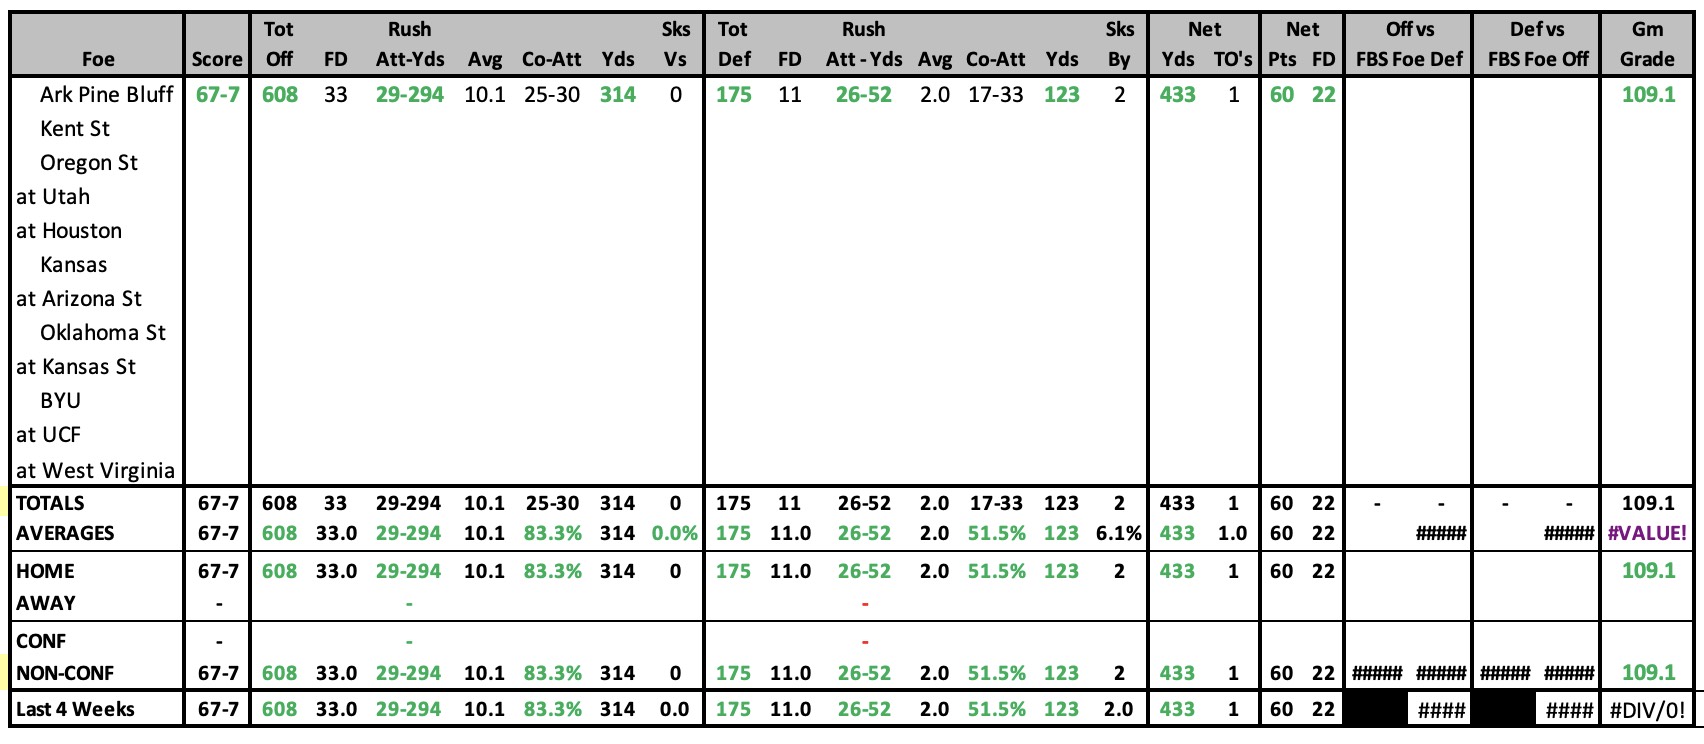
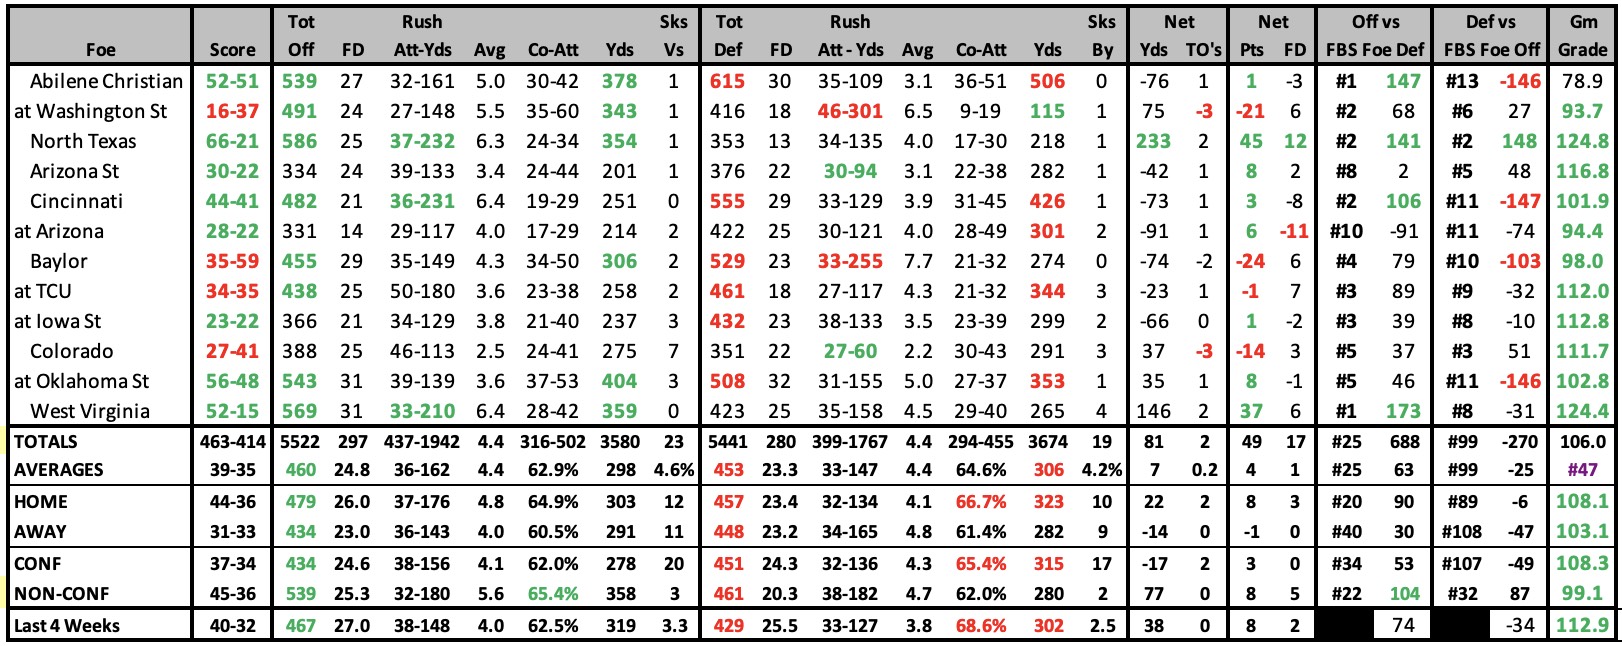
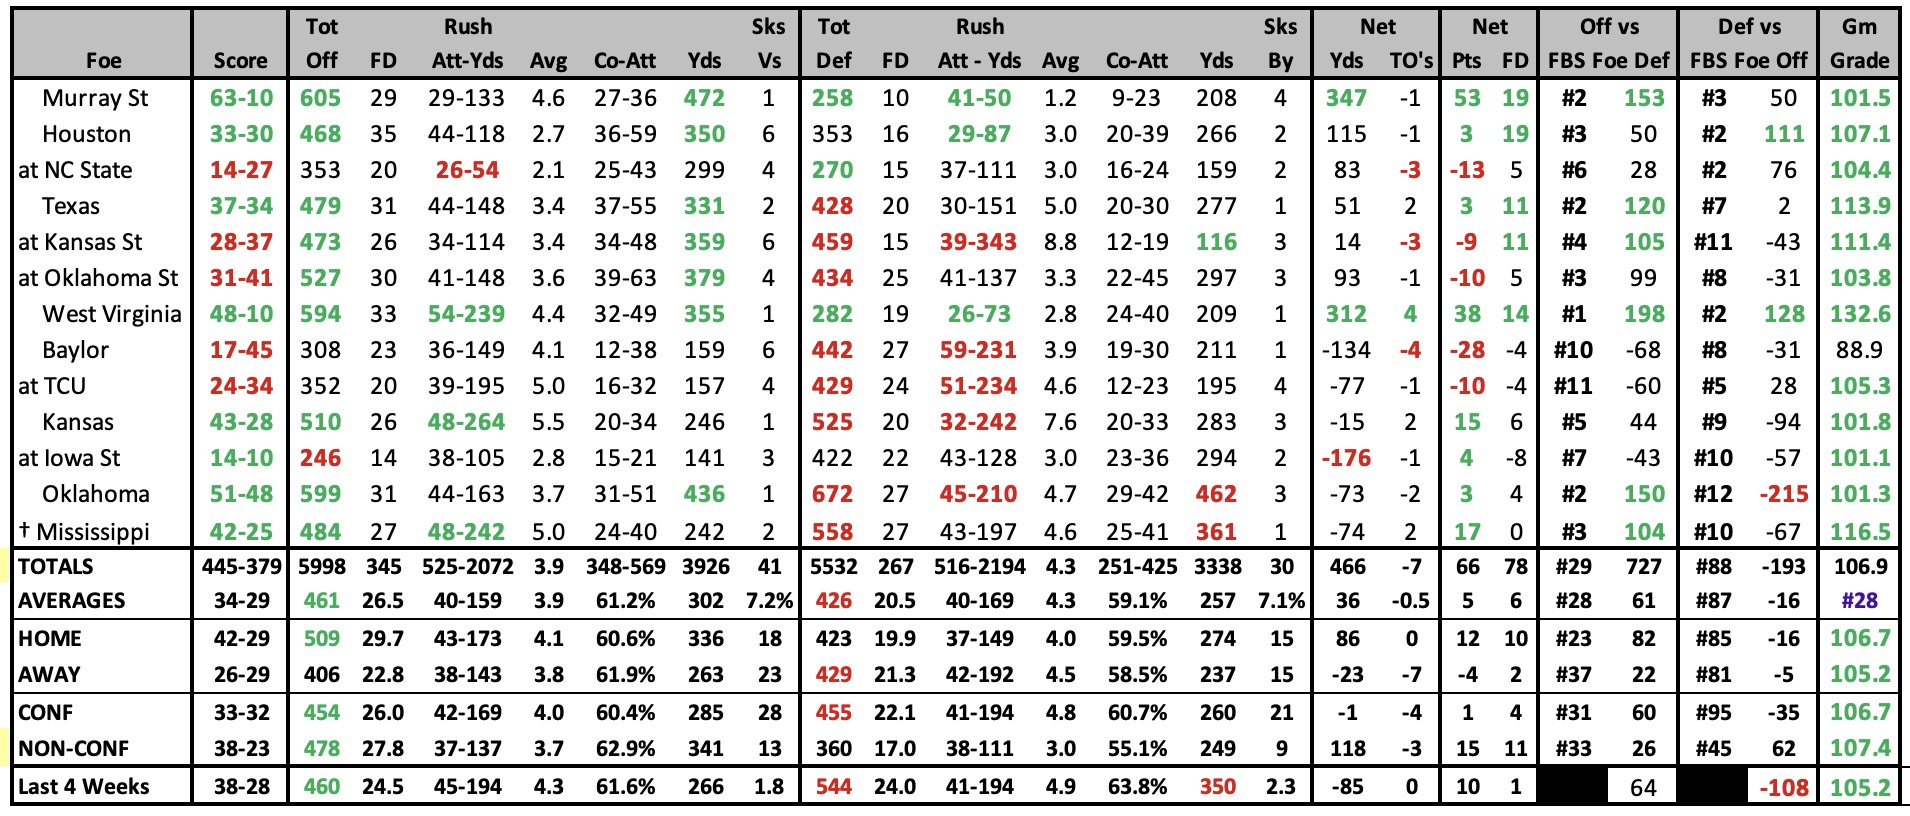
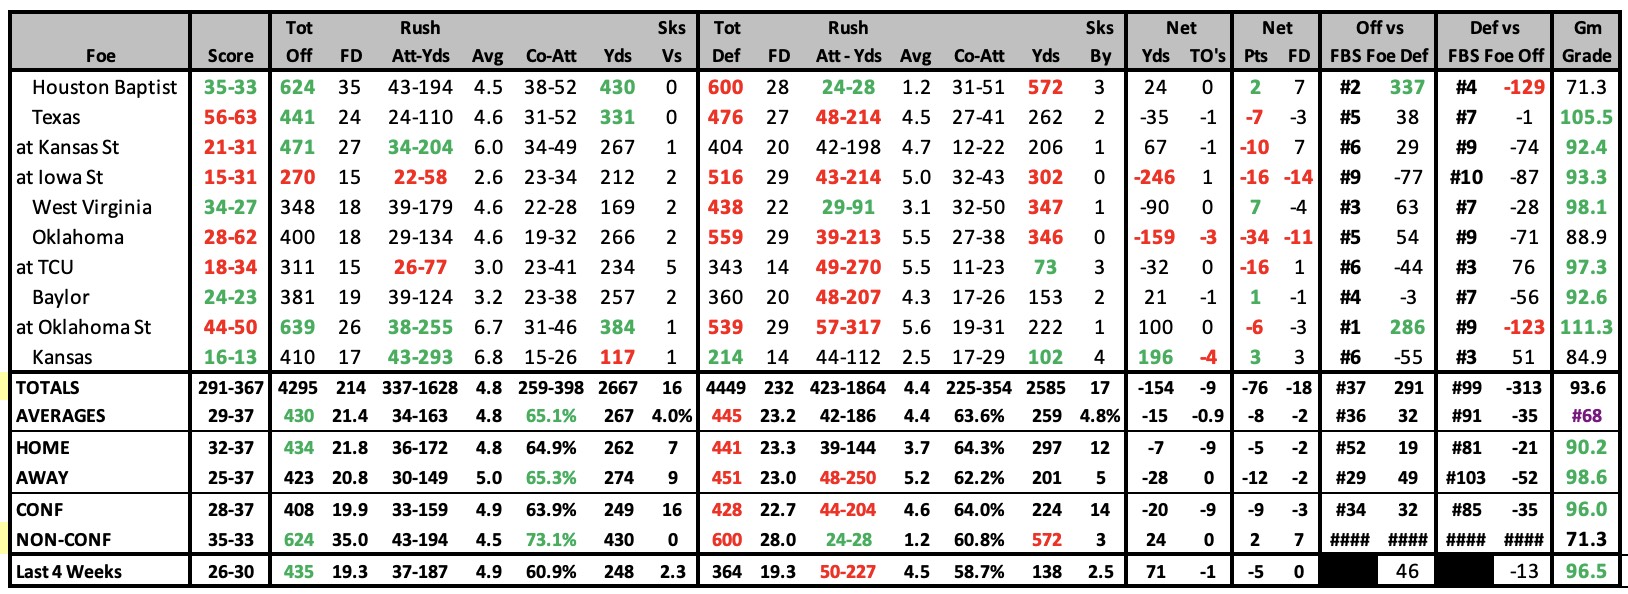
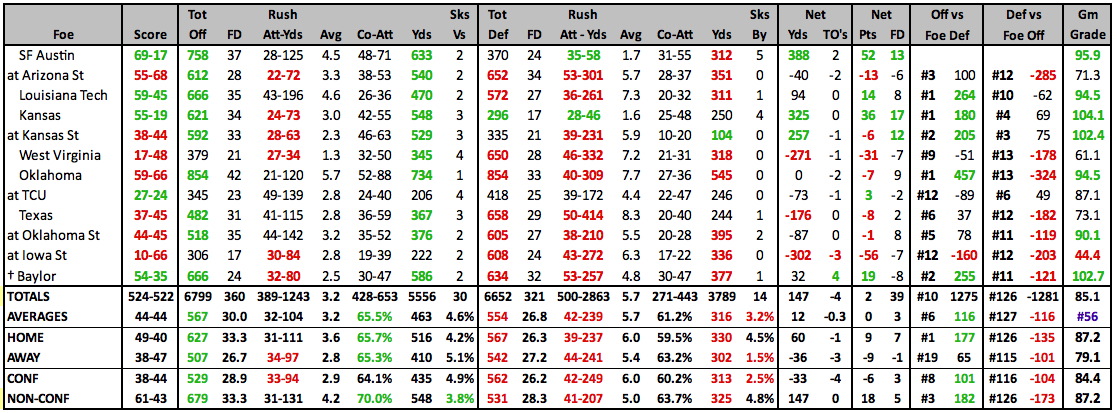
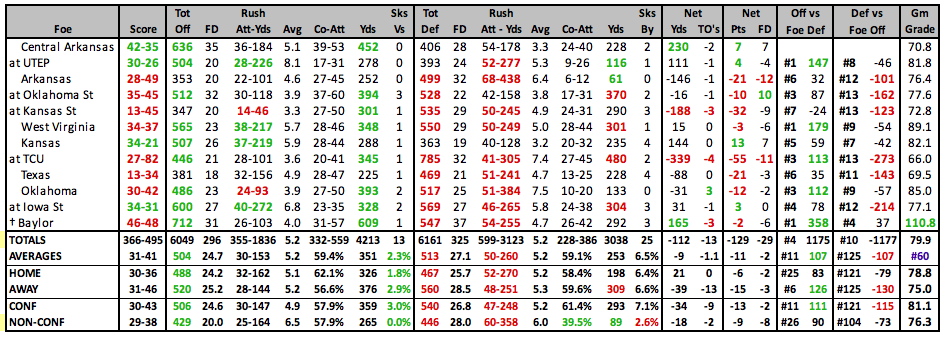
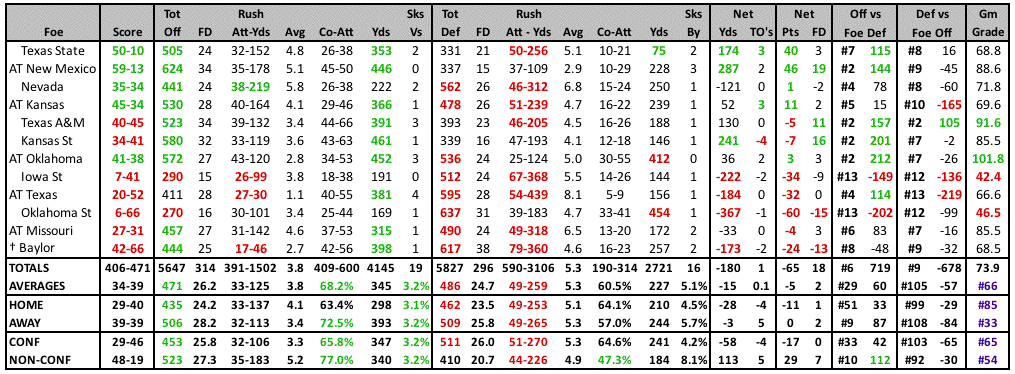
2025 GAME BY GAME STATS |
 |
2025 SCHEDULE |
2024 RESULTS |
||||||||||||||||||||||||||||||||||||||||||||||||||||||||||||||||||||||||||||||||||||||||||||||||||||||||||||||||||||||||||||||||||||||||||||||||||||||||||||||||||||||||||||||||||||||||||||||||||||||||||||||||||||||||||||||
|
|
||||||||||||||||||||||||||||||||||||||||||||||||||||||||||||||||||||||||||||||||||||||||||||||||||||||||||||||||||||||||||||||||||||||||||||||||||||||||||||||||||||||||||||||||||||||||||||||||||||||||||||||||||||||||||||||
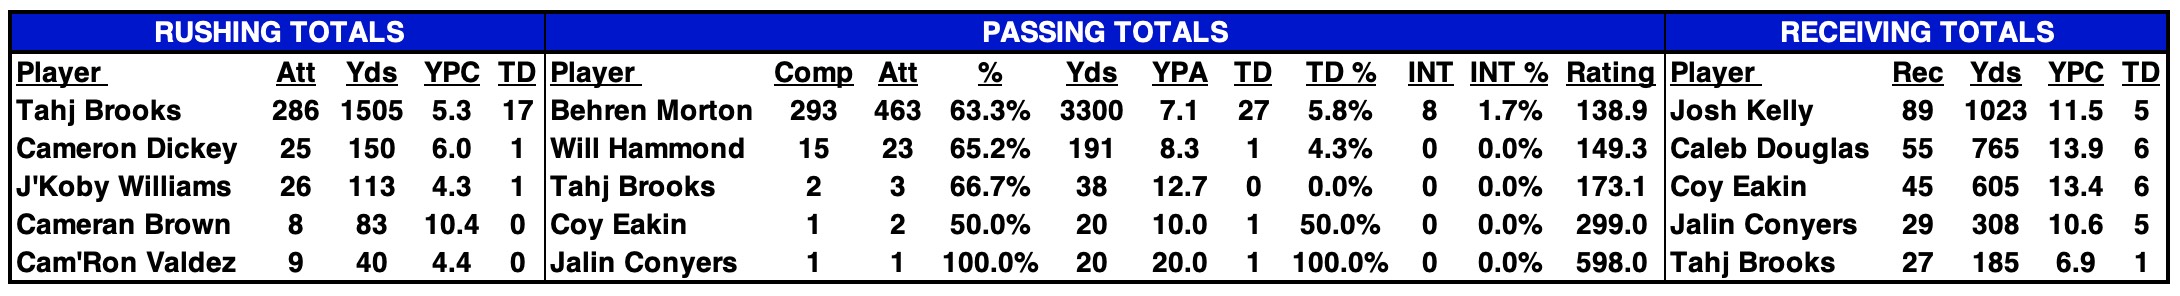
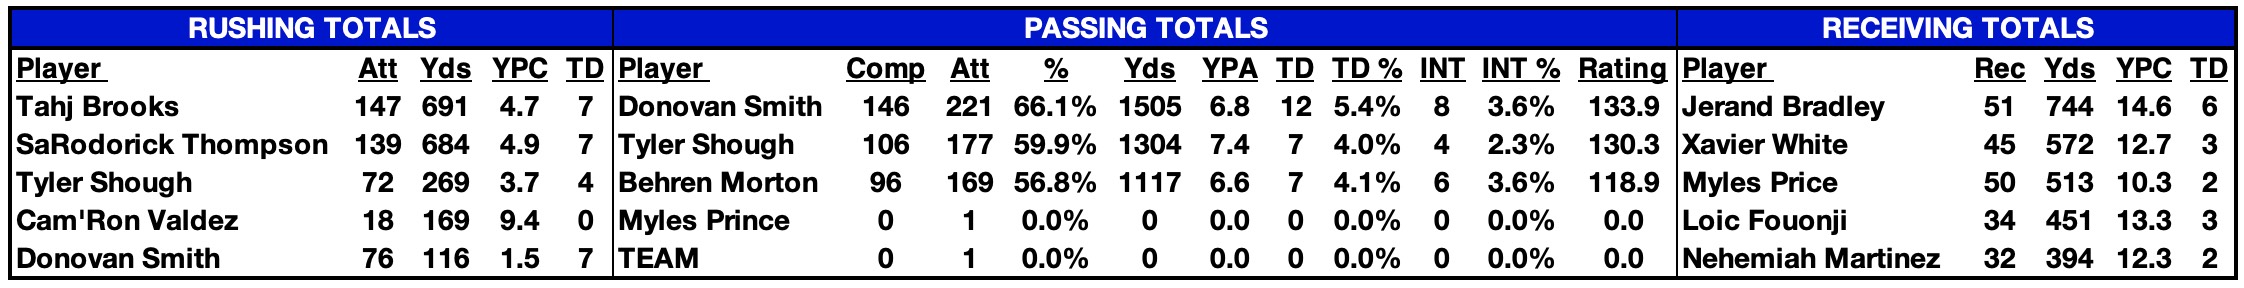
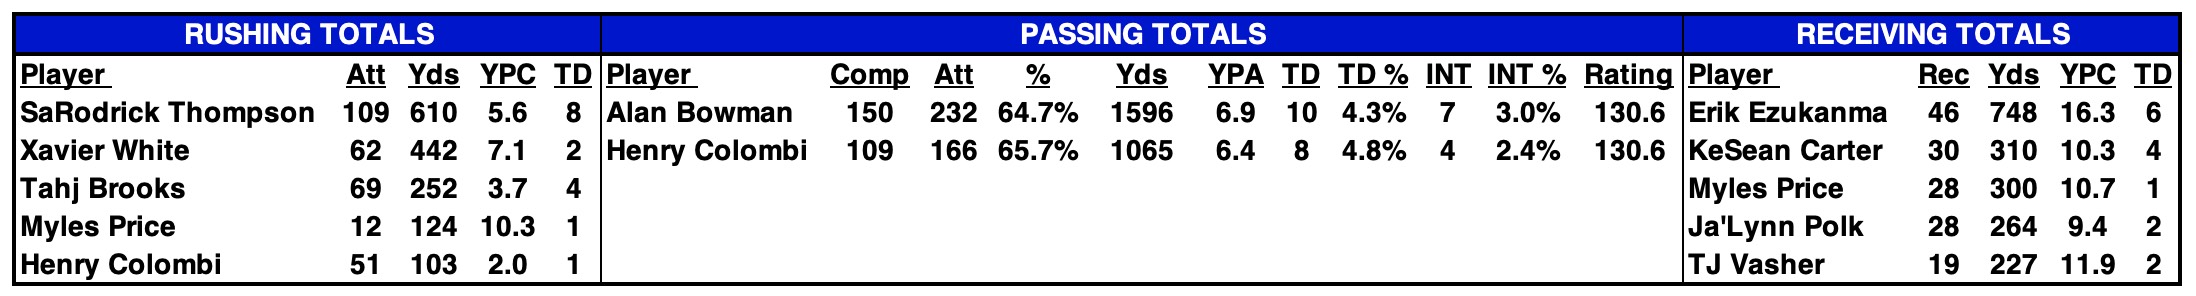
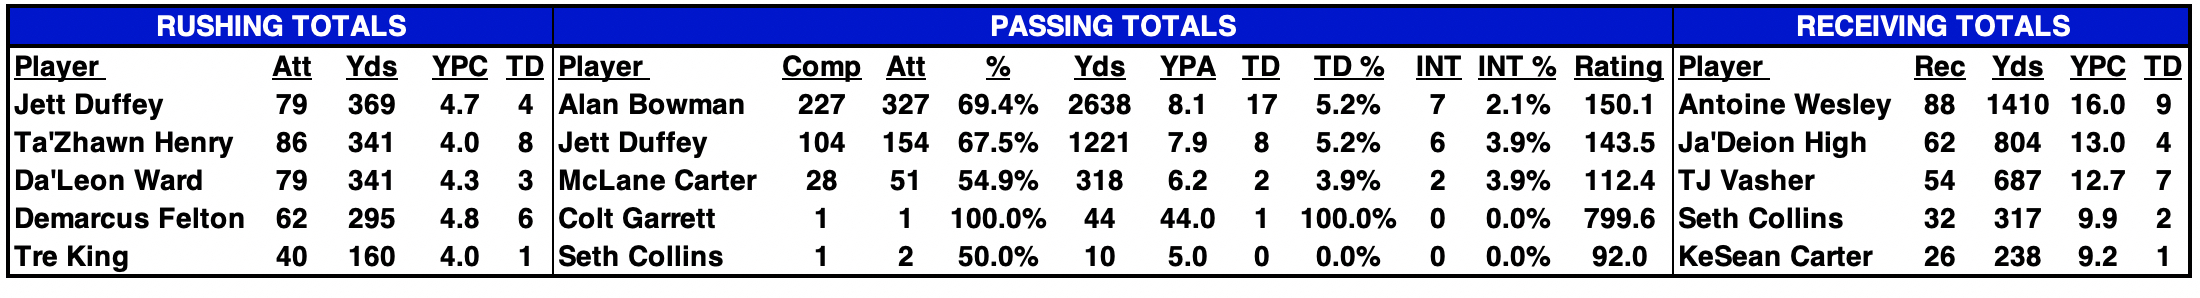
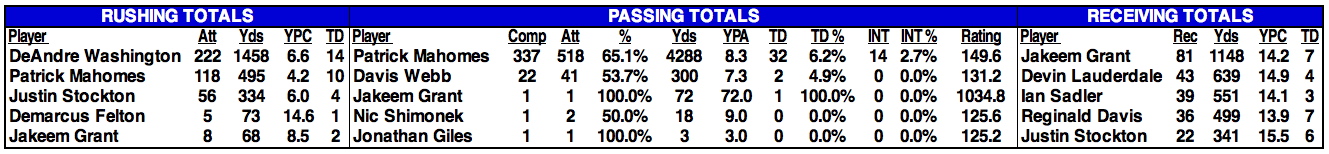
2024 STATISTICAL LEADERS |
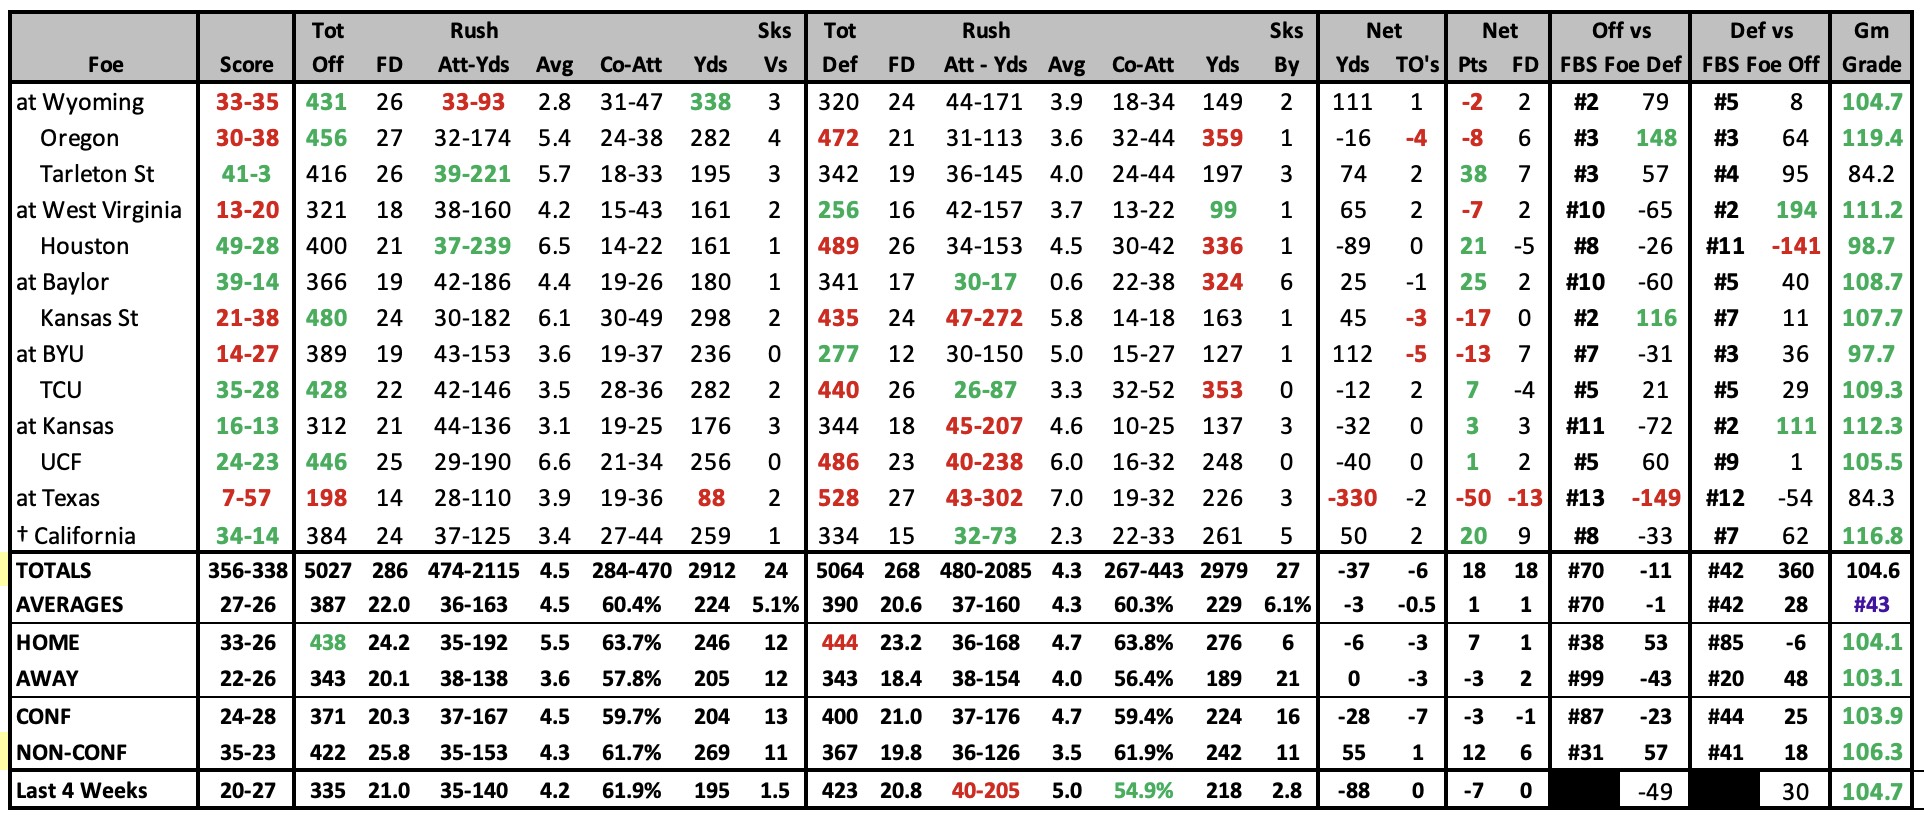
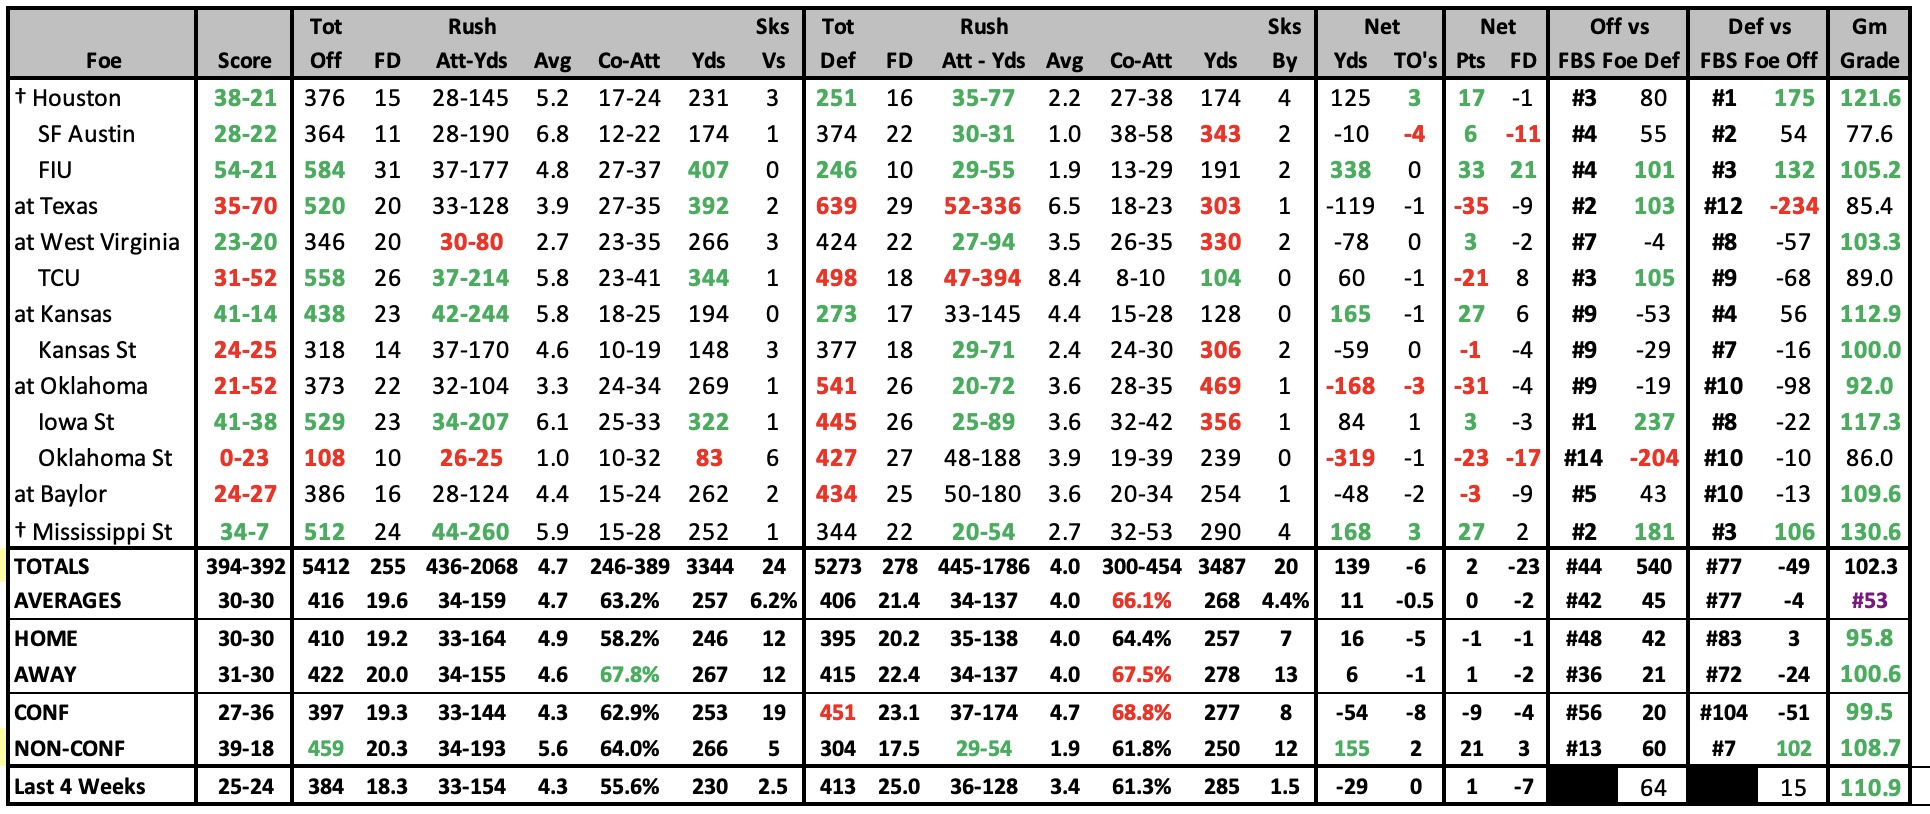
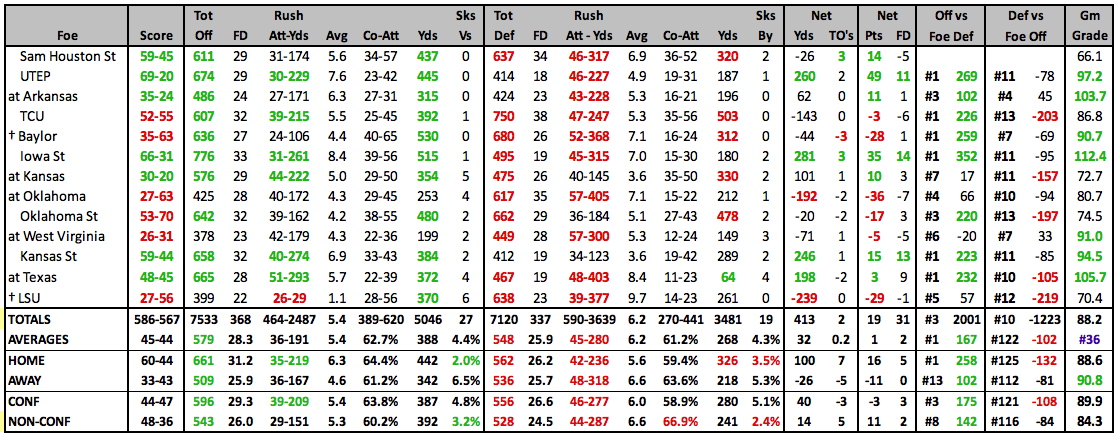
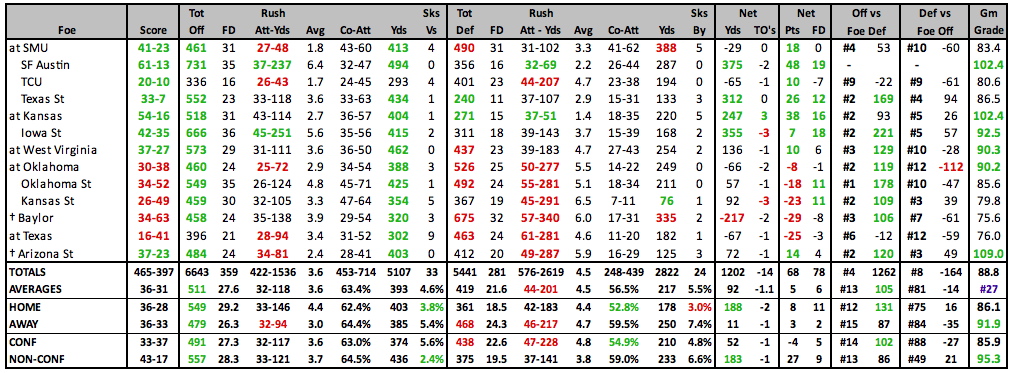
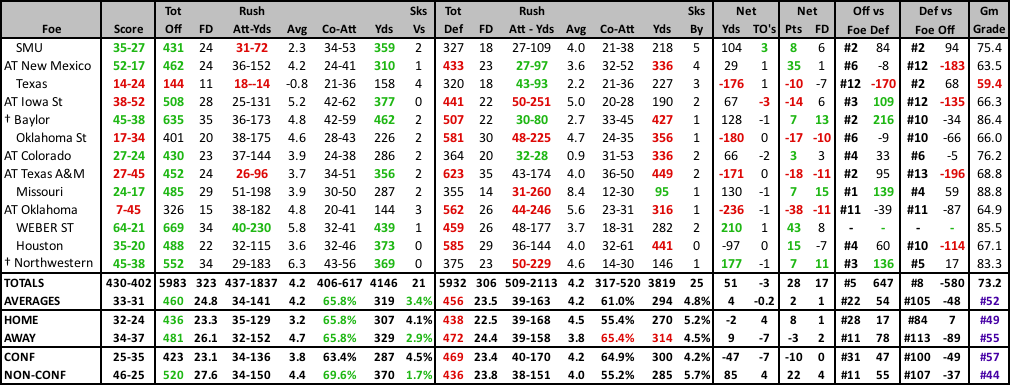
2024 GAME BY GAME STATS |
 |
2024 SCHEDULE |
2023 RESULTS |
||||||||||||||||||||||||||||||||||||||||||||||||||||||||||||||||||||||||||||||||||||||||||||||||||||||||||||||||||||||||||||||||||||||||||||||||||||||||||||||||||||||||||||||||||||||||||||||||||||||||||||
|
|
||||||||||||||||||||||||||||||||||||||||||||||||||||||||||||||||||||||||||||||||||||||||||||||||||||||||||||||||||||||||||||||||||||||||||||||||||||||||||||||||||||||||||||||||||||||||||||||||||||||||||||
2023 STATISTICAL LEADERS |
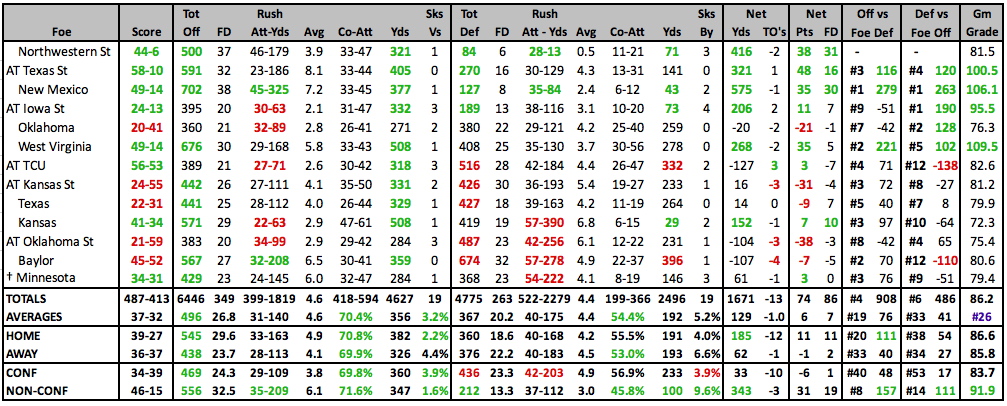
2023 GAME BY GAME STATS |
 |
2023 SCHEDULE |
2022 RESULTS |
||||||||||||||||||||||||||||||||||||||||||||||||||||||||||||||||||||||||||||||||||||||||||||||||||||||||||||||||||||||||||||||||||||||||||||||||||||||||||||||||||||||||||||||||||||||||||||||||||||||
|
|
||||||||||||||||||||||||||||||||||||||||||||||||||||||||||||||||||||||||||||||||||||||||||||||||||||||||||||||||||||||||||||||||||||||||||||||||||||||||||||||||||||||||||||||||||||||||||||||||||||||
2022 STATISTICAL LEADERS |
2022 GAME BY GAME STATS |
 |
2022 SCHEDULE |
2021 RESULTS |
||||||||||||||||||||||||||||||||||||||||||||||||||||||||||||||||||||||||||||||||||||||||||||||||||||||||||||||||||||||||||||||||||||||||||||||||||||||||||||||||||||||||||||||||||||||||||||||||||||||
|
|
||||||||||||||||||||||||||||||||||||||||||||||||||||||||||||||||||||||||||||||||||||||||||||||||||||||||||||||||||||||||||||||||||||||||||||||||||||||||||||||||||||||||||||||||||||||||||||||||||||||
2021 STATISTICAL LEADERS |
2021 GAME BY GAME STATS |
 |
2021 SCHEDULE |
2020 RESULTS |
||||||||||||||||||||||||||||||||||||||||||||||||||||||||||||||||||||||||||||||||||||||||||||||||||||||||||||||||||||||||||||||||||||||||||||||||||||||||||||||||||||||||||||||||||||||||||
|
|
||||||||||||||||||||||||||||||||||||||||||||||||||||||||||||||||||||||||||||||||||||||||||||||||||||||||||||||||||||||||||||||||||||||||||||||||||||||||||||||||||||||||||||||||||||||||||
2020 STATISTICAL LEADERS |
2020 GAME BY GAME STATS |
 |
2020 SCHEDULE |
2019 RESULTS |
||||||||||||||||||||||||||||||||||||||||||||||||||||||||||||||||||||||||||||||||||||||||||||||||||||||||||||||||||||||||||||||||||||||||||||||||||||||||||||||||||||||||||||||||||||||||||
|
|
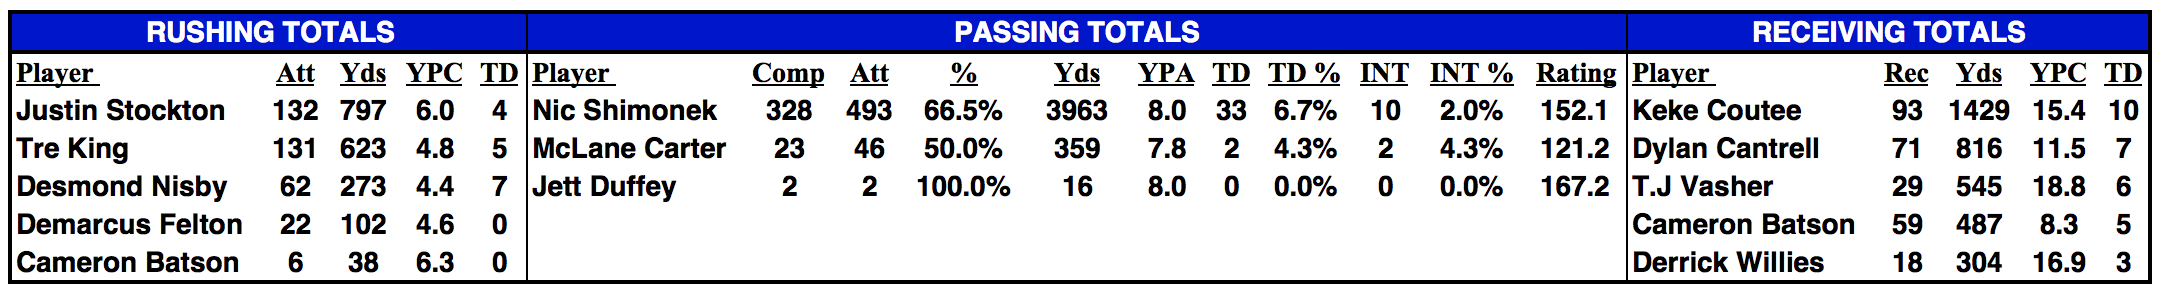
2019 STATISTICAL LEADERS |
2019 GAME BY GAME STATS |
 |
2019 SCHEDULE |
2018 RESULTS |
|||||||||||||||||||||||||||||||||||||||||||||||||||||||||||||||||||||||||||||||||||||||||||||||||||||||||||||||||||||||||||||||||||||||||||||||||||||||||||||||||||||||||||||||||||||||||||||||||||||||||
|
|
2018 STATISTICAL LEADERS |
2018 GAME BY GAME STATS |
 |
2018 SCHEDULE |
2017 RESULTS |
||||||||||||||||||||||||||||||||||||||||||||||||||||||||||||||||||||||||||||||||||||||||||||||||||||||||||||||||||||||||||||||||||||||||||||||||||||||||||||||||||||||||||||||||||||||||||||||||||||||||||||||||||||||||||||||||
|
|
||||||||||||||||||||||||||||||||||||||||||||||||||||||||||||||||||||||||||||||||||||||||||||||||||||||||||||||||||||||||||||||||||||||||||||||||||||||||||||||||||||||||||||||||||||||||||||||||||||||||||||||||||||||||||||||||
2017 STATISTICAL LEADERS |
2017 GAME BY GAME STATS |
 |
2017 SCHEDULE |
2016 RESULTS |
||||||||||||||||||||||||||||||||||||||||||||||||||||||||||||||||||||||||||||||||||||||||||||||||||||||||||||||||||||||||||||||||||||||||||||||||||||||||||||||||||||||||||||||||||||||||||||||||||||||||||||||||||||||||||||||||
|
|
||||||||||||||||||||||||||||||||||||||||||||||||||||||||||||||||||||||||||||||||||||||||||||||||||||||||||||||||||||||||||||||||||||||||||||||||||||||||||||||||||||||||||||||||||||||||||||||||||||||||||||||||||||||||||||||||
2016 STATISTICAL LEADERS |
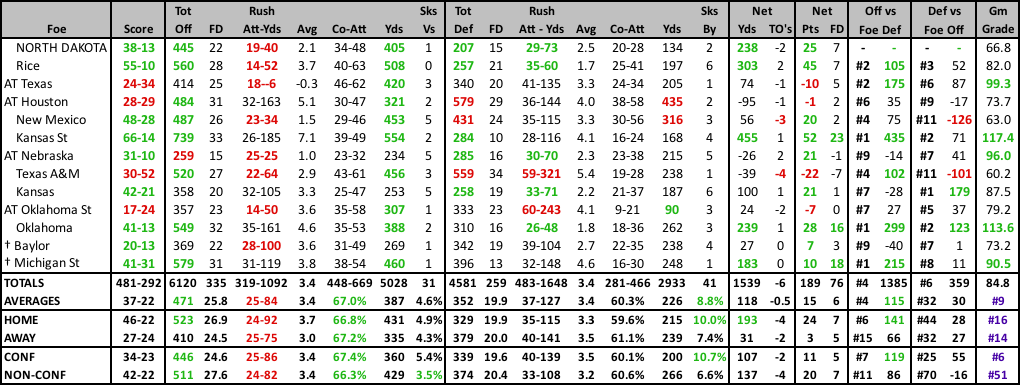
2016 GAME BY GAME STATS |
 |
2015 STATISTICAL LEADERS |
2015 GAME BY GAME STATS |
 |
2015 SCHEDULE |
2014 RESULTS |
||||||||||||||||||||||||||||||||||||||||||||||||||||||||||||||||||||||||||||||||||||||||||||||||||||||||||||||||||||||||||||||||||||||||||||||||||||||||||||||||||||||||||||||||||||||||||||||||||||||||||||||||||||||||||||||||||||||||
|
|
||||||||||||||||||||||||||||||||||||||||||||||||||||||||||||||||||||||||||||||||||||||||||||||||||||||||||||||||||||||||||||||||||||||||||||||||||||||||||||||||||||||||||||||||||||||||||||||||||||||||||||||||||||||||||||||||||||||||
2014 STATISTICAL LEADERS |
2014 GAME BY GAME STATS |
 |
2013 STATISTICAL LEADERS |
| Player | Att | Yds | YPC | TD | Player | Comp | Att | % | Yds | YPA | TD | INT | Rating | Player | Rec | Yds | YPC | TD |
| Kenny Williams | 125 | 500 | 4.0 | 8 | Davis Webb | 226 | 361 | 62.6% | 2718 | 7.5 | 20 | 8 | 139.7 | Jace Amaro | 106 | 1352 | 12.8 | 7 |
| DeAndre Washington | 107 | 450 | 4.2 | 4 | Baker Mayfield | 218 | 340 | 64.1% | 2315 | 6.8 | 12 | 9 | 127.7 | Eric Ward | 83 | 947 | 11.4 | 8 |
| SaDale Foster | 29 | 191 | 6.6 | 2 | Michael Brewer | 7 | 10 | 70.0% | 65 | 6.5 | 1 | 0 | 157.6 | Jakeem Grant | 65 | 796 | 12.2 | 7 |
2013 GAME BY GAME STATS |
 |
2013 RESULTS |
2012 RESULTS |
||||||||||||||||||||||||||||||||||||||||||||||||||||||||||||||||||||||||||||||||||||||||||||||||||||||||||||||||||||||||||||||||||||||||||||||||||||||||||||||||||||||||||||||||||||||||||||||||||||||||||||||||||||||||||||||||||||||||||||||||||||||||||||||||||||||||||||||
|
|
||||||||||||||||||||||||||||||||||||||||||||||||||||||||||||||||||||||||||||||||||||||||||||||||||||||||||||||||||||||||||||||||||||||||||||||||||||||||||||||||||||||||||||||||||||||||||||||||||||||||||||||||||||||||||||||||||||||||||||||||||||||||||||||||||||||||||||||
2012 STATISTICAL LEADERS |
| Player | Att | Yds | YPC | TD | Player | Comp | Att | % | Yds | YPA | TD | INT | Rating | Player | Rec | Yds | YPC | TD | ||
| Kenny Williams | 143 | 824 | 5.8 | 5 | Seth Doege | 381 | 542 | 70.3% | 4210 | 7.8 | 39 | 16 | 153.4 | Eric Ward | 82 | 1053 | 12.8 | 12 | ||
| Eric Stephens | 89 | 480 | 5.4 | 5 | Michael Brewer | 34 | 48 | 70.8% | 375 | 7.8 | 4 | 0 | 164.0 | Darrin Moore | 92 | 1032 | 11.2 | 13 | ||
| SaDale Foster | 91 | 451 | 5.0 | 3 | Austin Zouzalik | 1 | 1 | 100.0% | 29 | 29.0 | 0 | 0 | 343.6 | Jace Amaro | 25 | 409 | 16.4 | 4 |
| 2012 INDIVIDUAL PLAYER STATS • 2012 START CHART/ STARTERS LOST |
|---|
2012 GAME BY GAME STATS |
 |
2011 STATISTICAL LEADERS |
| Player | Att | Yds | YPC | TD | Player | Comp | Att | % | Yds | YPA | TD | INT | Rating | Player | Rec | Yds | YPC | TD | ||
| Eric Stephens | 109 | 572 | 5.2 | 8 | Seth Doege | 394 | 576 | 68.4% | 3961 | 6.9 | 28 | 10 | 138.7 | Eric Ward | 82 | 777 | 9.5 | 11 | ||
| DeAndre Washington | 71 | 365 | 5.1 | 3 | Jacob Karam | 8 | 16 | 50.0% | 61 | 3.8 | 1 | 0 | 102.7 | Alex Torres | 51 | 613 | 12.0 | 4 | ||
| Aaron Crawford | 88 | 351 | 4.0 | 1 | Austin Zouzalik | 2 | 2 | 100.0% | 37 | 18.5 | 1 | 0 | 420.4 | Darrin Moore | 49 | 600 | 12.2 | 8 |
| 2011 Individual Player Stats • 2011 START CHART/STARTERS LOST |
|---|
2011 GAME BY GAME STATS |
2011 RESULTS |
2010 RESULTS |
|||||||||||||||||||||||||||||||||||||||||||||||||||||||||||||||||||||||||||||||||||||||||||||||||||||||||||||||||||||||||||||||||||||||||||||||||||||||||||||||||||||||||||||||||||||||||||||||||||
|
|
|||||||||||||||||||||||||||||||||||||||||||||||||||||||||||||||||||||||||||||||||||||||||||||||||||||||||||||||||||||||||||||||||||||||||||||||||||||||||||||||||||||||||||||||||||||||||||||||||||
2010 STATISTICAL LEADERS |
| Player | Att | Yds | YPC | TD | Player | Comp | Att | % | Yds | YPA | TD | INT | Rating | Player | Rec | Yds | YPC | TD | ||
| Baron Batch | 175 | 811 | 4.6 | 5 | Taylor Potts | 368 | 550 | 66.9% | 3718 | 6.8 | 34 | 10 | 140.5 | Lyle Leong | 74 | 926 | 12.5 | 19 | ||
| Eric Stephens | 129 | 671 | 5.2 | 6 | Steven Sheffield | 33 | 58 | 56.9% | 359 | 6.2 | 3 | 1 | 122.5 | Detron Lewis | 86 | 848 | 9.9 | 6 | ||
| Ben McRoy | 22 | 149 | 6.8 | 2 | Seth Doege | 3 | 4 | 75.0% | 58 | 14.5 | 0 | 0 | 196.8 | Alexander Torres | 39 | 481 | 12.3 | 3 |
| 2010 Individual Player Stats |
|---|
2010 GAME BY GAME STATS |
2009 STATISTICAL LEADERS |
| Player | Att | Yds | YPC | TD | Player | Comp | Att | % | Yds | YPA | TD | INT | Rating | Player | Rec | Yds | YPC | TD | ||
| Baron Batch | 146 | 784 | 5.37 | 12 | Taylor Potts | 280 | 427 | 65.6% | 3068 | 7.2 | 20 | 12 | 135.8 | Alexander Torres | 65 | 791 | 12.2 | 6 | ||
| Eric Stephens | 45 | 223 | 4.96 | 2 | Steven Sheffield | 92 | 125 | 73.6% | 1131 | 9.0 | 13 | 4 | 177.5 | Detron Lewis | 55 | 730 | 13.3 | 5 | ||
| Harrison Jeffers | 34 | 213 | 6.26 | 4 | Seth Doege | 38 | 61 | 62.3% | 369 | 6.0 | 2 | 0 | 123.9 | Tramain Swindall | 48 | 645 | 13.4 | 5 |
| 2009 Individual Player Stats |
|---|
2009 GAME BY GAME STATS |
2009 RESULTS |
2008 RESULTS |
|||||||||||||||||||||||||||||||||||||||||||||||||||||||||||||||||||||||||||||||||||||||||||||||||||||||||||||||||||||||||||||||||||||||||||||||||||||||||||
|
|
|||||||||||||||||||||||||||||||||||||||||||||||||||||||||||||||||||||||||||||||||||||||||||||||||||||||||||||||||||||||||||||||||||||||||||||||||||||||||||
| 2008 Individual Player Stats • 2007 Individual Player Stats |
|---|