
WEST VIRGINIA MOUNTAINEERS |
|
STADIUM: Mountaineer Field at Milan Puskar Stadium
|
 |
|
QUICK FACTS: |
|
| LOCATION: Morgantown, WV |
|
| FOUNDED: 1867,
1st year FB 1891 |
|
| ENROLLMENT: 18,641 | |
COLORS: Old Gold & Blue |
|
| MASCOT: Mountaineer | |
| CONFERENCE: Big 12 | |
| HC: Rich Rodriguez | |
| Years with Team: 8th | |
| Overall Record: 136-91 | |
| Record w/Team: 60-26 |
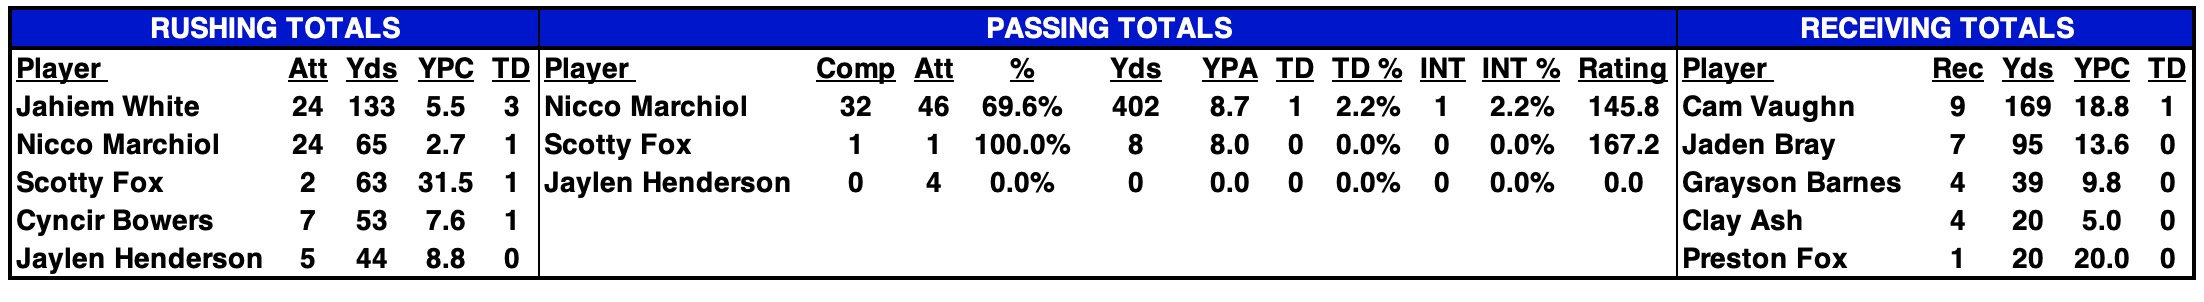
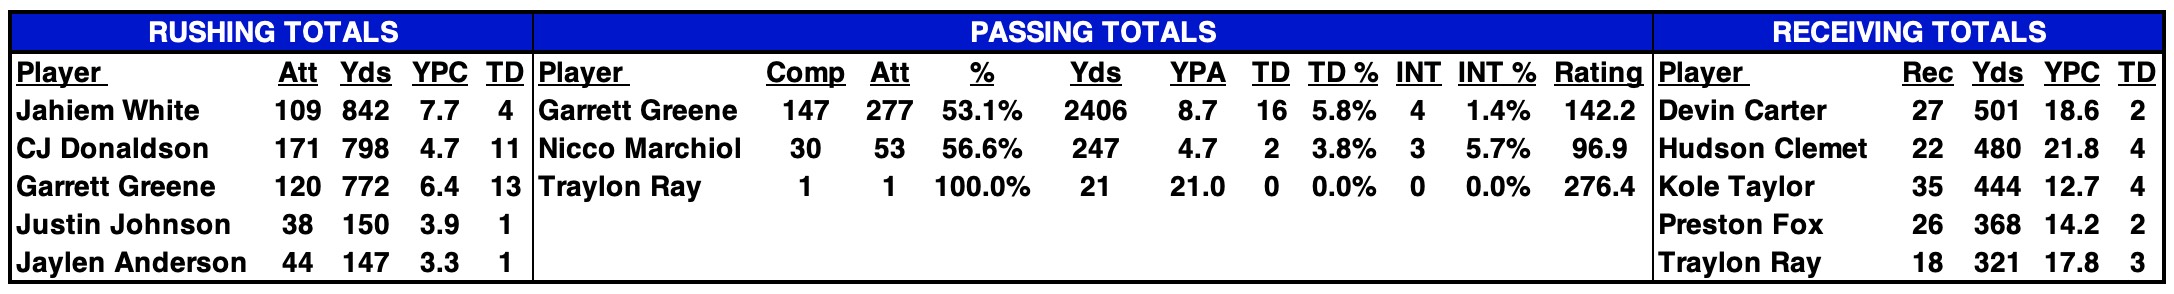
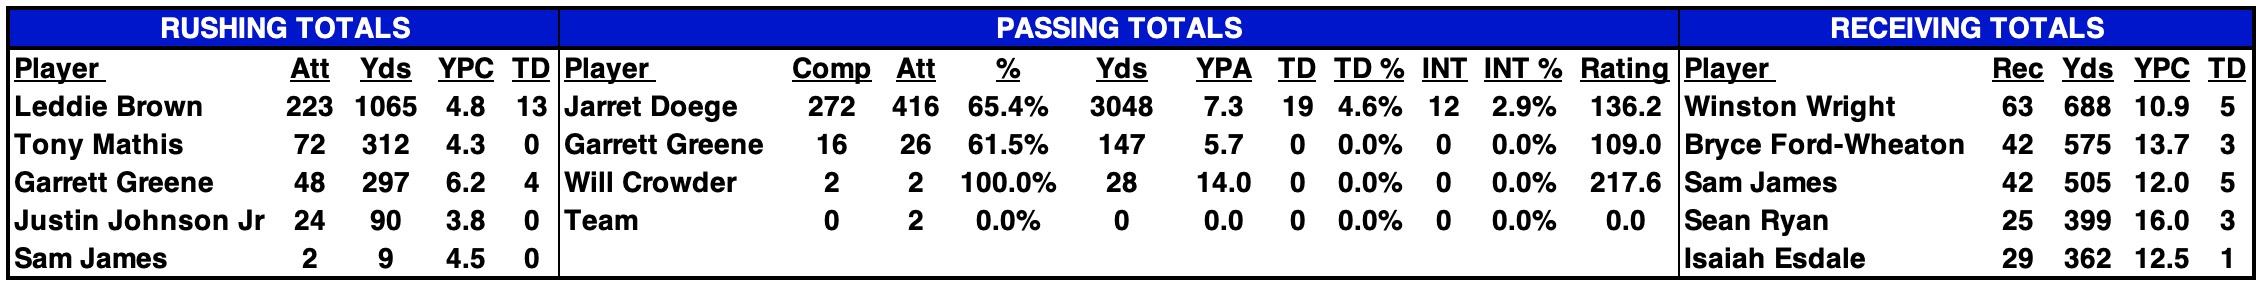
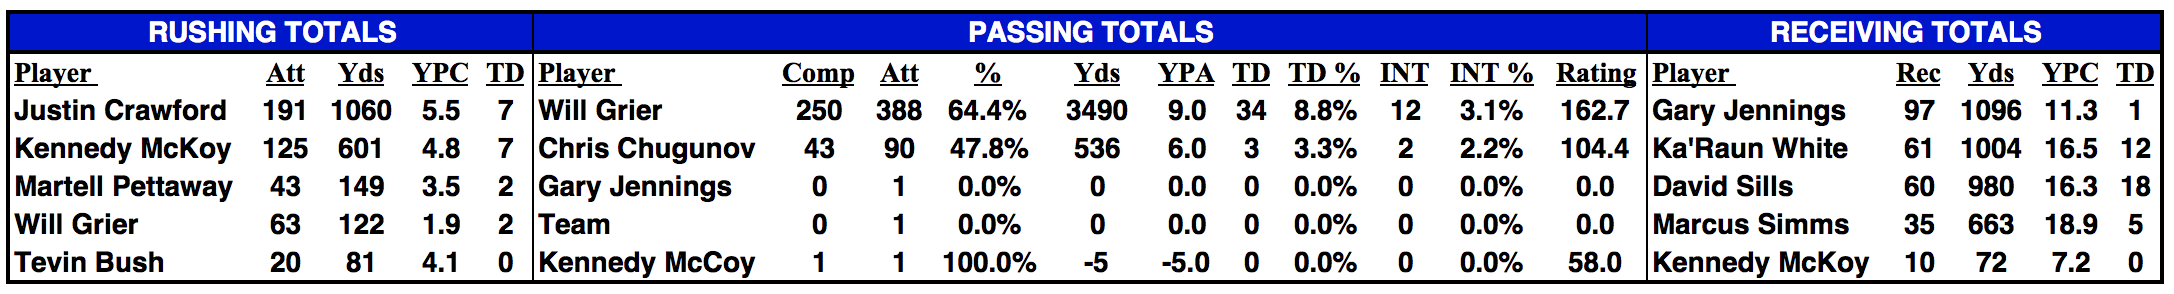
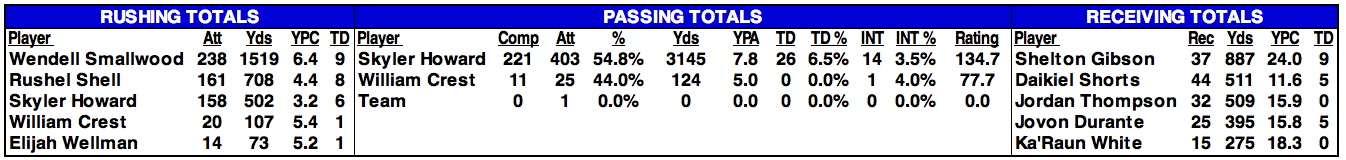
| 2025 STATISTICAL LEADERS |
|---|
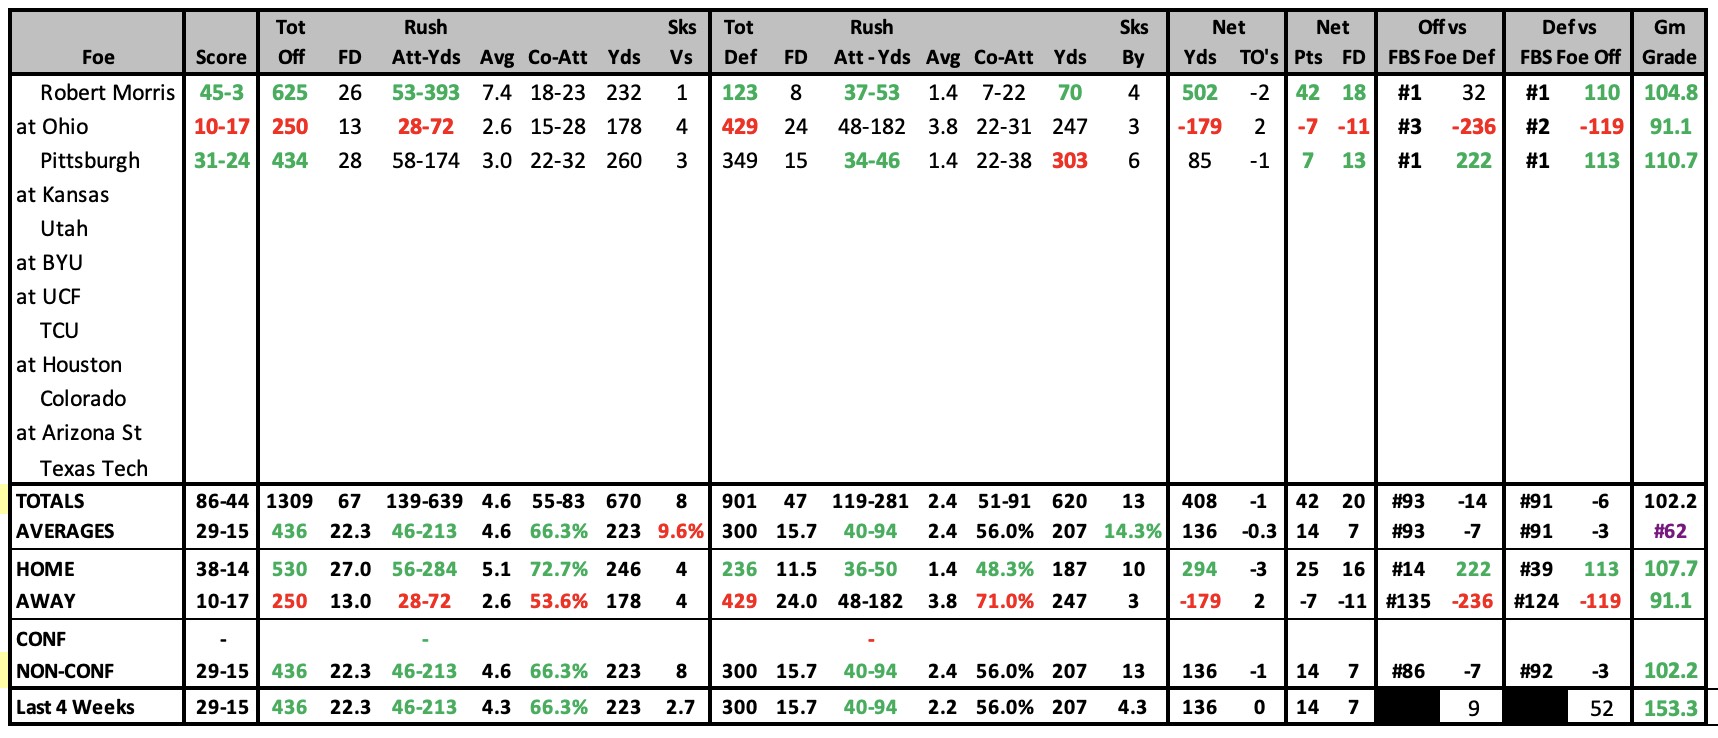
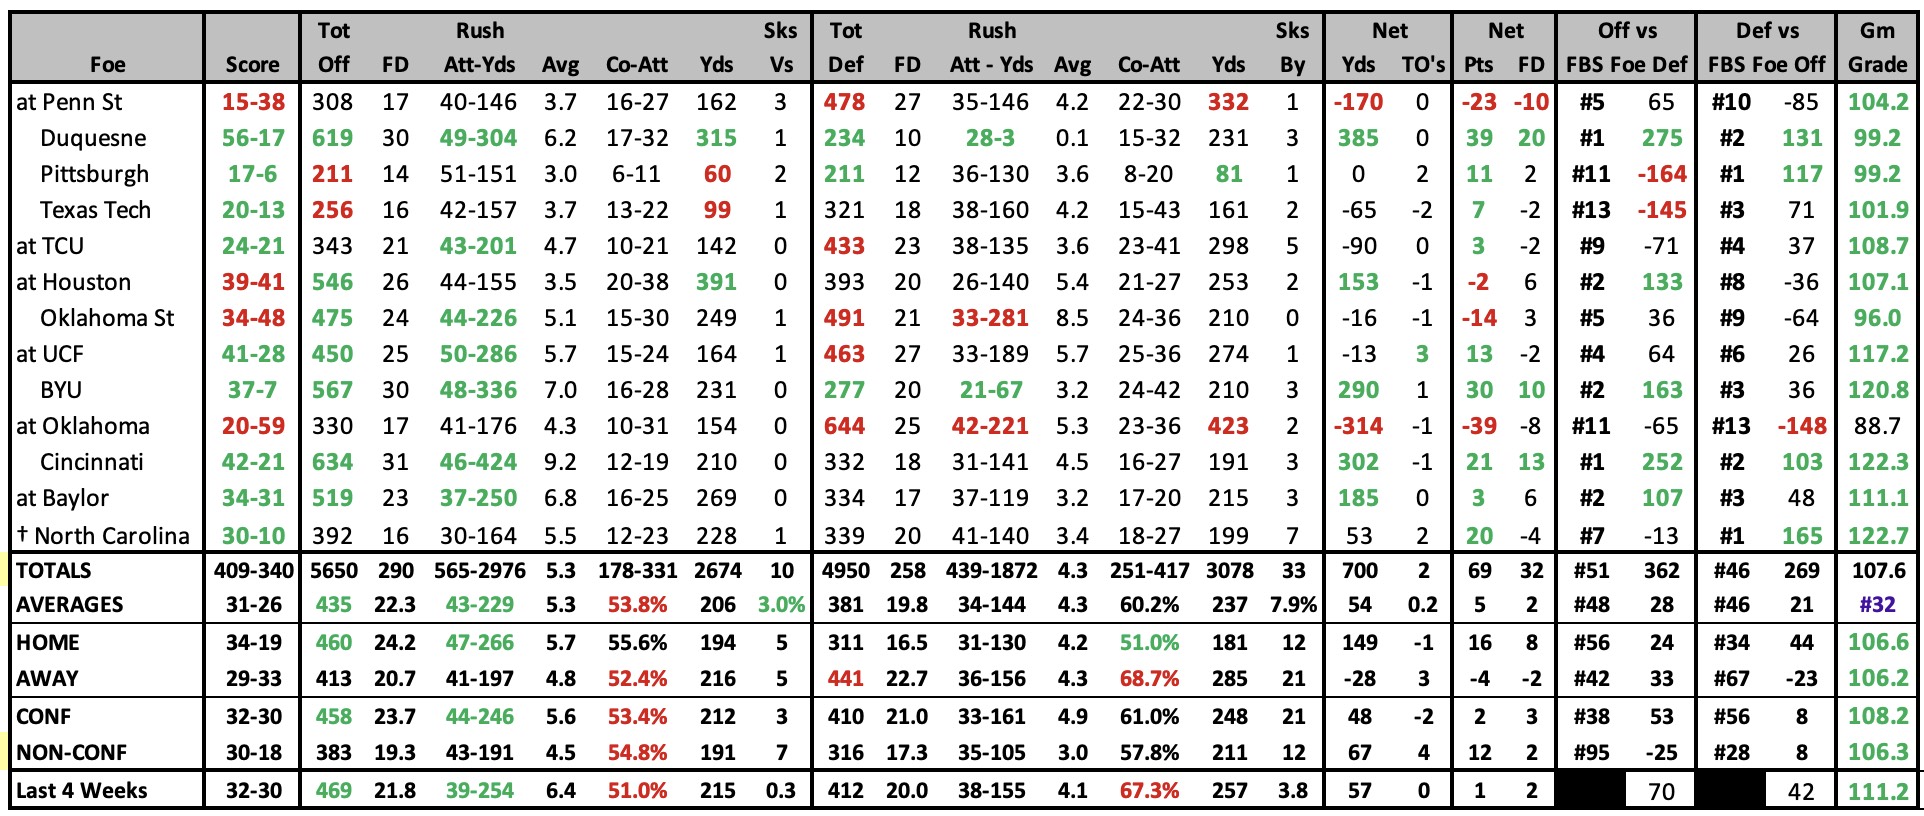
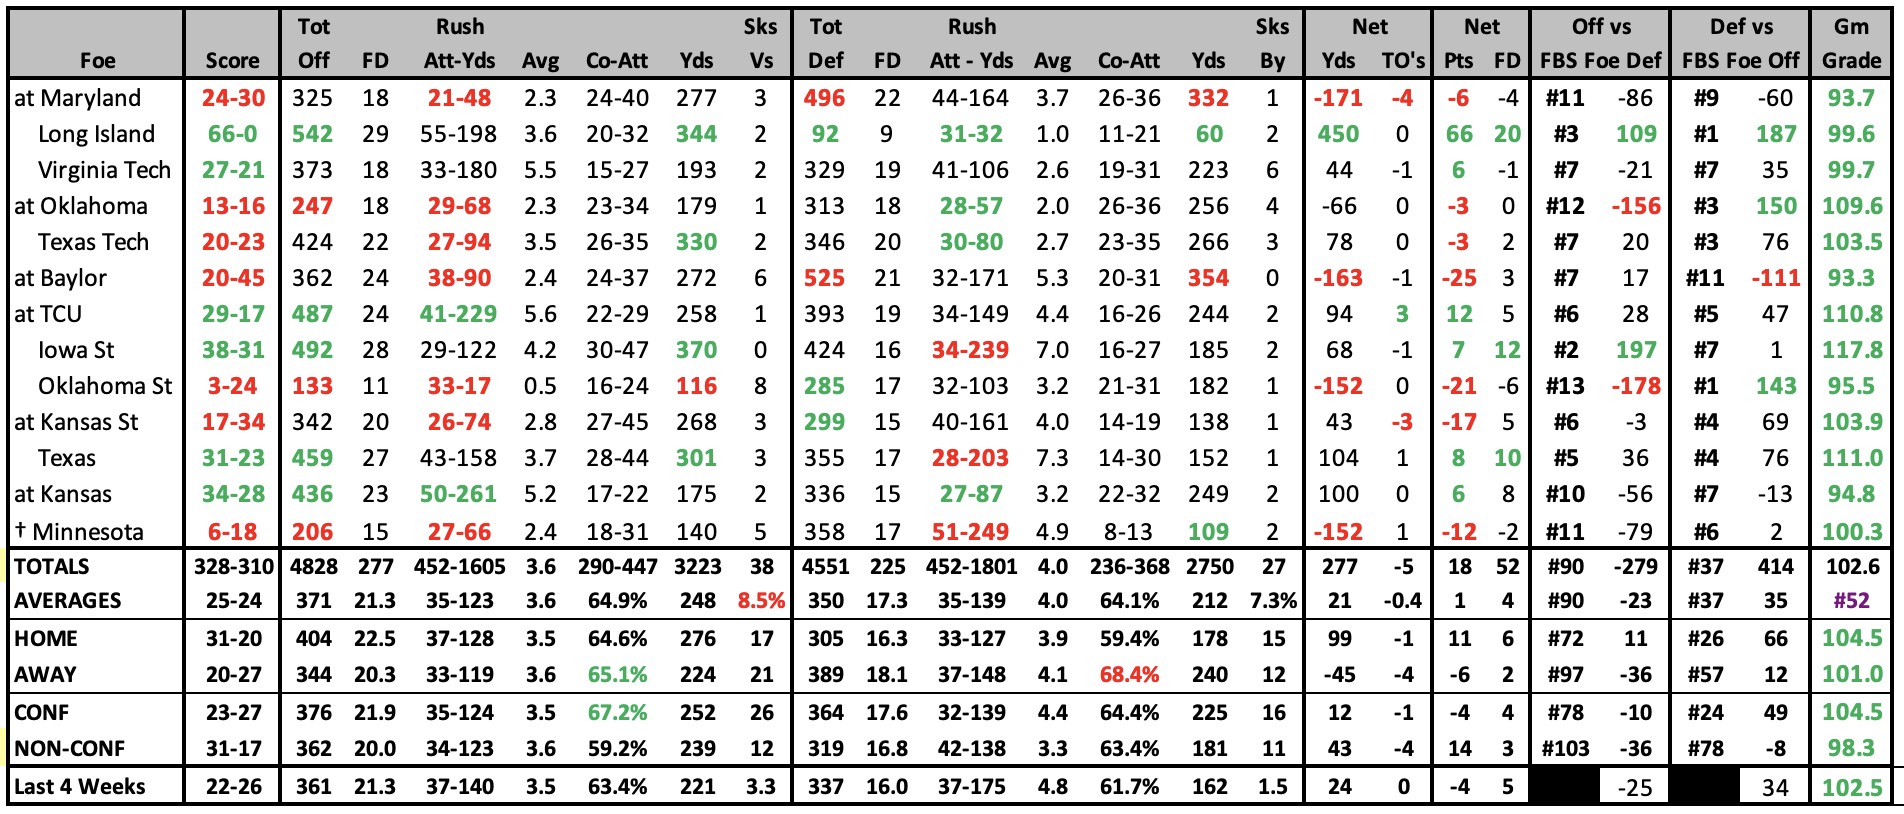
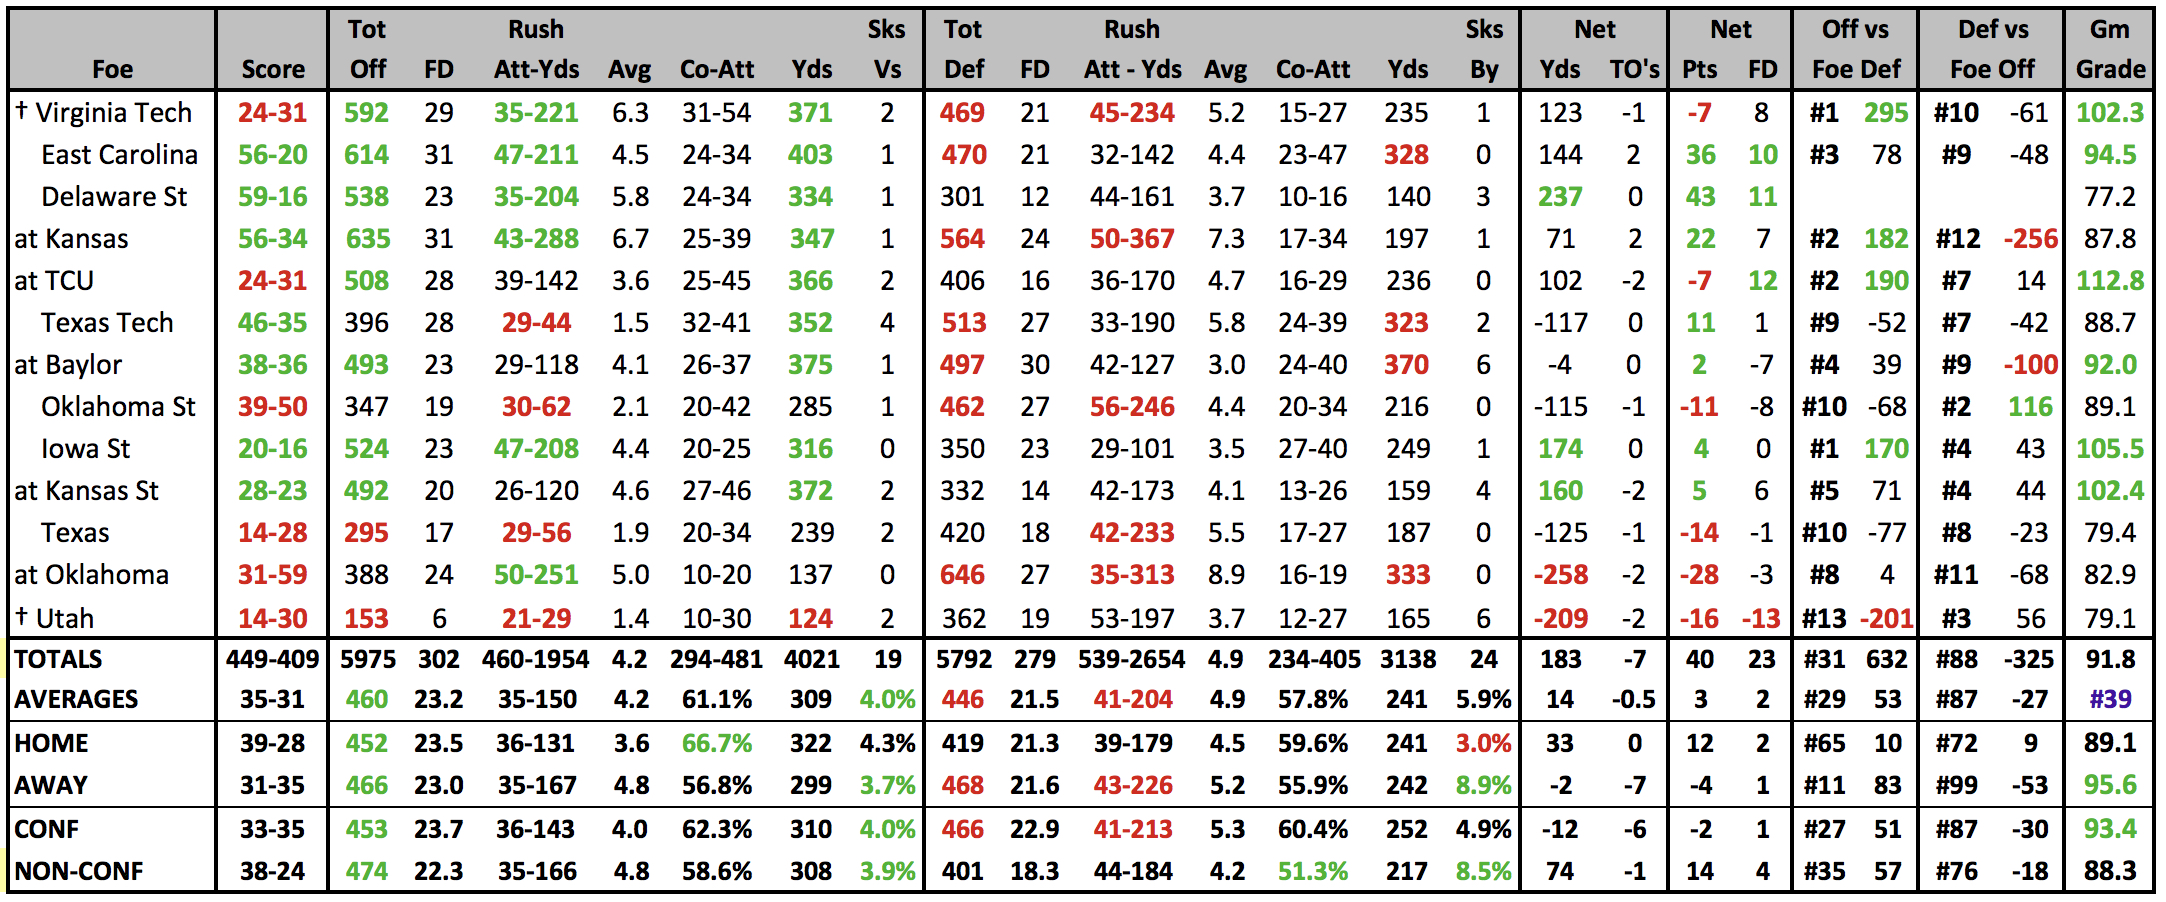
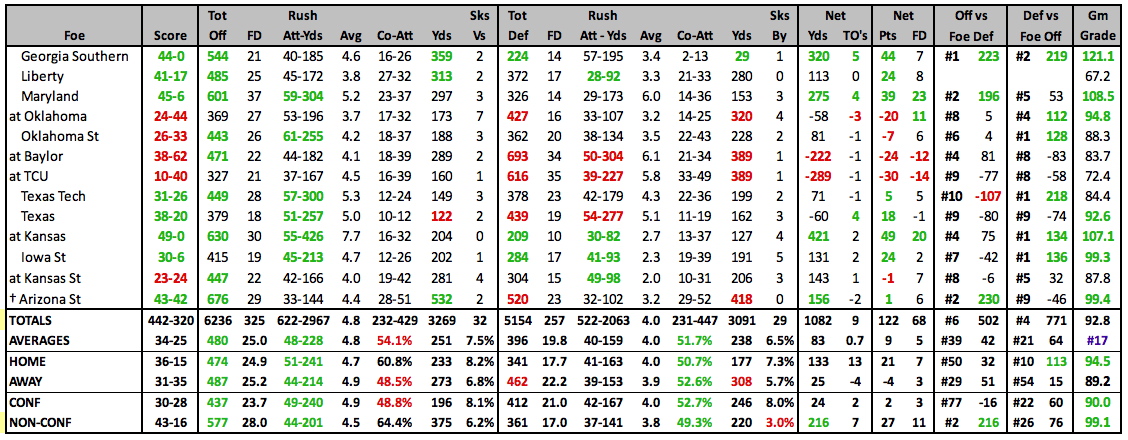
| 2025 GAME-BY-GAME STATS |
|---|
 |
2025 SCHEDULE |
2024 RESULTS |
||||||||||||||||||||||||||||||||||||||||||||||||||||||||||||||||||||||||||||||||||||||||||||||||||||||||||||||||||||||||||||||||||||||||||||||||||||||||||||||||||||||||||||||||||||||||||||||||||||||||||||||||||
|
|
||||||||||||||||||||||||||||||||||||||||||||||||||||||||||||||||||||||||||||||||||||||||||||||||||||||||||||||||||||||||||||||||||||||||||||||||||||||||||||||||||||||||||||||||||||||||||||||||||||||||||||||||||
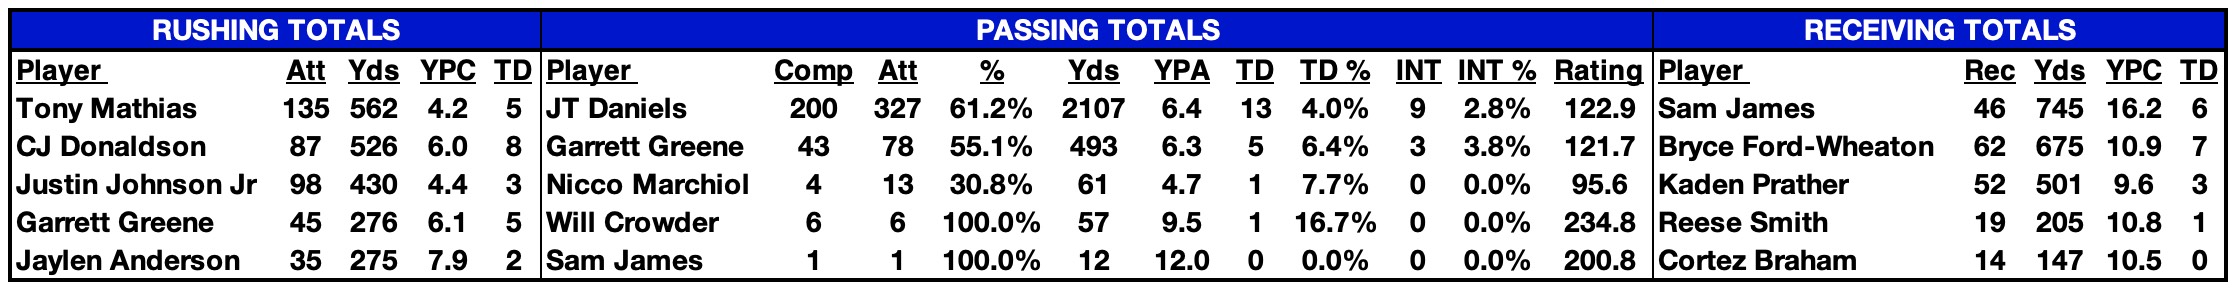
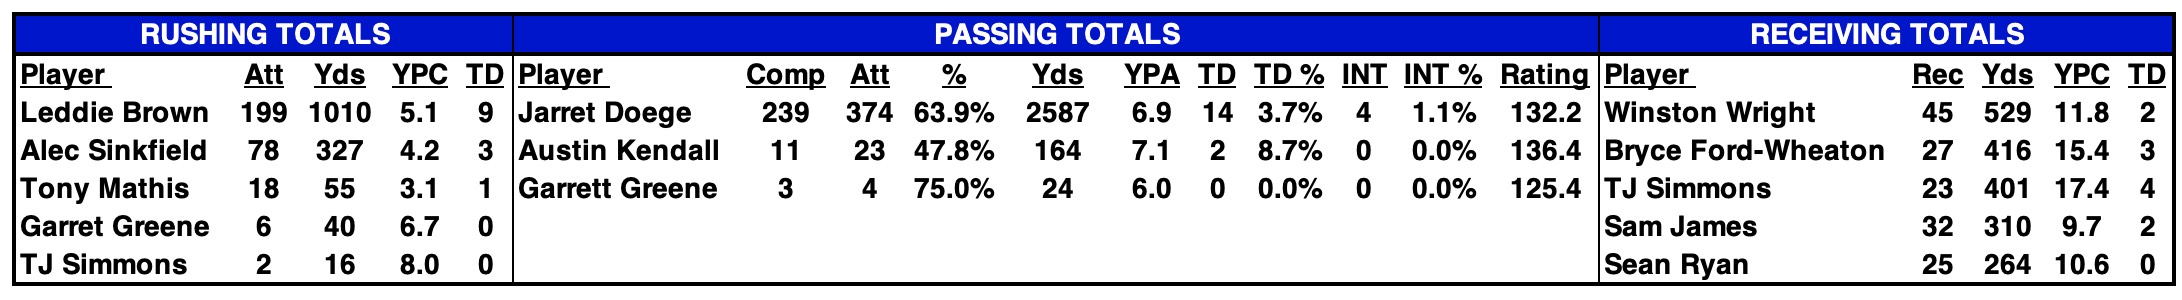
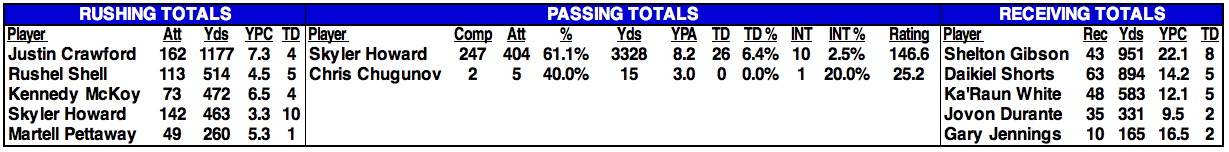
| 2024 STATISTICAL LEADERS |
|---|

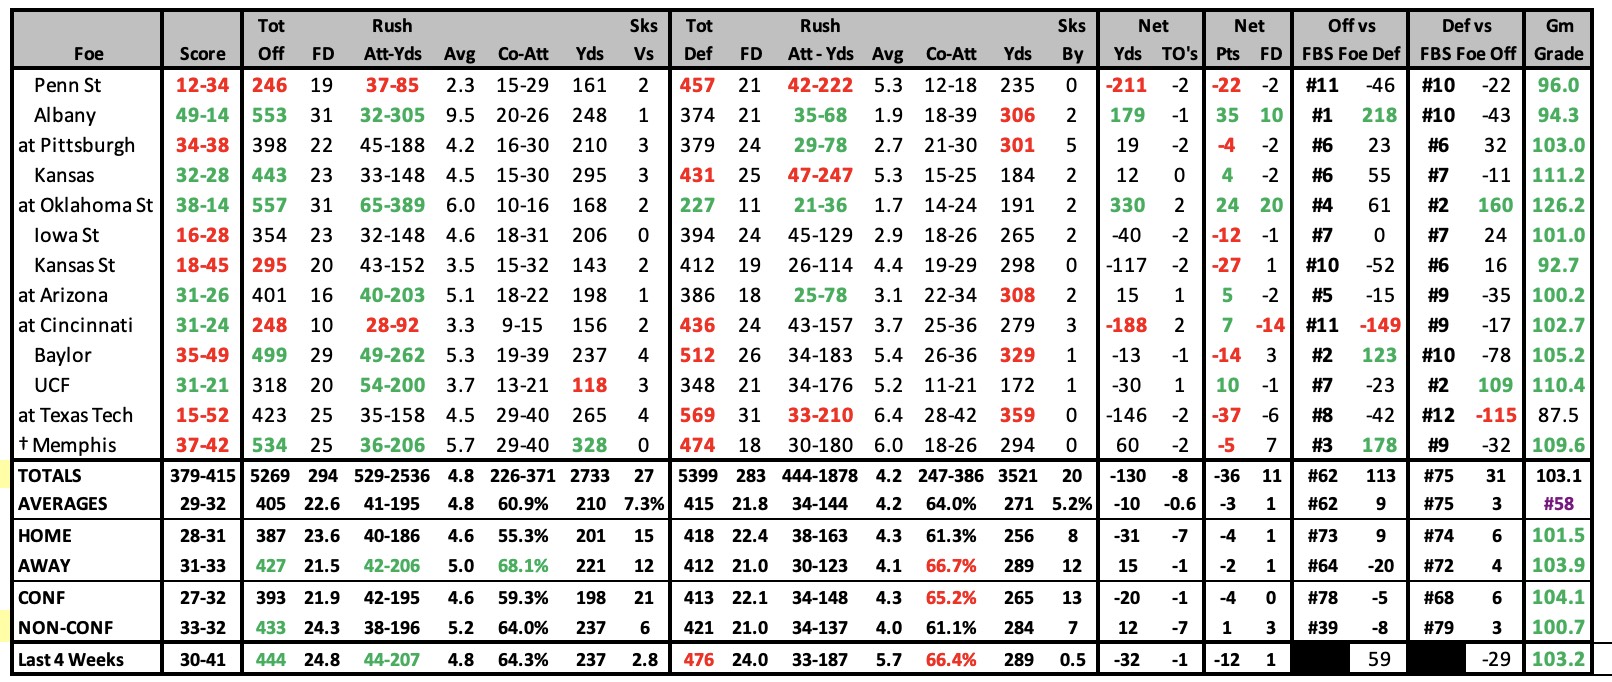
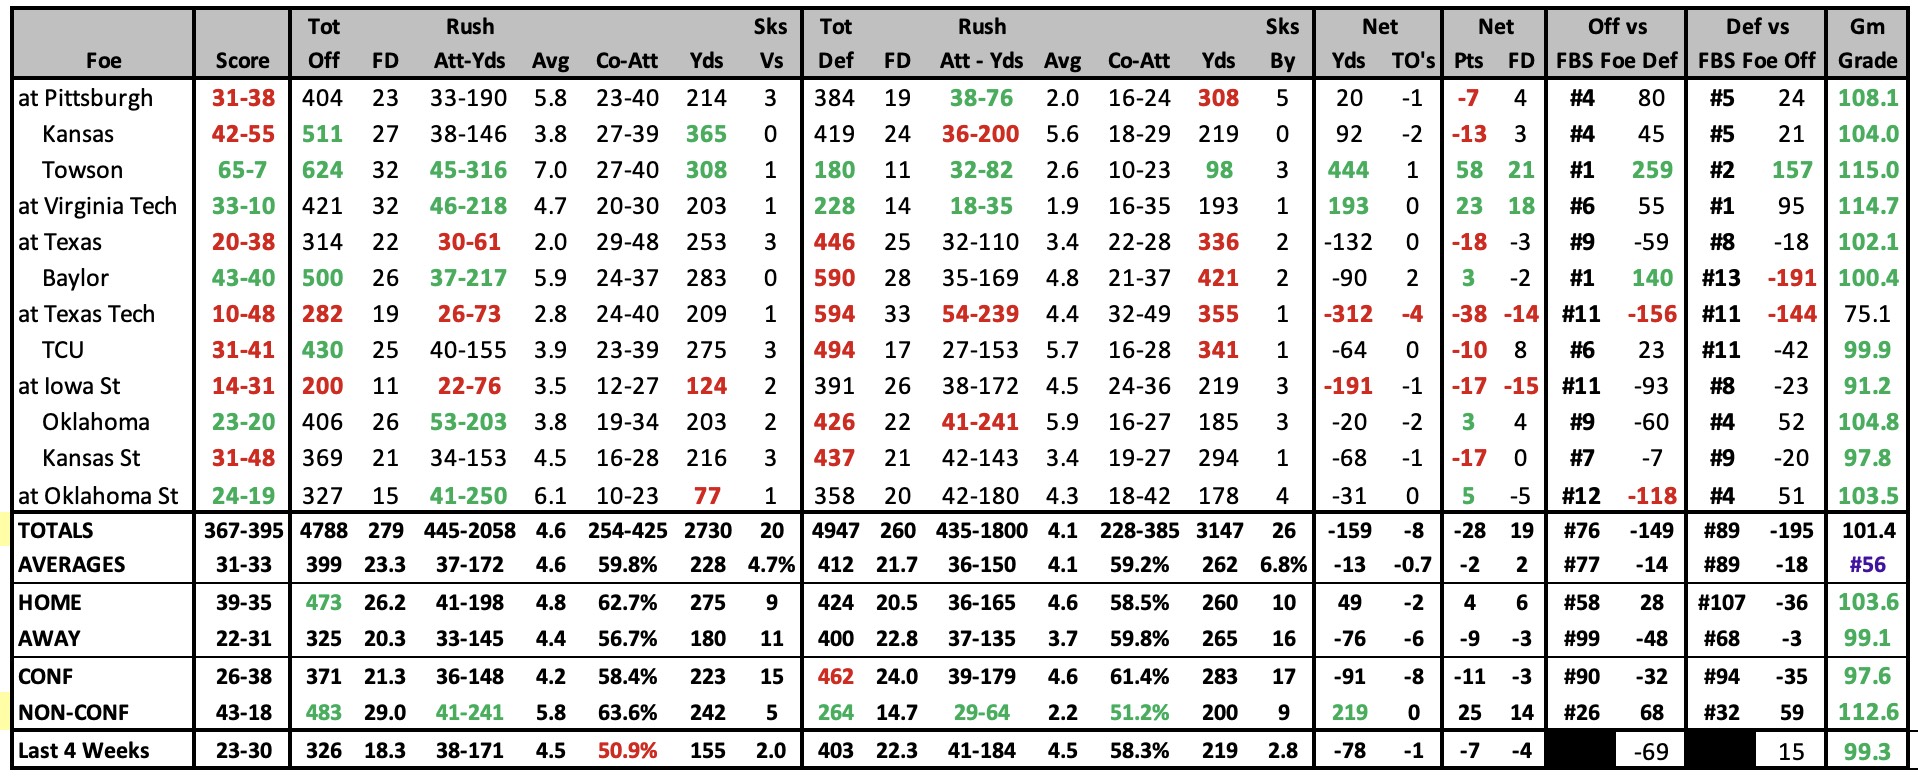
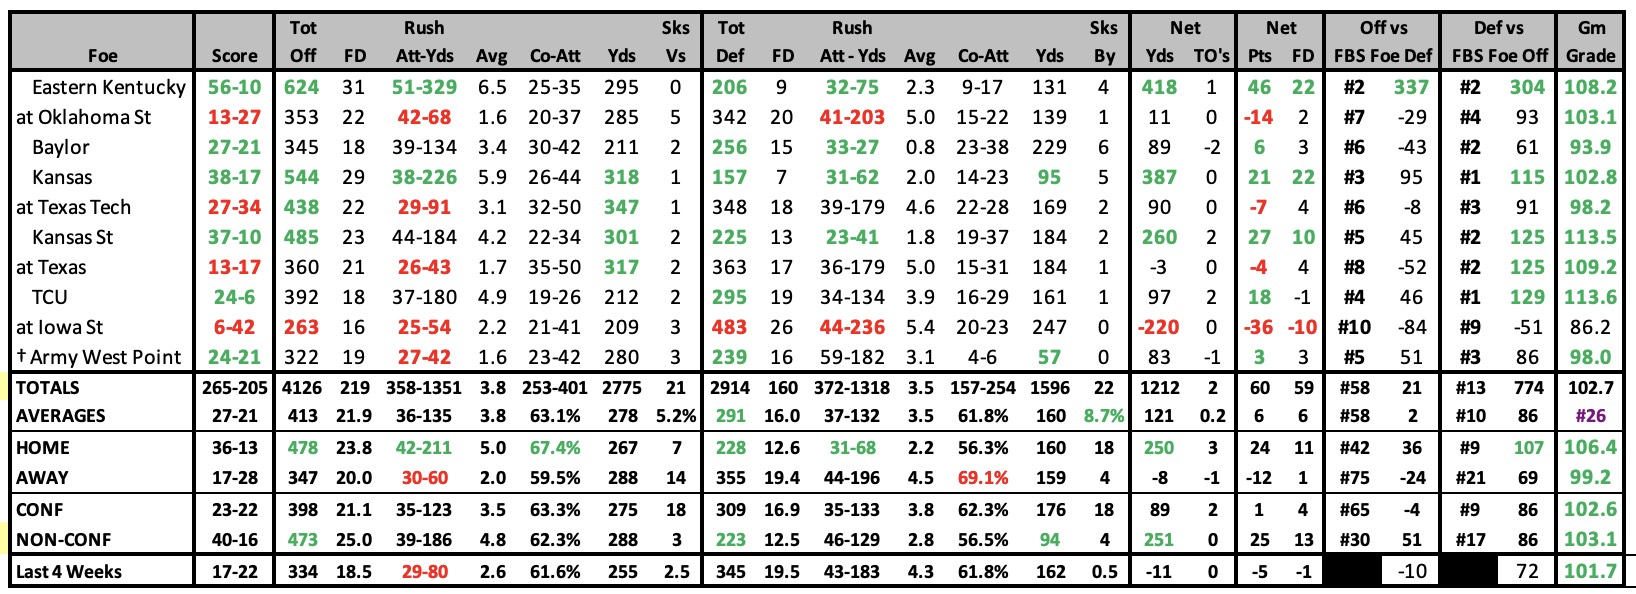
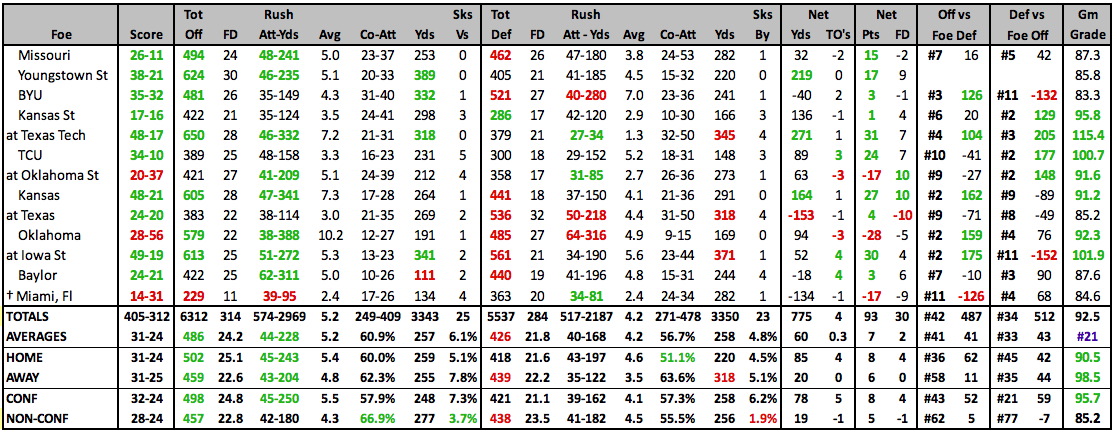
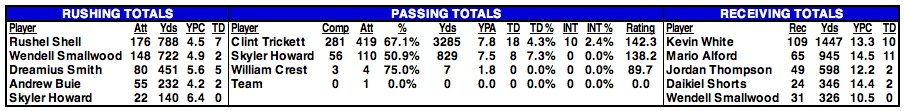
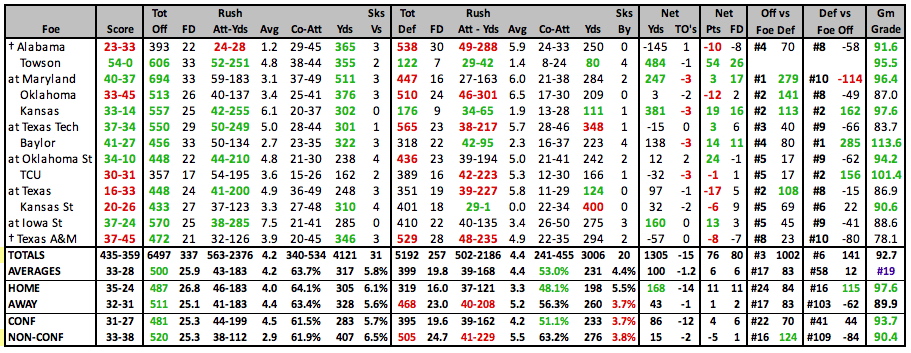
| 2024 GAME-BY-GAME STATS |
|---|
 |
2024 SCHEDULE |
2023 RESULTS |
||||||||||||||||||||||||||||||||||||||||||||||||||||||||||||||||||||||||||||||||||||||||||||||||||||||||||||||||||||||||||||||||||||||||||||||||||||||||||||||||||||||||||||||||||||||||||||||||||||||||||||||||||
|
|
||||||||||||||||||||||||||||||||||||||||||||||||||||||||||||||||||||||||||||||||||||||||||||||||||||||||||||||||||||||||||||||||||||||||||||||||||||||||||||||||||||||||||||||||||||||||||||||||||||||||||||||||||
| 2023 STATISTICAL LEADERS |
|---|
| 2023 GAME-BY-GAME STATS |
|---|
 |
2023 SCHEDULE |
2022 RESULTS |
||||||||||||||||||||||||||||||||||||||||||||||||||||||||||||||||||||||||||||||||||||||||||||||||||||||||||||||||||||||||||||||||||||||||||||||||||||||||||||||||||||||||||||||||||||||||||||||||
|
|
||||||||||||||||||||||||||||||||||||||||||||||||||||||||||||||||||||||||||||||||||||||||||||||||||||||||||||||||||||||||||||||||||||||||||||||||||||||||||||||||||||||||||||||||||||||||||||||||
| 2022 STATISTICAL LEADERS |
|---|
| 2022 GAME-BY-GAME STATS |
|---|
 |
2022 SCHEDULE |
2021 RESULTS |
||||||||||||||||||||||||||||||||||||||||||||||||||||||||||||||||||||||||||||||||||||||||||||||||||||||||||||||||||||||||||||||||||||||||||||||||||||||||||||||||||||||||||||||||||||||||||||||||
|
|
||||||||||||||||||||||||||||||||||||||||||||||||||||||||||||||||||||||||||||||||||||||||||||||||||||||||||||||||||||||||||||||||||||||||||||||||||||||||||||||||||||||||||||||||||||||||||||||||
| 2021 STATISTICAL LEADERS |
|---|
| 2021 GAME-BY-GAME STATS |
|---|
 |
2021 SCHEDULE |
2020 RESULTS |
||||||||||||||||||||||||||||||||||||||||||||||||||||||||||||||||||||||||||||||||||||||||||||||||||||||||||||||||||||||||||||||||||||||||||||||||||||||||||||||||||||||||||||||||||||||||||||||||
|
|
||||||||||||||||||||||||||||||||||||||||||||||||||||||||||||||||||||||||||||||||||||||||||||||||||||||||||||||||||||||||||||||||||||||||||||||||||||||||||||||||||||||||||||||||||||||||||||||||
| 2020 STATISTICAL LEADERS |
|---|
| 2020 GAME-BY-GAME STATS |
|---|
 |
2020 SCHEDULE |
2019 RESULTS |
||||||||||||||||||||||||||||||||||||||||||||||||||||||||||||||||||||||||||||||||||||||||||||||||||||||||||||||||||||||||||||||||||||||||||||||||||||||||||||||||||||||||||||||||||||||||||||||||
|
|
||||||||||||||||||||||||||||||||||||||||||||||||||||||||||||||||||||||||||||||||||||||||||||||||||||||||||||||||||||||||||||||||||||||||||||||||||||||||||||||||||||||||||||||||||||||||||||||||
| 2019 STATISTICAL LEADERS |
|---|
| 2019 GAME-BY-GAME STATS |
|---|
 |
2019 SCHEDULE |
2018 RESULTS |
||||||||||||||||||||||||||||||||||||||||||||||||||||||||||||||||||||||||||||||||||||||||||||||||||||||||||||||||||||||||||||||||||||||||||||||||||||||||||||||||||||||||||||||||||||||||||||||||||||||||||||||||
|
|
||||||||||||||||||||||||||||||||||||||||||||||||||||||||||||||||||||||||||||||||||||||||||||||||||||||||||||||||||||||||||||||||||||||||||||||||||||||||||||||||||||||||||||||||||||||||||||||||||||||||||||||||
| 2018 STATISTICAL LEADERS |
|---|
| 2018 GAME-BY-GAME STATS |
|---|
 |
2018 SCHEDULE |
2017 RESULTS |
|||||||||||||||||||||||||||||||||||||||||||||||||||||||||||||||||||||||||||||||||||||||||||||||||||||||||||||||||||||||||||||||||||||||||||||||||||||||||||||||||||||||||||||||||||||||||||||||||||||||||||||||||||||||||||||||||||||||
|
|
|||||||||||||||||||||||||||||||||||||||||||||||||||||||||||||||||||||||||||||||||||||||||||||||||||||||||||||||||||||||||||||||||||||||||||||||||||||||||||||||||||||||||||||||||||||||||||||||||||||||||||||||||||||||||||||||||||||||
| 2017 STATISTICAL LEADERS |
|---|
| 2017 GAME-BY-GAME STATS |
|---|
 |
2017 SCHEDULE |
2016 RESULTS |
||||||||||||||||||||||||||||||||||||||||||||||||||||||||||||||||||||||||||||||||||||||||||||||||||||||||||||||||||||||||||||||||||||||||||||||||||||||||||||||||||||||||||||||||||||||||||||||||||||||||||||||||||||||||||||||||||||||||||||||
|
|
||||||||||||||||||||||||||||||||||||||||||||||||||||||||||||||||||||||||||||||||||||||||||||||||||||||||||||||||||||||||||||||||||||||||||||||||||||||||||||||||||||||||||||||||||||||||||||||||||||||||||||||||||||||||||||||||||||||||||||||
| 2016 STATISTICAL LEADERS |
|---|
| 2016 GAME-BY-GAME STATS |
|---|
 |
| 2015 STATISTICAL LEADERS |
|---|
| 2015 GAME-BY-GAME STATS |
|---|
 |
2015 SCHEDULE |
2014 RESULTS |
||||||||||||||||||||||||||||||||||||||||||||||||||||||||||||||||||||||||||||||||||||||||||||||||||||||||||||||||||||||||||||||||||||||||||||||||||||||||||||||||||||||||||||||||||||||||||||||||||||||||||||||||||||||||||||||||||||||||||||||
|
|
||||||||||||||||||||||||||||||||||||||||||||||||||||||||||||||||||||||||||||||||||||||||||||||||||||||||||||||||||||||||||||||||||||||||||||||||||||||||||||||||||||||||||||||||||||||||||||||||||||||||||||||||||||||||||||||||||||||||||||||
| 2014 STATISTICAL LEADERS |
|---|
| 2014 GAME-BY-GAME STATS |
|---|
 |
| 2013 STATISTICAL LEADERS |
|---|
| Player | Att | Yds | YPC | TD | Player | Comp | Att | % | Yds | YPA | TD | INT | Rating | Player | Rec | Yds | YPC | TD |
| Charles Sims | 208 | 1095 | 5.3 | 11 | Clint Trickett | 123 | 233 | 52.8% | 1605 | 6.9 | 7 | 7 | 114.6 | Mario Alford | 27 | 552 | 20.4 | 2 |
| Dreamius Smith | 103 | 494 | 4.8 | 5 | Paul Millard | 92 | 168 | 54.8% | 1119 | 6.7 | 6 | 6 | 115.4 | Kevin White | 35 | 507 | 14.5 | 5 |
| Wendell Smallwood | 39 | 221 | 5.7 | 1 | Ford Childress | 36 | 63 | 57.1% | 421 | 6.7 | 3 | 3 | 119.5 | Dakiel Shorts | 45 | 495 | 11.0 | 2 |
| 2013 GAME-BY-GAME STATS |
|---|
 |
2013 SCHEDULE |
2012 RESULTS |
|||||||||||||||||||||||||||||||||||||||||||||||||||||||||||||||||||||||||||||||||||||||||||||||||||||||||||||||||||||||||||||||||||||||||||||||||||||||||||||||||||||||||||||||||||||||||||||||||||||||||||||||||||||||||||||||||||||||||||||||||||||||||||||||||||||||||
|
|
|||||||||||||||||||||||||||||||||||||||||||||||||||||||||||||||||||||||||||||||||||||||||||||||||||||||||||||||||||||||||||||||||||||||||||||||||||||||||||||||||||||||||||||||||||||||||||||||||||||||||||||||||||||||||||||||||||||||||||||||||||||||||||||||||||||||||
| 2012 STATISTICAL LEADERS |
|---|
| Player | Att | Yds | YPC | TD | Player | Comp | Att | % | Yds | YPA | TD | INT | Rating | Player | Rec | Yds | YPC | TD | ||
| Andrew Buie | 181 | 849 | 4.7 | 7 | Geno Smith | 363 | 511 | 71.0% | 4190 | 8.2 | 41 | 6 | 164.0 | Stedman Bailey | 113 | 1628 | 14.4 | 25 | ||
| Tavon Austin | 75 | 659 | 8.8 | 4 | Paul Millard | 9 | 18 | 50.0% | 87 | 4.8 | 2 | 1 | 116.2 | Tavon Austin | 110 | 1282 | 11.7 | 11 | ||
| Shawne Alston | 76 | 388 | 5.1 | 7 | Dustin Garrison | 0 | 1 | 0.0% | 0 | 0.0 | 0 | 0 | 0.0 | JD Woods | 61 | 637 | 10.4 | 4 |
| 2012 INDIVIDUAL PLAYER STATS • 2012 Start Chart/Starters Lost |
|---|
| 2012 GAME-BY-GAME STATS |
|---|
 |
| 2011 STATISTICAL LEADERS |
|---|
| Player | Att | Yds | YPC | TD | Player | Comp | Att | % | Yds | YPA | TD | INT | Rating | Player | Rec | Yds | YPC | TD | ||
| Dustin Garrison | 136 | 741 | 5.4 | 6 | Geno Smith | 345 | 524 | 65.8% | 4379 | 8.4 | 31 | 7 | 152.9 | Stedman Bailey | 72 | 1279 | 17.8 | 12 | ||
| Shawne Alston | 97 | 416 | 4.3 | 12 | Paul Millard | 7 | 15 | 46.7% | 124 | 8.3 | 1 | 2 | 111.4 | Tavon Austin | 100 | 1180 | 11.8 | 8 | ||
| Tavon Austin | 17 | 188 | 11.1 | 1 | Team | 0 | 1 | 0.0% | 0 | 0.0 | 0 | 0 | 0.0 | Ivan McCartney | 49 | 585 | 11.9 | 3 |
| 2011 INDIVIDUAL PLAYER STATS • 2011 START CHARTS/STARTERS LOST |
|---|
| 2011 GAME-BY-GAME STATS |
|---|
2011 RESULTS |
2010 RESULTS |
|||||||||||||||||||||||||||||||||||||||||||||||||||||||||||||||||||||||||||||||||||||||||||||||||||||||||
|
||||||||||||||||||||||||||||||||||||||||||||||||||||||||||||||||||||||||||||||||||||||||||||||||||||||||||
| 2010 STATISTICAL LEADERS |
|---|
| Player | Att | Yds | YPC | TD | Player | Comp | Att | % | Yds | YPA | TD | INT | Rating | Player | Rec | Yds | YPC | TD | ||
| Noel Devine | 209 | 936 | 4.5 | 6 | Geno Smith | 241 | 372 | 64.8% | 2765 | 7.4 | 24 | 7 | 144.7 | Tavon Austin | 58 | 787 | 13.6 | 8 | ||
| Ryan Clarke | 80 | 291 | 3.6 | 8 | Barry Brunetti | 4 | 9 | 44.4% | 6 | 0.7 | 0 | 0 | 50.0 | Jock Sanders | 69 | 729 | 10.6 | 4 | ||
| Shawne Alston | 56 | 248 | 4.4 | 0 | Jock Sanders | 0 | 1 | 0.0% | 0 | 0.0 | 0 | 1 | -200.0 | Brad Starks | 19 | 317 | 16.7 | 4 |
| 2010 INDIVIDUAL PLAYER STATS |
|---|
| 2010 GAME-BY-GAME STATS |
|---|
| 2009 STATISTICAL LEADERS |
|---|
| Player | Att | Yds | YPC | TD | Player | Comp | Att | % | Yds | YPA | TD | INT | Rating | Player | Rec | Yds | YPC | TD | ||
| Noel Devine | 225 | 1297 | 5.76 | 12 | Jarrett Brown | 186 | 292 | 63.7% | 2129 | 7.3 | 11 | 8 | 131.9 | Jock Sanders | 70 | 674 | 9.6 | 3 | ||
| Jarrett Brown | 111 | 423 | 3.81 | 5 | Geno Smith | 24 | 34 | 70.6% | 217 | 6.4 | 1 | 1 | 128.0 | Alric Arnett | 42 | 570 | 13.6 | 3 | ||
| Ryan Clarke | 57 | 238 | 4.18 | 7 | Bradley Starks | 1 | 1 | 100.0% | 31 | 31.0 | 0 | 0 | 360.4 | Bradley Starks | 26 | 375 | 14.4 | 2 |
| 2009 GAME-BY-GAME STATS |
|---|
2009 RESULTS |
2008 RESULTS |
||||||||||||||||||||||||||||||||||||||||||||||||||||||||||||||||||||||||||||||||||||||||||||||||||||||||||||||||||||||||||||||||||||||||||||||||||||||||||||||||
|
|
||||||||||||||||||||||||||||||||||||||||||||||||||||||||||||||||||||||||||||||||||||||||||||||||||||||||||||||||||||||||||||||||||||||||||||||||||||||||||||||||
| 2008 INDIVIDUAL PLAYER STATS • 2007 INDIVIDUAL PLAYER STATS |
|---|