
UTSA ROADRUNNERS |
|
STADIUM: Alamodome |
 |
|
| LOCATION: San Antonio, TX | |
| FOUNDED: 1969 | |
| ENROLLMENT: 27,988 | |
| COLORS: Orange & Blue | |
| MASCOT: Rowdy | |
| CONFERENCE: AAC | |
| Head Coach: Jeff Traylor | |
| Yrs with Tm: 6th | |
| Overall Record: 46-20 | |
| Record with Tm: 46-20 |

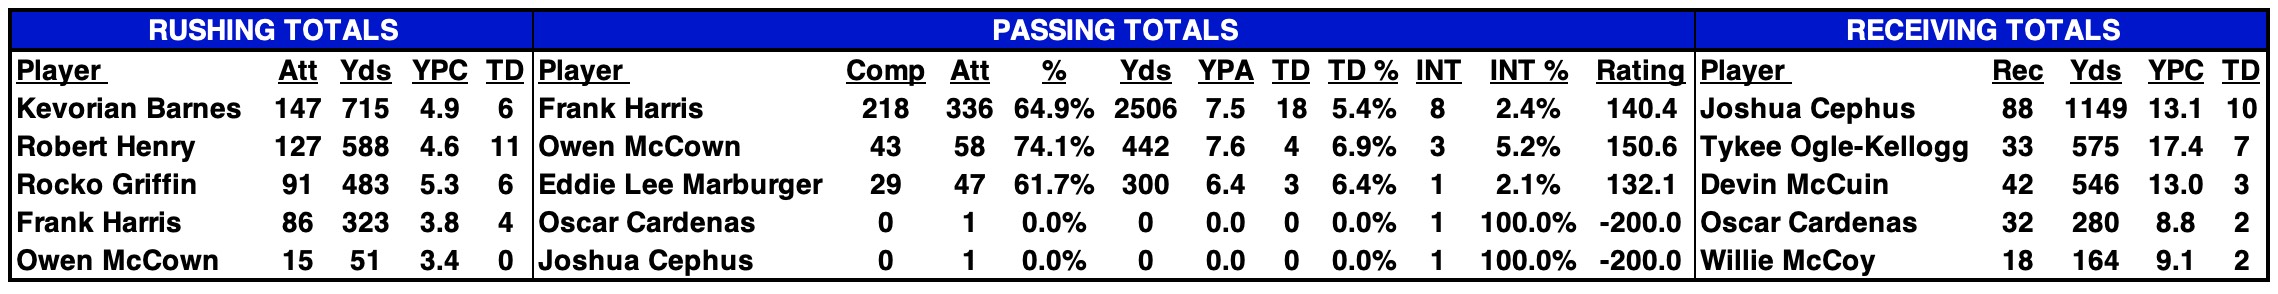
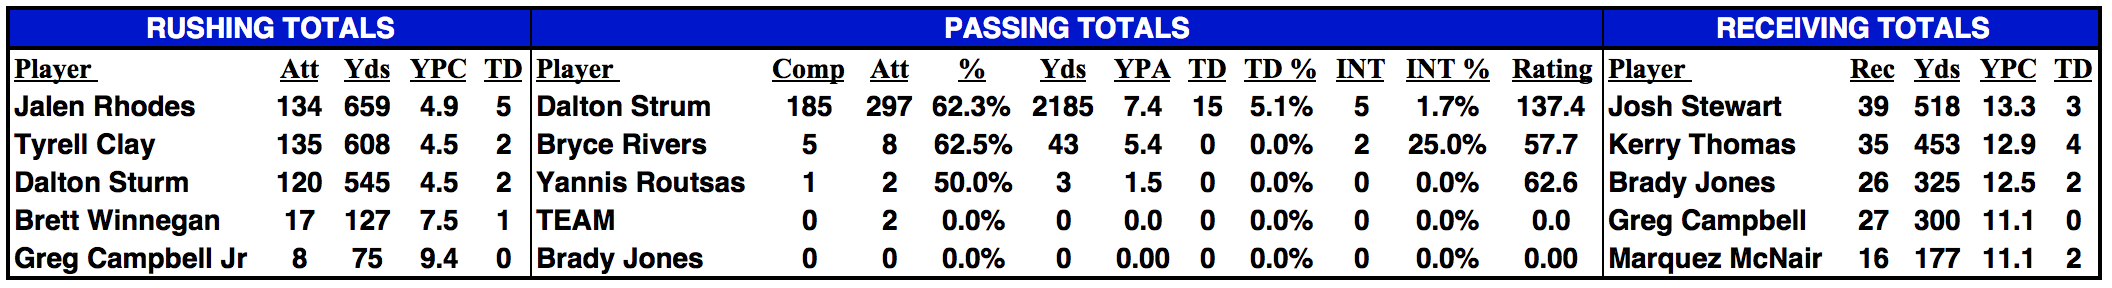
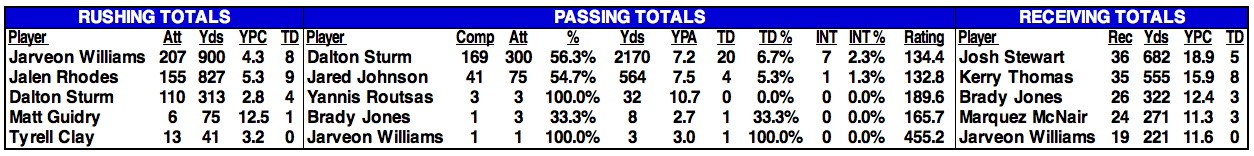
| 2025 Individual Player Stats |
2025 Start Chart | Last 40+ Years Results |
Last 20 Years - Leaders |
Draft History |
|---|
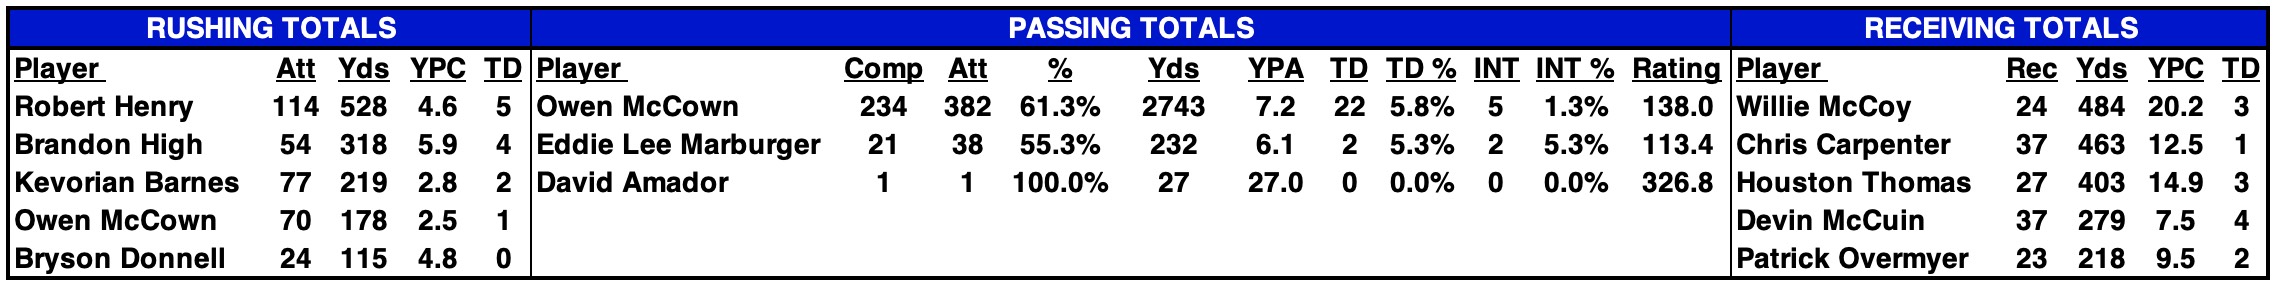
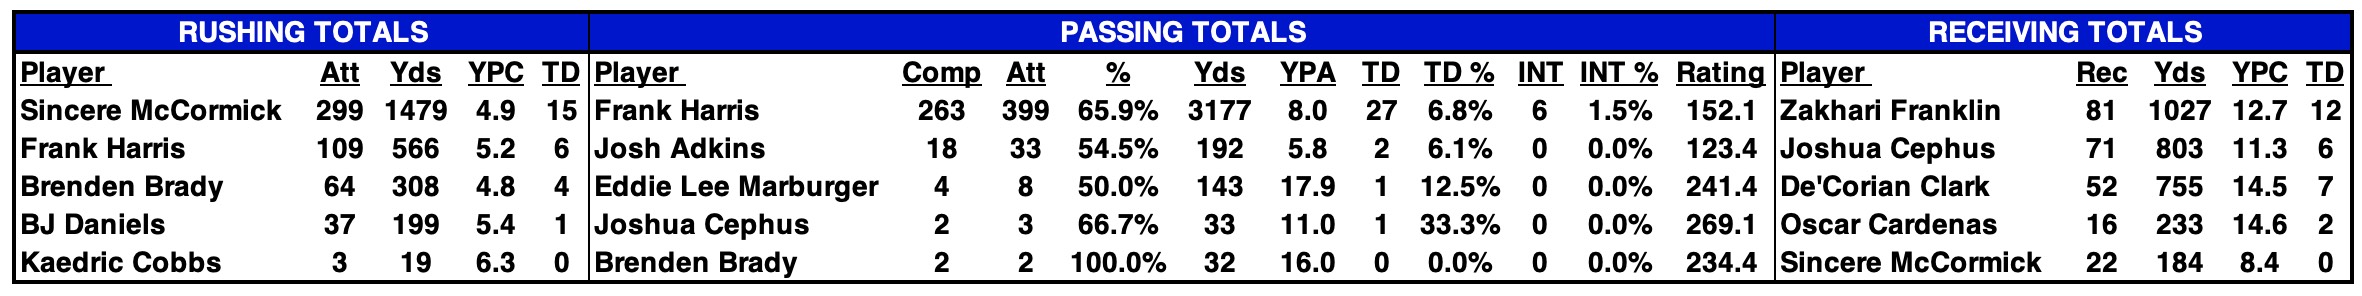
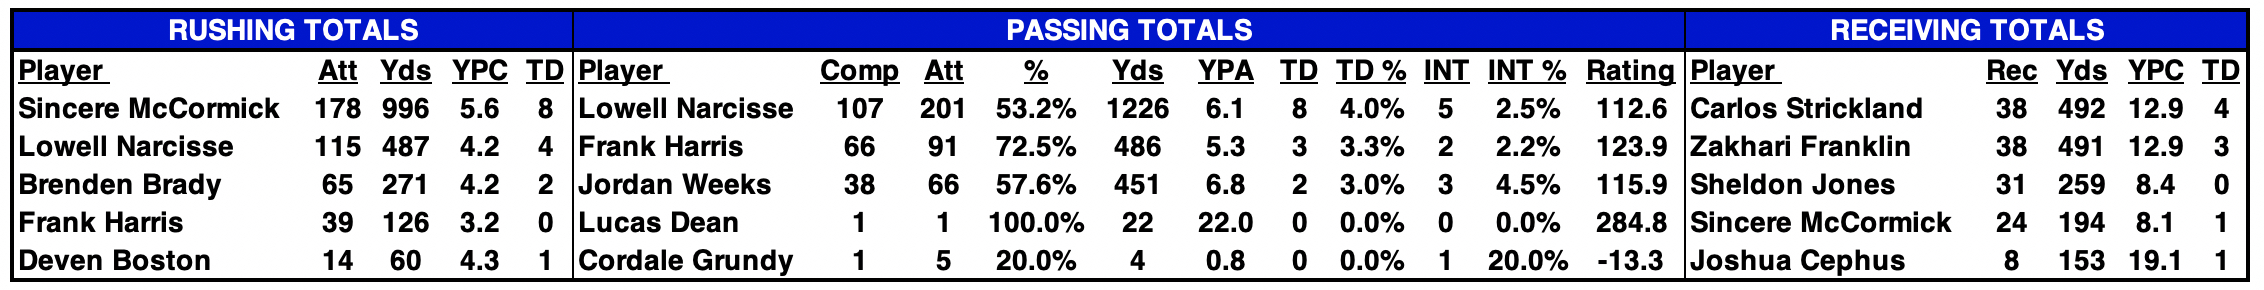
| 2025 STATISTICAL LEADERS |
|---|
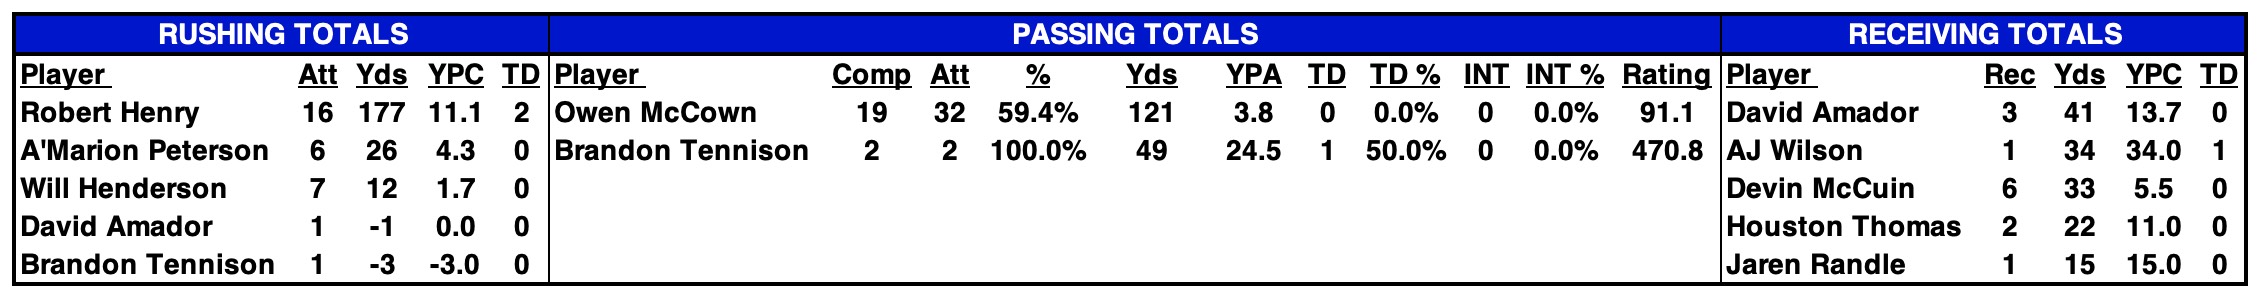
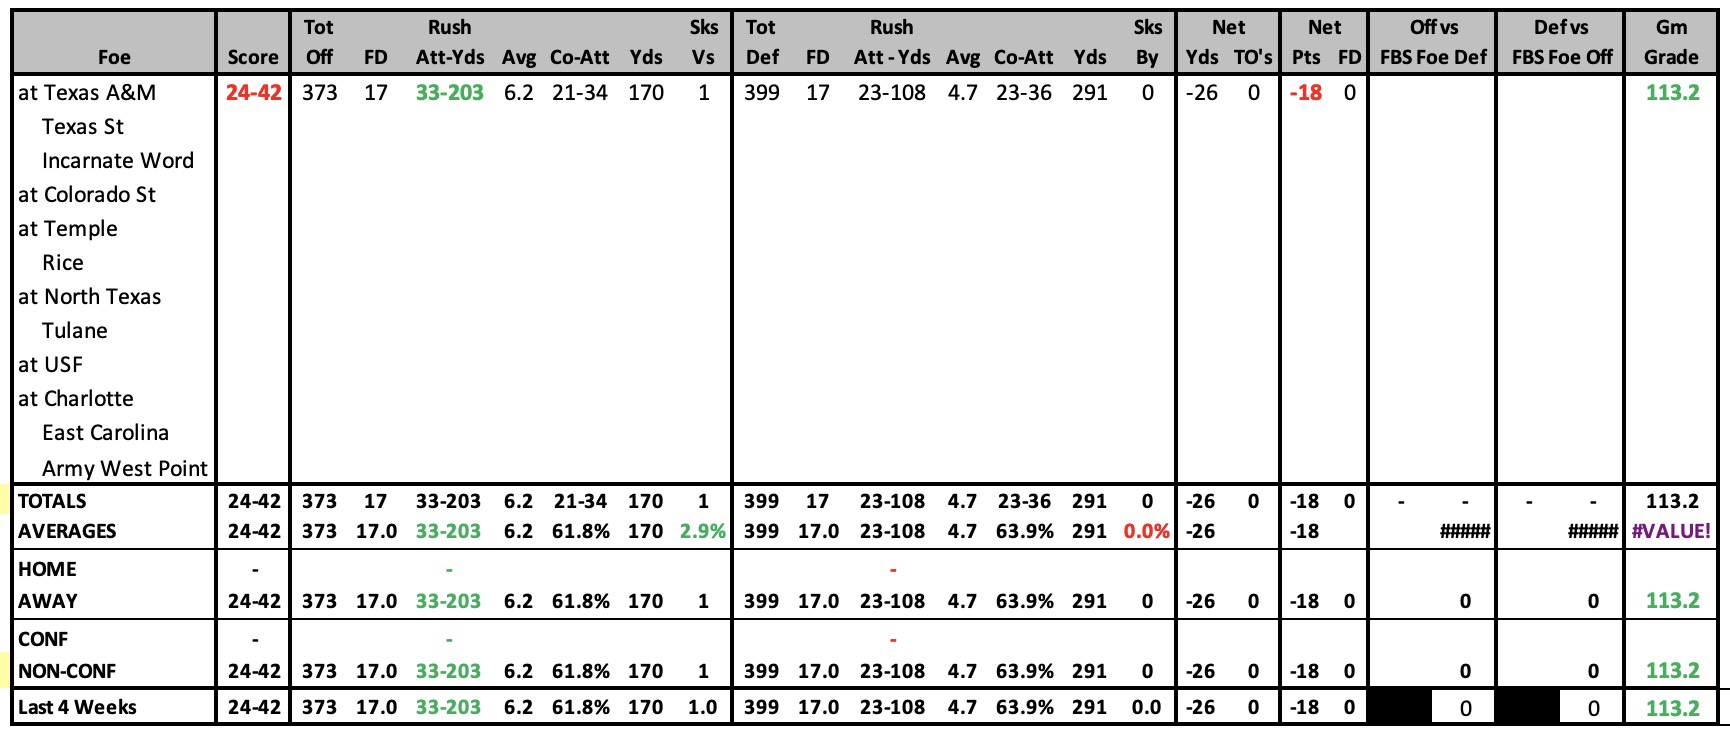
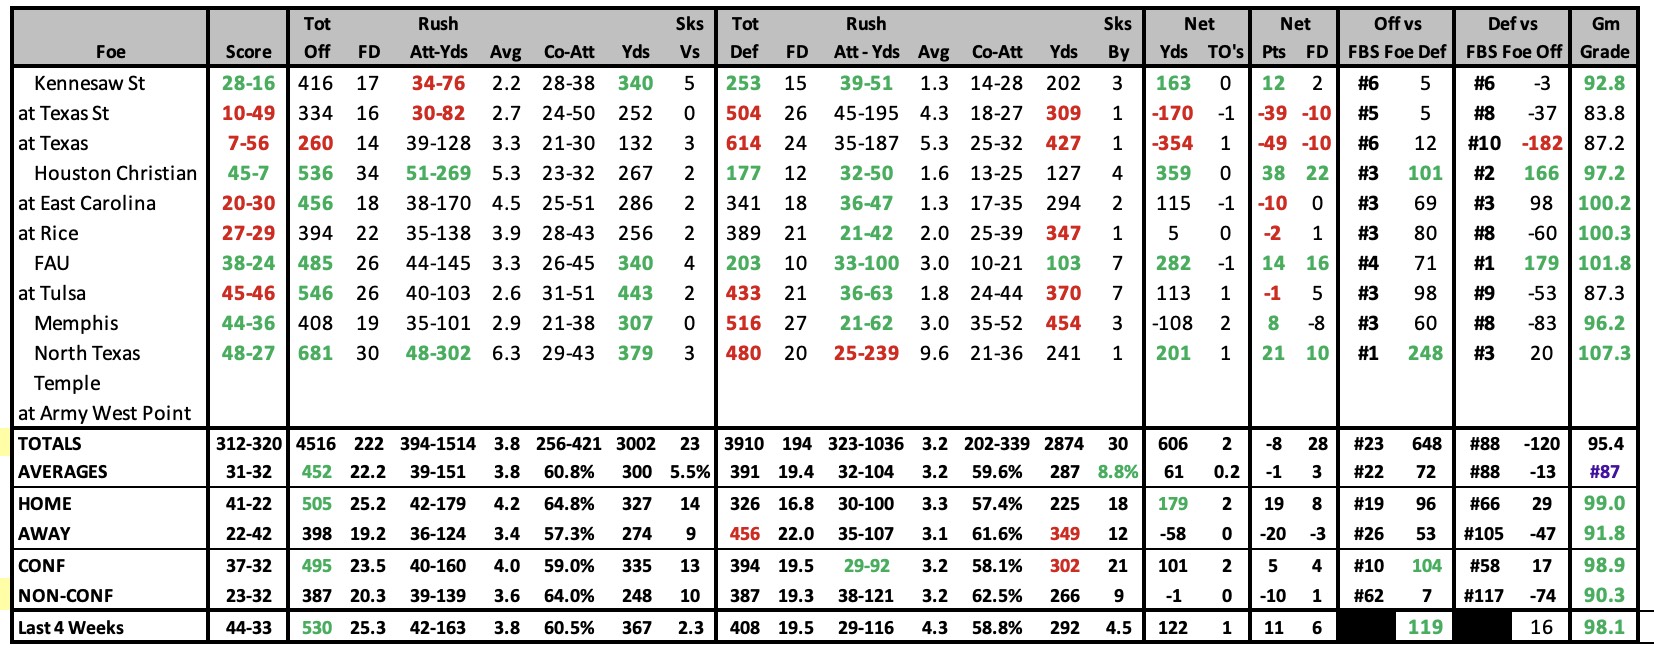
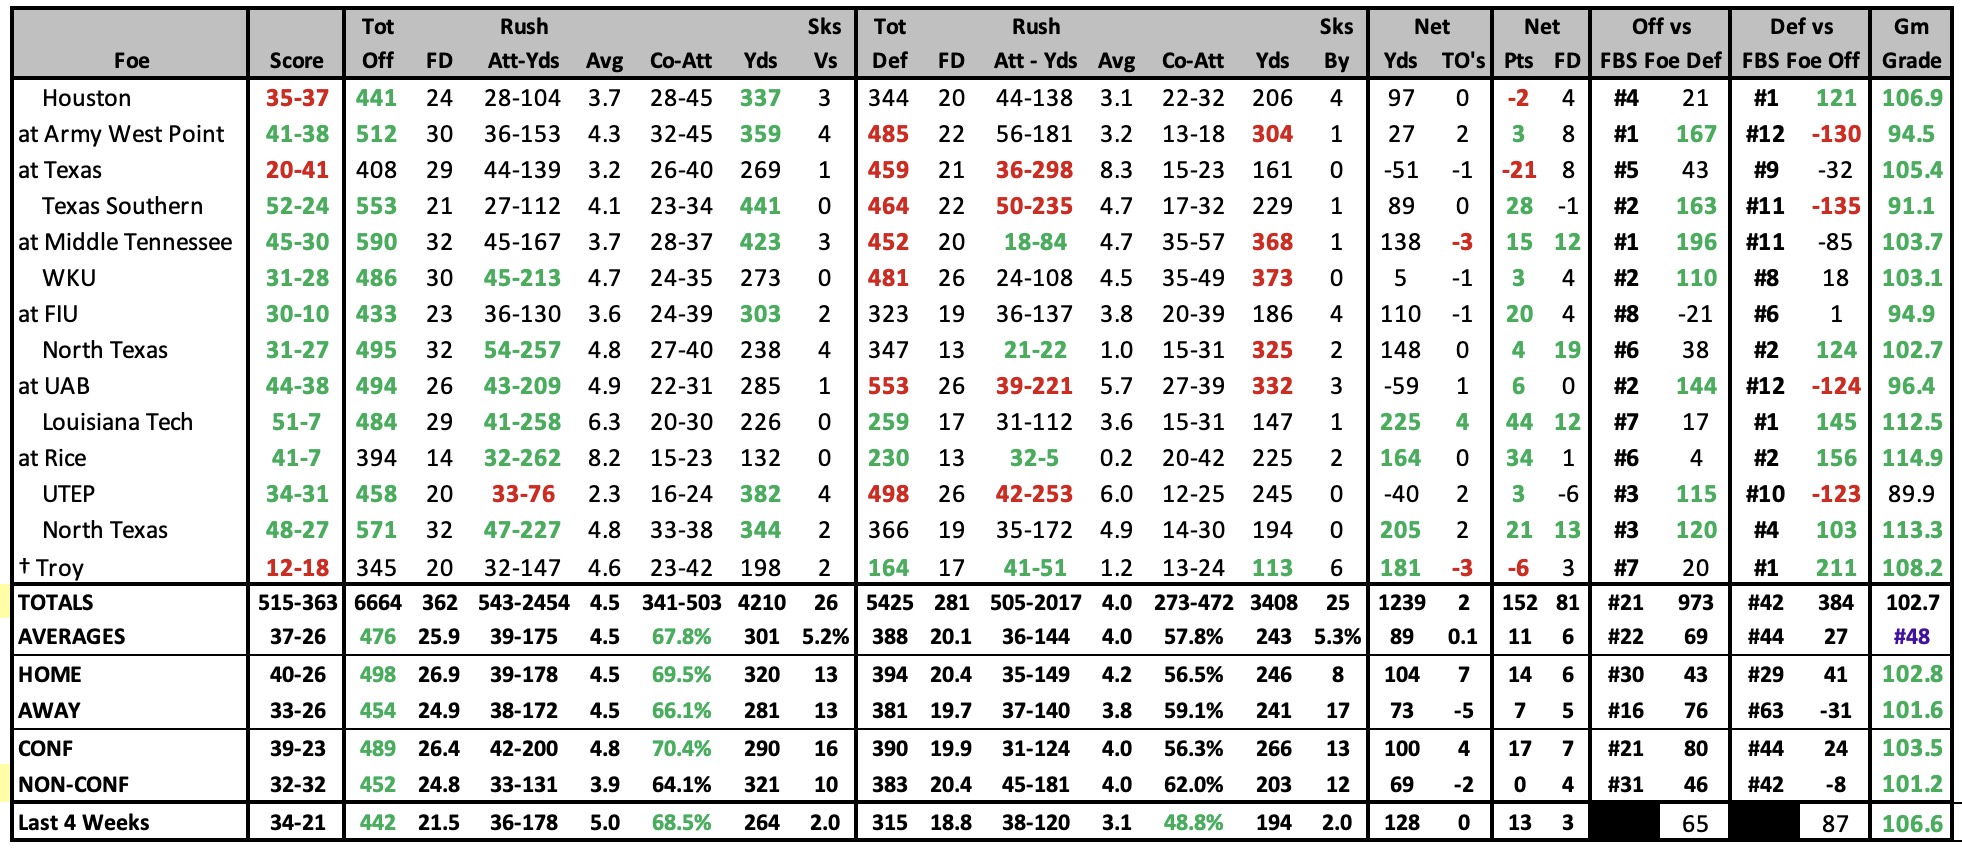
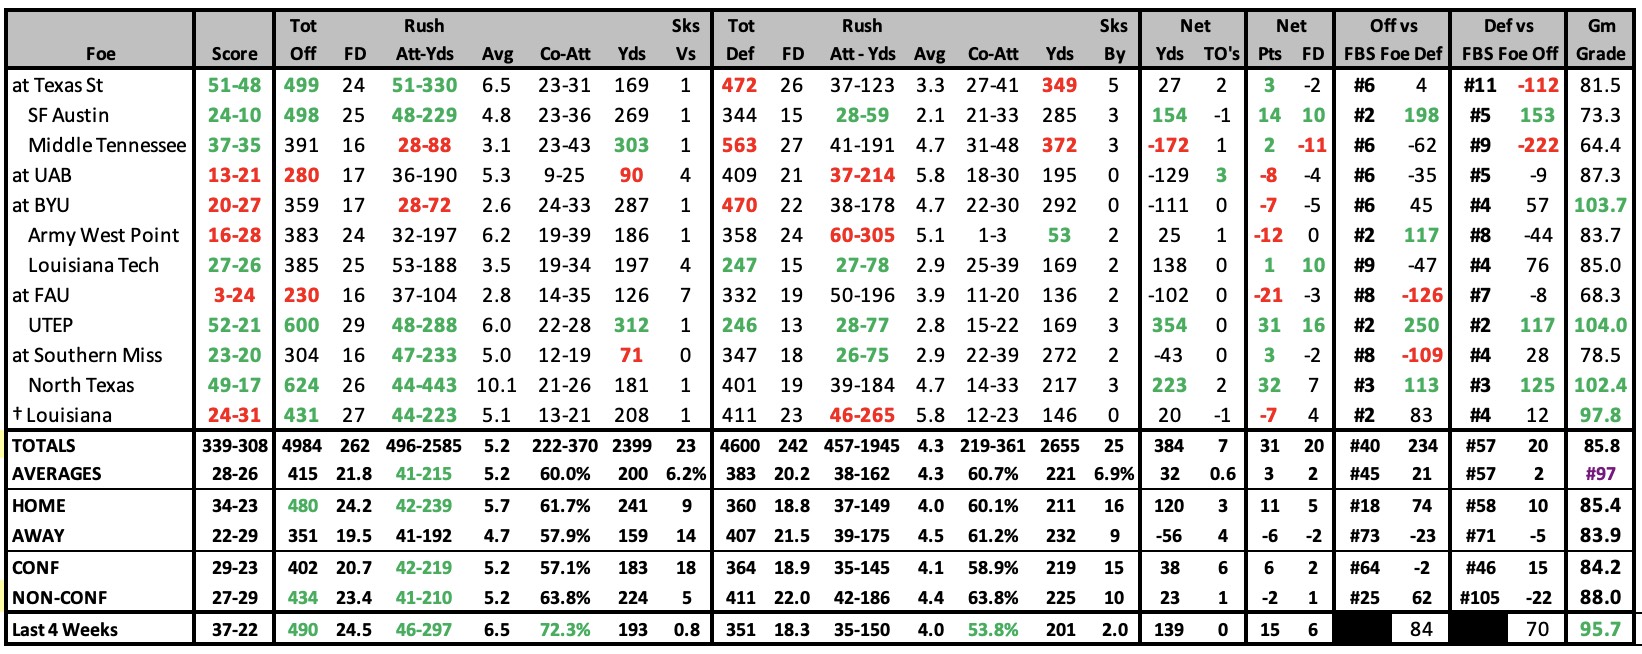
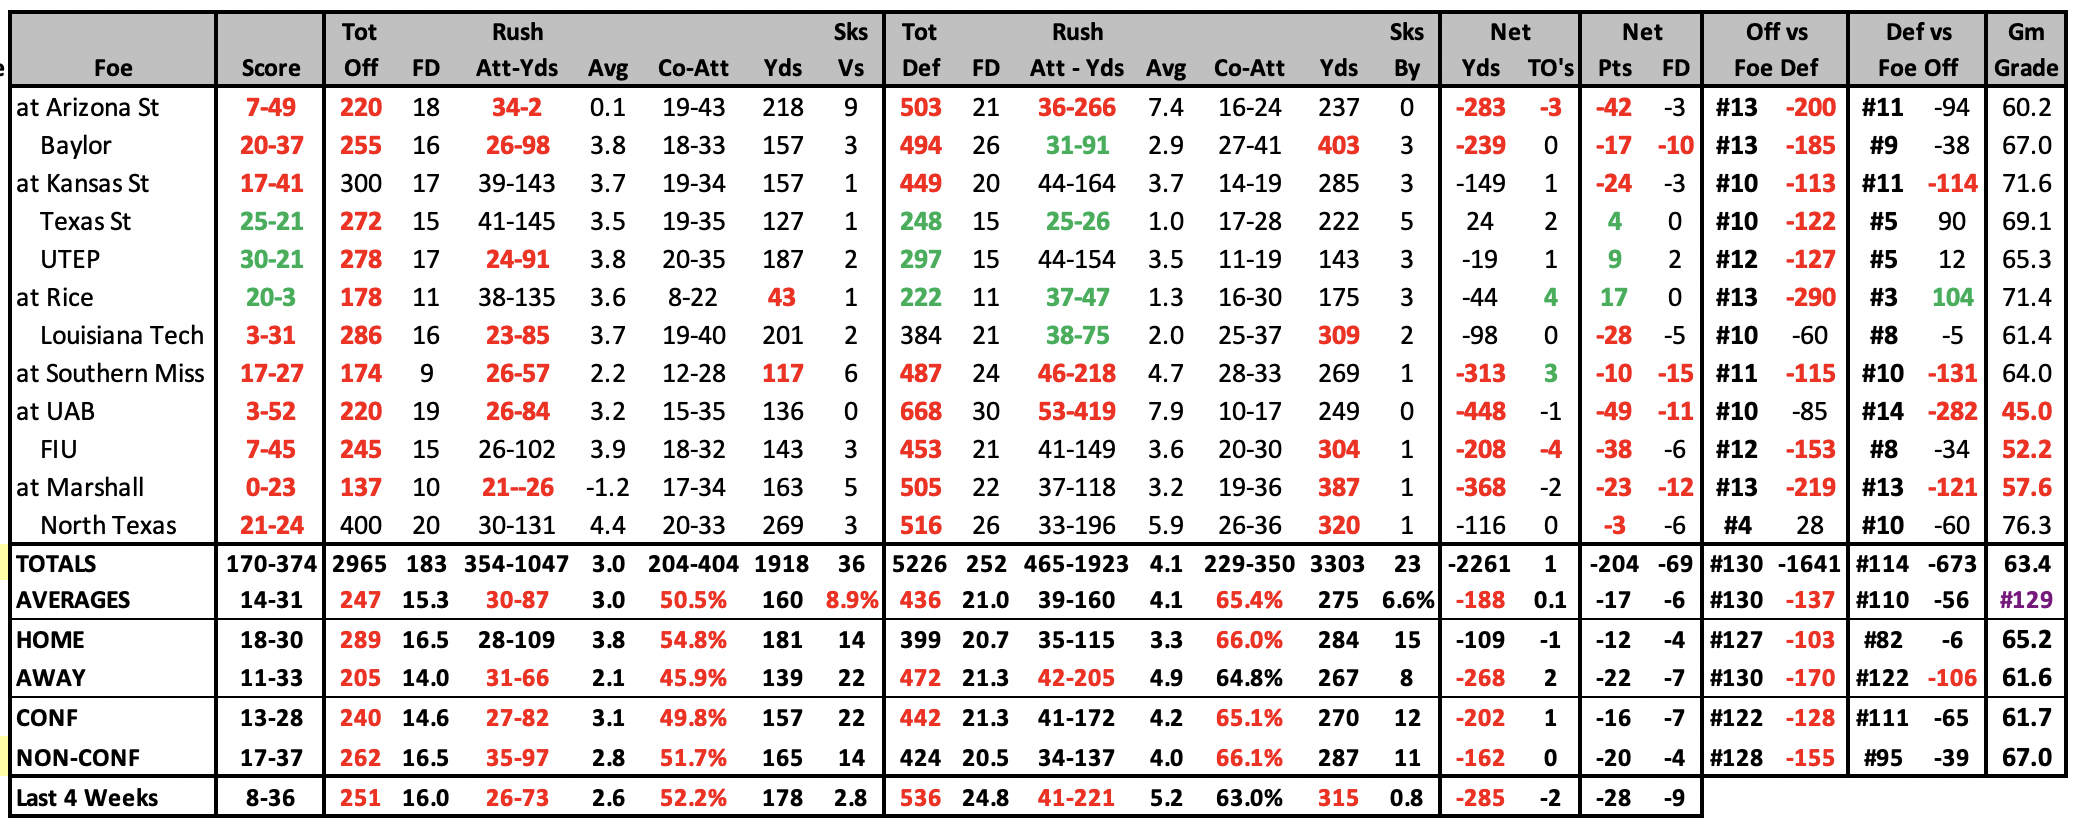
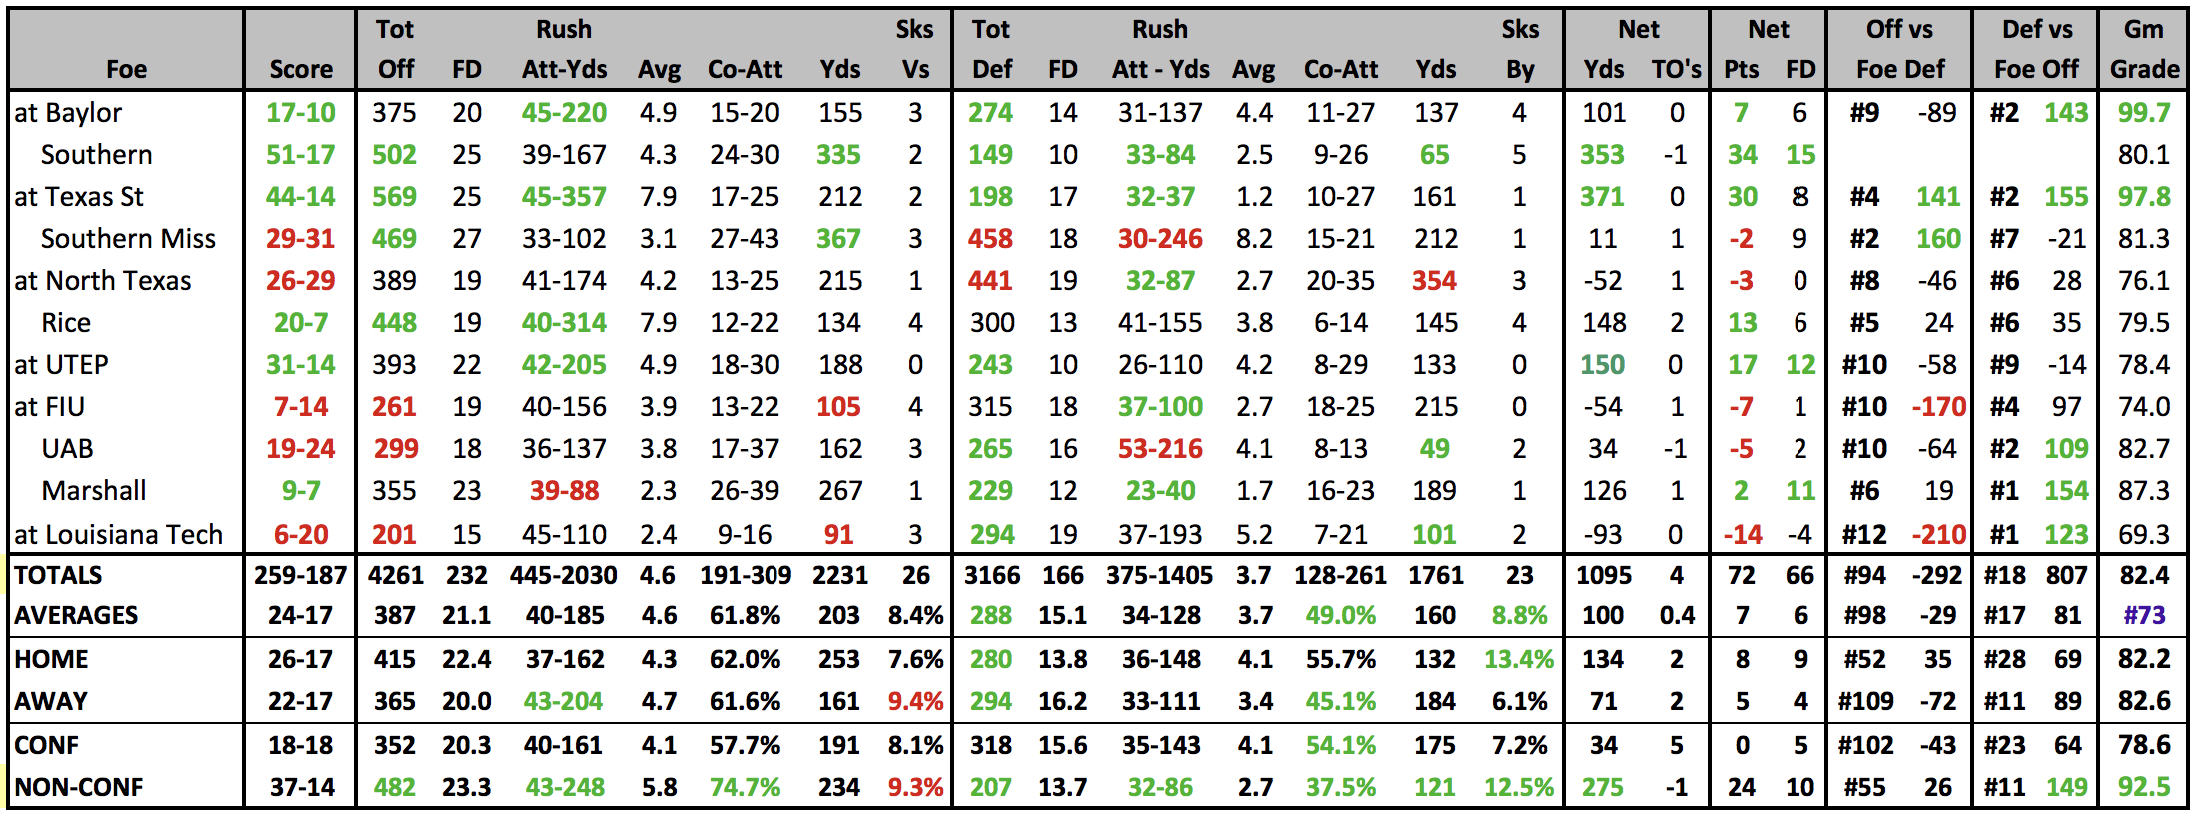
| 2025 GAME-BY-GAME STATS |
|---|
 |
2025 SCHEDULE |
2024 RESULTS |
||||||||||||||||||||||||||||||||||||||||||||||||||||||||||||||||||||||||||||||||||||||||||||||||||||||||||||||||||||||||||||||||||||||||||||||||||||||||||||||||||||||||||||||||||||||||||||||||||||||||||||||||||
|
|
||||||||||||||||||||||||||||||||||||||||||||||||||||||||||||||||||||||||||||||||||||||||||||||||||||||||||||||||||||||||||||||||||||||||||||||||||||||||||||||||||||||||||||||||||||||||||||||||||||||||||||||||||
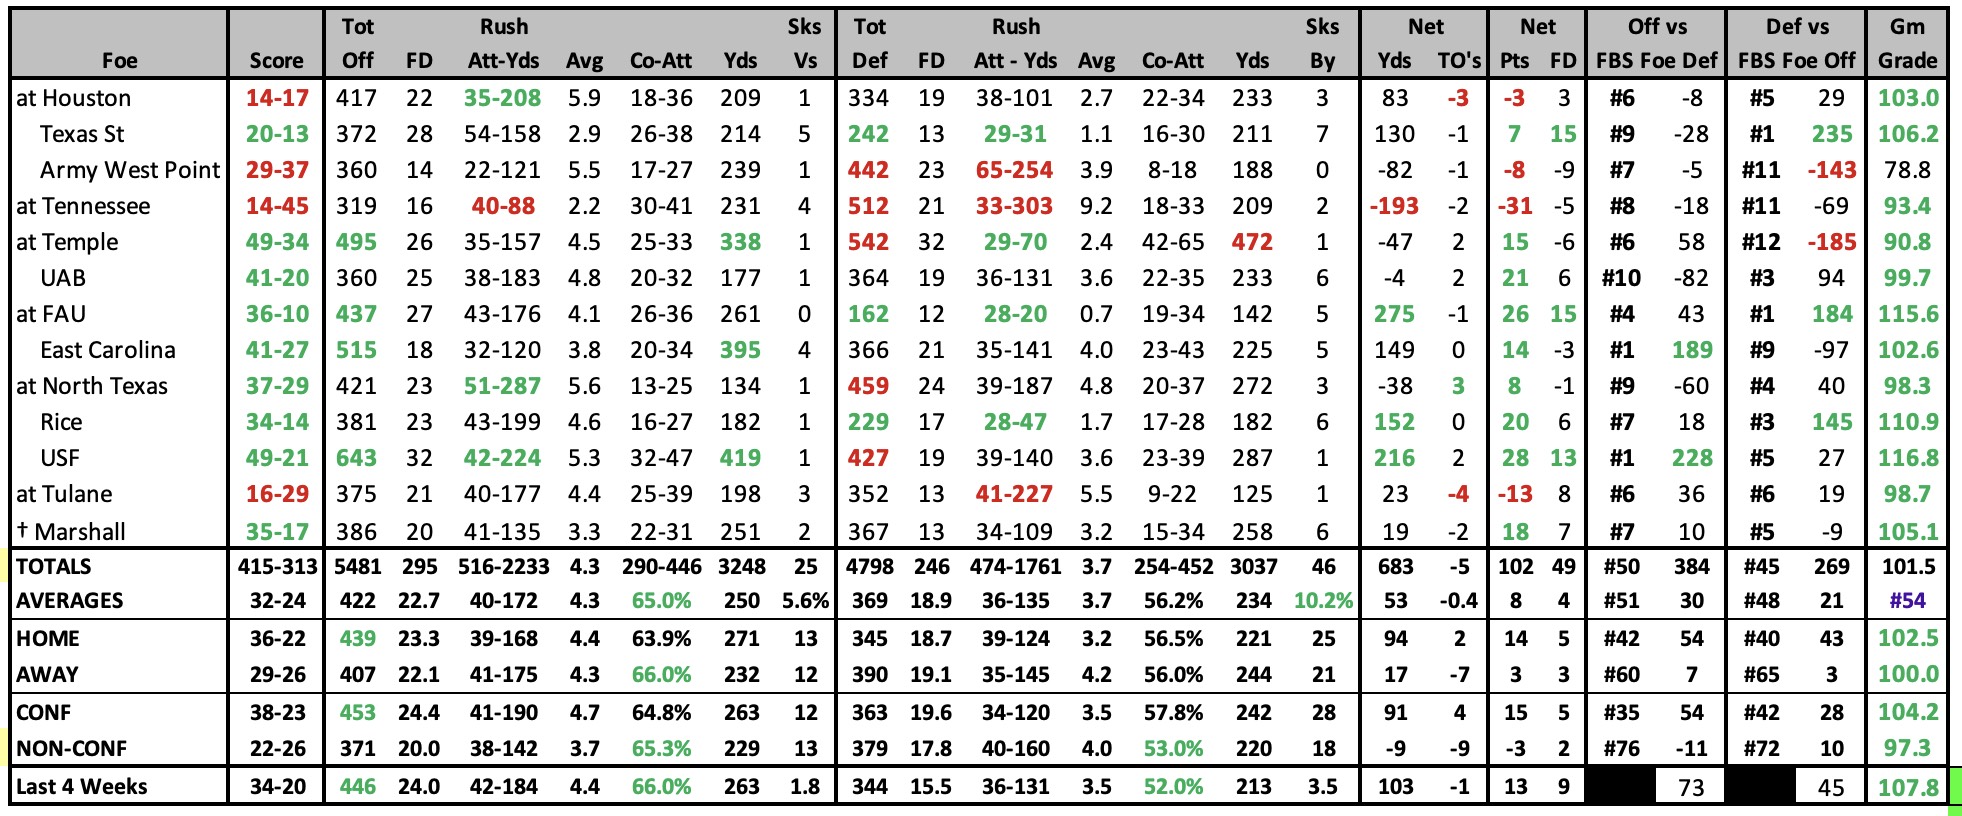
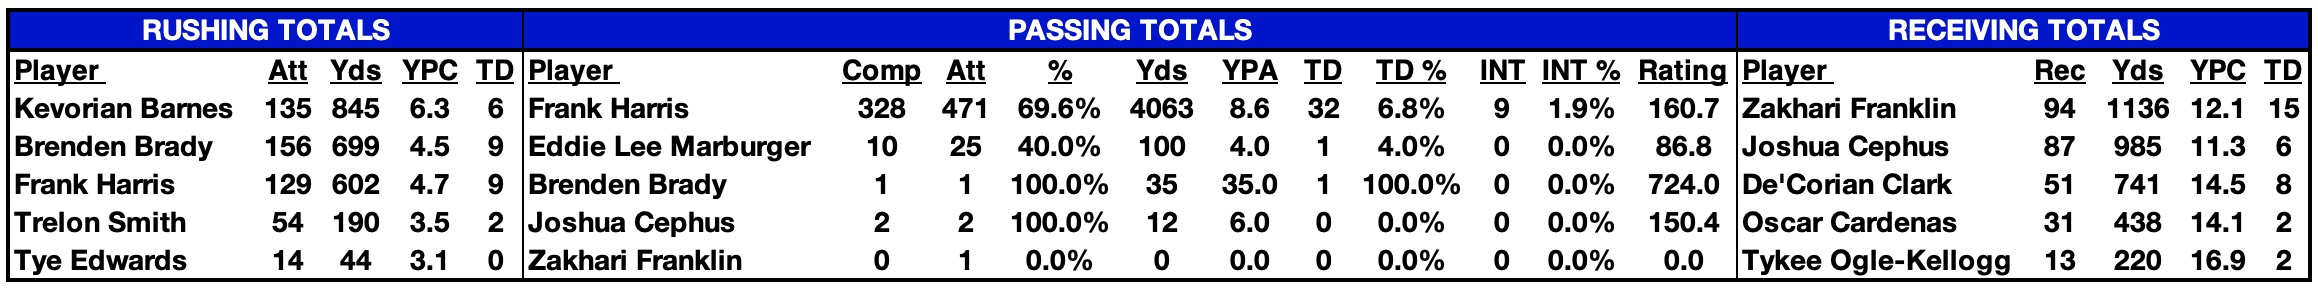
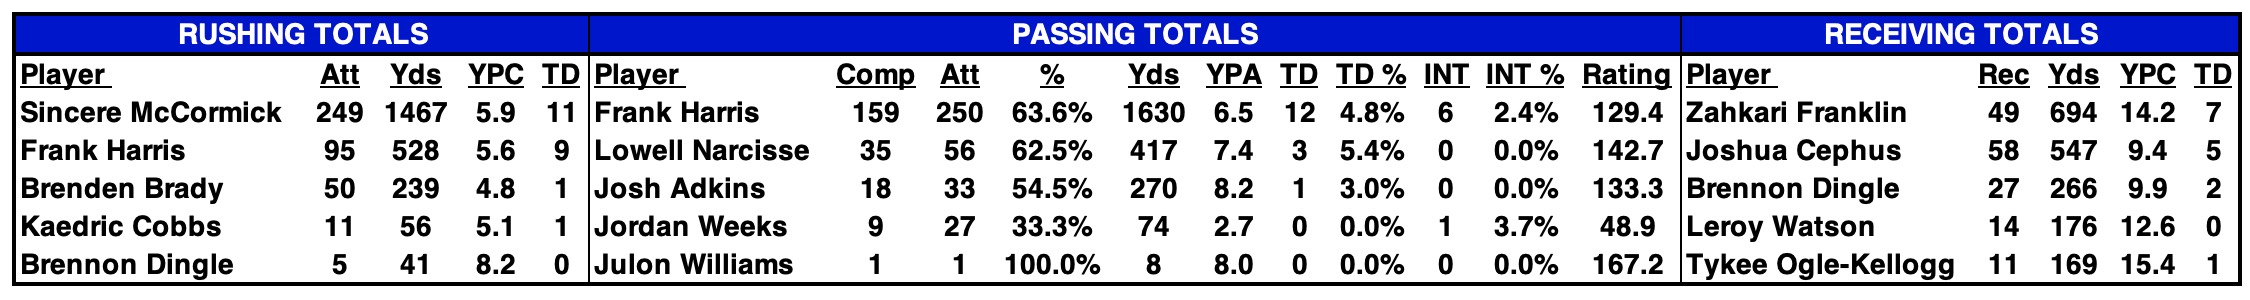
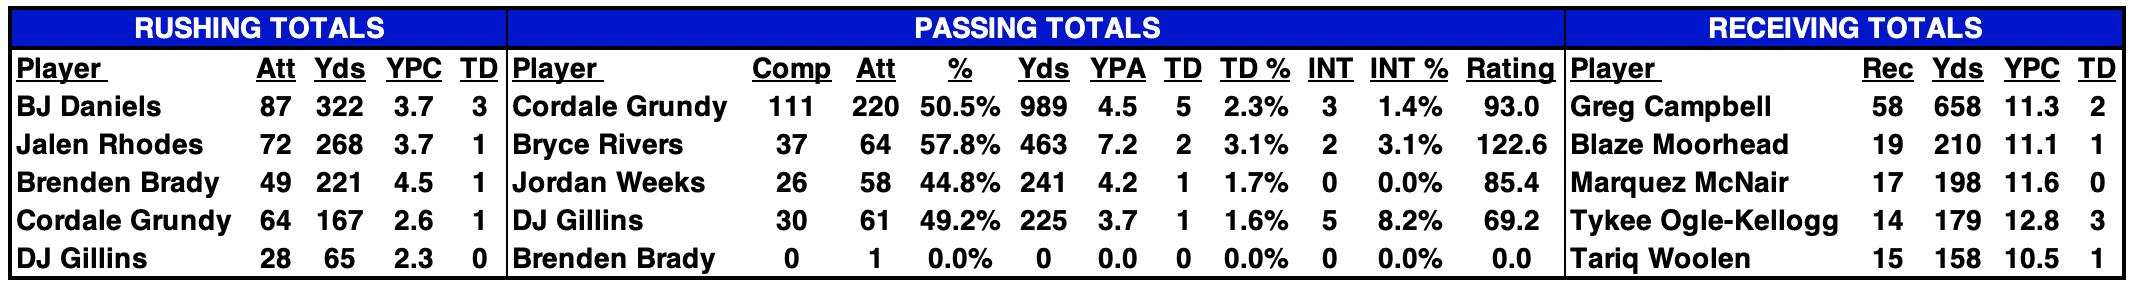
| 2024 STATISTICAL LEADERS |
|---|
| 2024 Individual Player Stats |
2024 Start Chart |
|---|
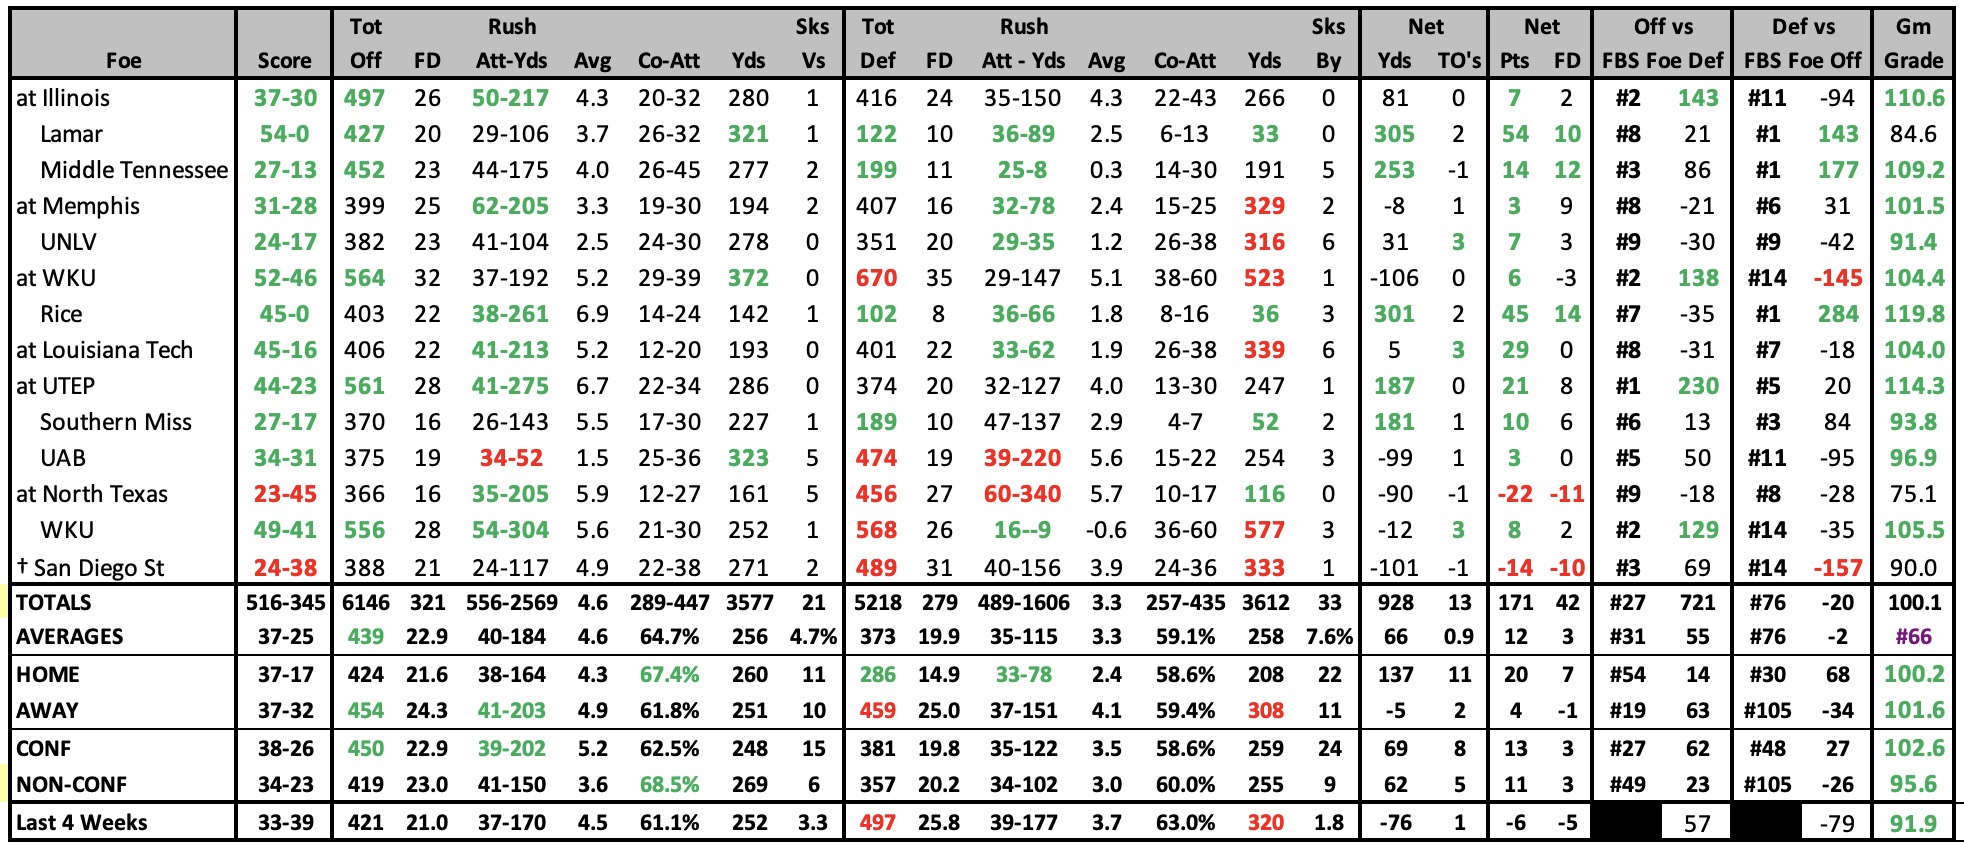
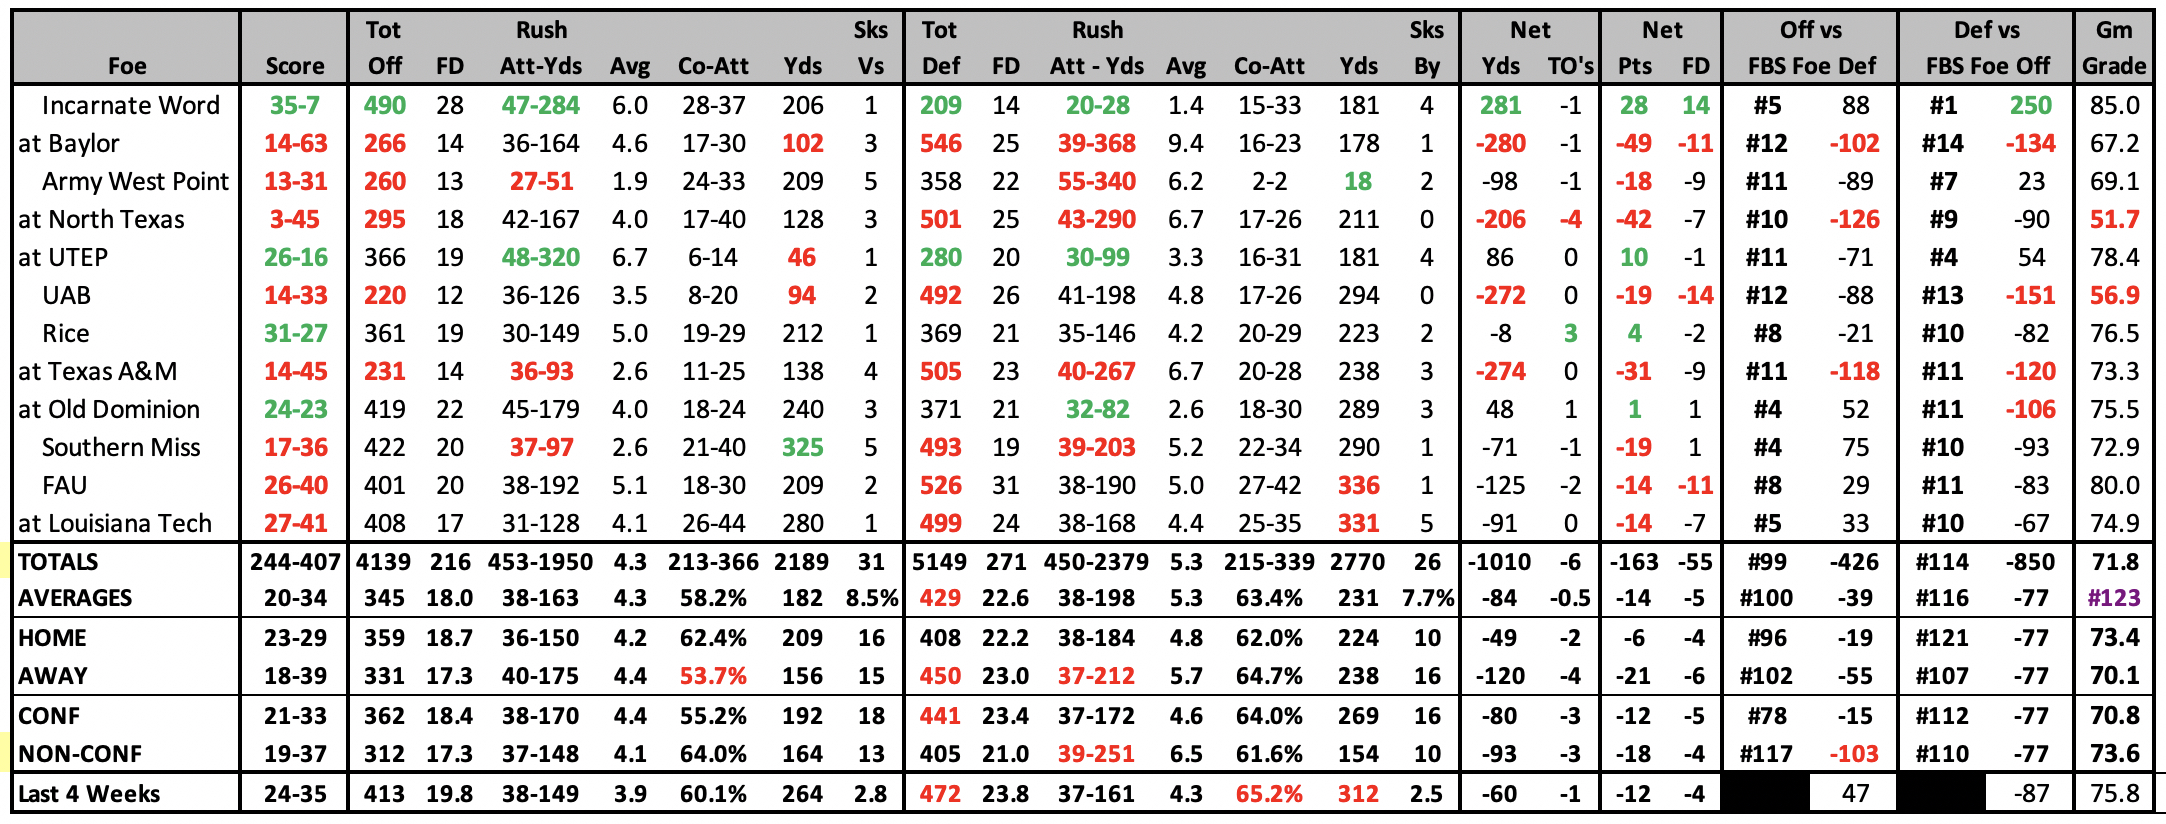
| 2024 GAME-BY-GAME STATS |
|---|
 |
| 2023 STATISTICAL LEADERS |
|---|
| 2023 Individual Player Stats |
2023 Start Chart |
|---|
| 2023 GAME-BY-GAME STATS |
|---|
 |
2023 SCHEDULE |
2022 RESULTS |
||||||||||||||||||||||||||||||||||||||||||||||||||||||||||||||||||||||||||||||||||||||||||||||||||||||||||||||||||||||||||||||||||||||||||||||||||||||||||||||||||||||||||||||||||||||||||||||||||||||||||||||||||
|
|
||||||||||||||||||||||||||||||||||||||||||||||||||||||||||||||||||||||||||||||||||||||||||||||||||||||||||||||||||||||||||||||||||||||||||||||||||||||||||||||||||||||||||||||||||||||||||||||||||||||||||||||||||
| 2022 STATISTICAL LEADERS |
|---|
| 2022 Individual Player Stats |
2022 Start Chart |
|---|
| 2022 GAME-BY-GAME STATS |
|---|
 |
2022 SCHEDULE |
2021 RESULTS |
||||||||||||||||||||||||||||||||||||||||||||||||||||||||||||||||||||||||||||||||||||||||||||||||||||||||||||||||||||||||||||||||||||||||||||||||||||||||||||||||||||||||||||||||||||||||||||||||||||||||||||||||||||||||||||||
|
|
||||||||||||||||||||||||||||||||||||||||||||||||||||||||||||||||||||||||||||||||||||||||||||||||||||||||||||||||||||||||||||||||||||||||||||||||||||||||||||||||||||||||||||||||||||||||||||||||||||||||||||||||||||||||||||||
| 2021 STATISTICAL LEADERS |
|---|
| 2021 Individual Player Stats |
2021 Start Chart |
|---|
| 2021 GAME-BY-GAME STATS |
|---|
 |
2021 SCHEDULE |
2020 RESULTS |
||||||||||||||||||||||||||||||||||||||||||||||||||||||||||||||||||||||||||||||||||||||||||||||||||||||||||||||||||||||||||||||||||||||||||||||||||||||||||||||||||||||||||||||||||||||||||||||||||||||
|
|
||||||||||||||||||||||||||||||||||||||||||||||||||||||||||||||||||||||||||||||||||||||||||||||||||||||||||||||||||||||||||||||||||||||||||||||||||||||||||||||||||||||||||||||||||||||||||||||||||||||
| 2020 STATISTICAL LEADERS |
|---|
| 2020 Individual Player Stats |
2020 Start Chart |
|---|
| 2020 GAME-BY-GAME STATS |
|---|
 |
2020 SCHEDULE |
2019 RESULTS |
||||||||||||||||||||||||||||||||||||||||||||||||||||||||||||||||||||||||||||||||||||||||||||||||||||||||||||||||||||||||||||||||||||||||||||||||||||||||||||||||||||||||||||||||||||||||||
|
|
||||||||||||||||||||||||||||||||||||||||||||||||||||||||||||||||||||||||||||||||||||||||||||||||||||||||||||||||||||||||||||||||||||||||||||||||||||||||||||||||||||||||||||||||||||||||||
| 2019 STATISTICAL LEADERS |
|---|
| 2019 Individual Player Stats |
2019 Start Chart |
|---|
| 2019 GAME-BY-GAME STATS |
|---|
 |
2019 SCHEDULE |
2018 RESULTS |
|||||||||||||||||||||||||||||||||||||||||||||||||||||||||||||||||||||||||||||||||||||||||||||||||||||||||||||||||||||||||||||||||||||||||||||||||||||||||||||||||||||||||||||||||||||||||||||||||||||||||
|
|
| 2018 STATISTICAL LEADERS |
|---|
| 2018 Individual Player Stats |
2018 Start Chart |
|---|
| 2018 GAME-BY-GAME STATS |
|---|
 |
2018 SCHEDULE |
2017 RESULTS |
||||||||||||||||||||||||||||||||||||||||||||||||||||||||||||||||||||||||||||||||||||||||||||||||||||||||||||||||||||||||||||||||||||||||||||||||||||||||||||||||||||||||||||||||||||||||||||||||||||||||||||||||||
|
|
||||||||||||||||||||||||||||||||||||||||||||||||||||||||||||||||||||||||||||||||||||||||||||||||||||||||||||||||||||||||||||||||||||||||||||||||||||||||||||||||||||||||||||||||||||||||||||||||||||||||||||||||||
| 2017 STATISTICAL LEADERS |
|---|
| 2017 Individual Player Stats |
2017 Start Chart |
|---|
| 2017 GAME-BY-GAME STATS |
|---|
 |
2017 SCHEDULE |
2016 RESULTS |
||||||||||||||||||||||||||||||||||||||||||||||||||||||||||||||||||||||||||||||||||||||||||||||||||||||||||||||||||||||||||||||||||||||||||||||||||||||||||||||||||||||||||||||||||||||||||||||||||||||||||||||||||||||||||||||||
|
|
||||||||||||||||||||||||||||||||||||||||||||||||||||||||||||||||||||||||||||||||||||||||||||||||||||||||||||||||||||||||||||||||||||||||||||||||||||||||||||||||||||||||||||||||||||||||||||||||||||||||||||||||||||||||||||||||
| 2016 STATISTICAL LEADERS |
|---|
| 2016 Individual Player Stats |
2016 Start Chart |
|---|
| 2016 GAME-BY-GAME STATS |
|---|
 |
| 2015 STATISTICAL LEADERS |
|---|
| 2015 Individual Player Stats |
2015 Start Chart |
|---|
| 2015 GAME-BY-GAME STATS |
|---|
 |
2015 SCHEDULE |
2014 RESULTS |
||||||||||||||||||||||||||||||||||||||||||||||||||||||||||||||||||||||||||||||||||||||||||||||||||||||||||||||||||||||||||||||||||||||||||||||||||||||||||||||||||||||||||||||||||||||||||||||||||||||||||||||||||||||||||||||||||||||||||||||
|
|
||||||||||||||||||||||||||||||||||||||||||||||||||||||||||||||||||||||||||||||||||||||||||||||||||||||||||||||||||||||||||||||||||||||||||||||||||||||||||||||||||||||||||||||||||||||||||||||||||||||||||||||||||||||||||||||||||||||||||||||
| 2014 STATISTICAL LEADERS |
|---|
| 2014 Individual Player Stats |
2014 Start Chart |
|---|
| 2014 GAME-BY-GAME STATS |
|---|
 |
| 2013 STATISTICAL LEADERS |
|---|
| Player | Att | Yds | YPC | TD | Player | Comp | Att | % | Yds | YPA | TD | INT | Rating | Player | Rec | Yds | YPC | TD |
| David Glasco II | 95 | 496 | 5.2 | 5 | Eric Soza | 236 | 377 | 62.6% | 2719 | 7.2 | 12 | 11 | 127.9 | Kam Jones | 34 | 345 | 10.1 | 1 |
| Evans Okotcha | 93 | 386 | 4.2 | 2 | Tucker Carter | 23 | 33 | 69.7% | 190 | 5.8 | 1 | 2 | 115.9 | Kenny Bias | 16 | 335 | 20.9 | 2 |
| Eric Soza | 96 | 363 | 3.8 | 7 | Team | 0 | 1 | 0.0% | 0 | 0.0 | 0 | 0 | 0.0 | Cole Hubble | 20 | 274 | 13.7 | 2 |
| 2013 GAME-BY-GAME STATS |
|---|
 |
2013 RESULTS |
2012 RESULTS |
||||||||||||||||||||||||||||||||||||||||||||||||||||||||||||||||||||||||||||||||||||||||||||||||||||||||||||||||||||||||||||||||||||||||||||||||||||||||||||||||||||||||||||||||||||||||||||||||||||||||||||||||||||||||||||||||||||||||||||||||||||||||||||||
|
|
||||||||||||||||||||||||||||||||||||||||||||||||||||||||||||||||||||||||||||||||||||||||||||||||||||||||||||||||||||||||||||||||||||||||||||||||||||||||||||||||||||||||||||||||||||||||||||||||||||||||||||||||||||||||||||||||||||||||||||||||||||||||||||||
| 2012 STATISTICAL LEADERS |
|---|
| Player | Att | Yds | YPC | TD | Player | Comp | Att | % | Yds | YPA | TD | INT | Rating | Player | Rec | Yds | YPC | TD | ||
| David Glasco II | 111 | 537 | 4.8 | 5 | Eric Soza | 166 | 282 | 58.9% | 2085 | 7.4 | 20 | 3 | 142.2 | Evans Okotcha | 24 | 349 | 14.5 | 3 | ||
| Evans Okotcha | 106 | 450 | 4.2 | 8 | Ryan Polite | 46 | 75 | 61.3% | 604 | 8.1 | 3 | 3 | 134.2 | Kam Jones | 23 | 323 | 14.0 | 1 | ||
| Eric Soza | 67 | 364 | 5.4 | 6 | John Simmons | 9 | 9 | 100.0% | 83 | 9.2 | 0 | 0 | 177.5 | Cole Hubble | 15 | 308 | 20.5 | 4 |
| 2012 Individual Player Stats • 2012 Start Chart/Starters Lost |
|---|
| 2012 GAME-BY-GAME STATS |
|---|
 |
| 2011 GAME-BY-GAME STATS |
|---|
2011 RESULTS |
|||||||||||||||||||||||||||||||||||||||||||||||||
|
|||||||||||||||||||||||||||||||||||||||||||||||||
| 2010 GAME-BY-GAME STATS |
|---|
2011 FIRST YEAR OF FOOTBALL |
| 2009-2006 RESULTS |
|---|
2011 FIRST YEAR OF FOOTBALL |