
FLORIDA ATLANTIC OWLS |
|
STADIUM: FAU Stadium PLAYING SURFACE: Natural Grass • CAPACITY: 29,571 STARTERS RETURNING (O/D): 5*/2 LETTERMAN RETURNING: 74 (34,36,4) • LETTERMAN LOST: 39 (18,16,5) |
 |
|
| LOCATION: Boca Raton, Florida | |
| FOUNDED: 1961 | |
| ENROLLMENT: 24,569 | |
| COLORS: Blue & Red | |
| MASCOT: The Owl | |
| CONFERENCE: AAC | |
| Head Coach: Zach Kittley | |
| YEARS WITH TM: 1st | |
| OVERALL RECORD: 0-0 | |
| RECORD WITH TEAM: 0-0 |
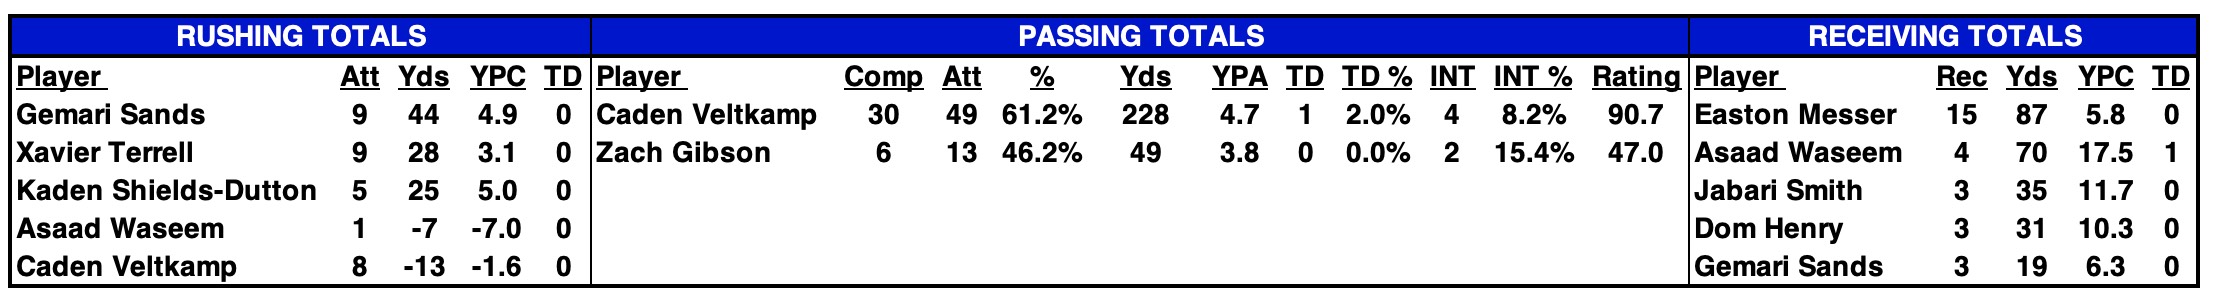
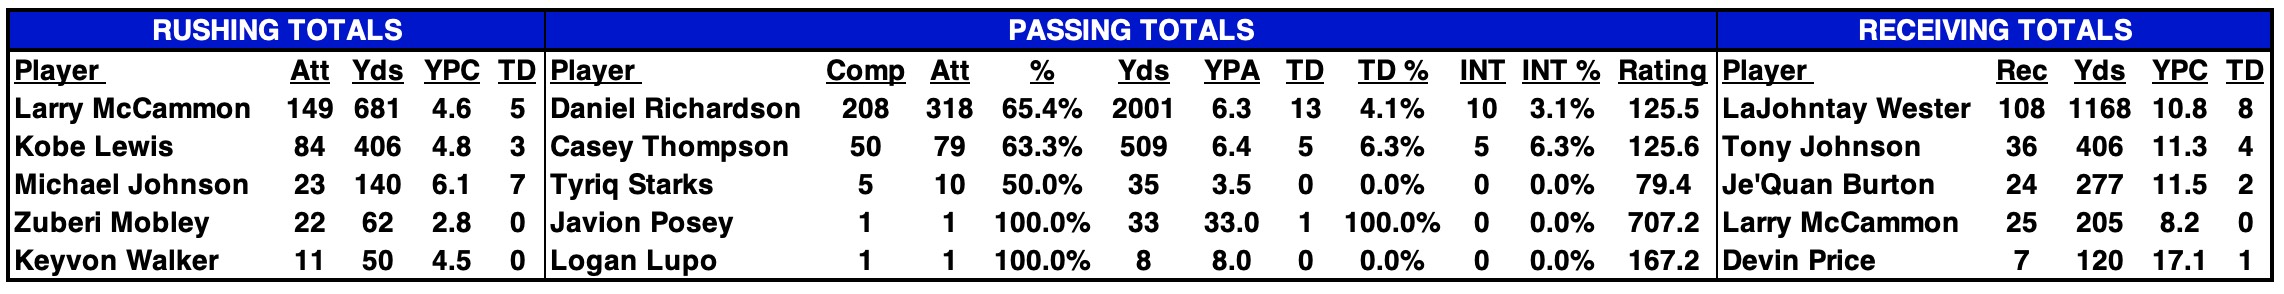
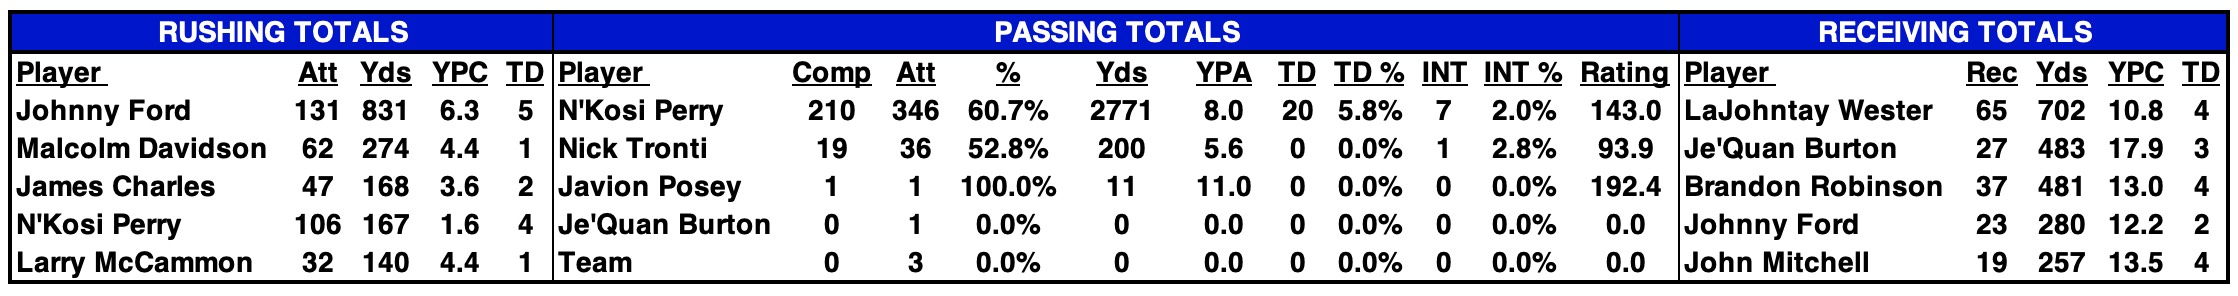
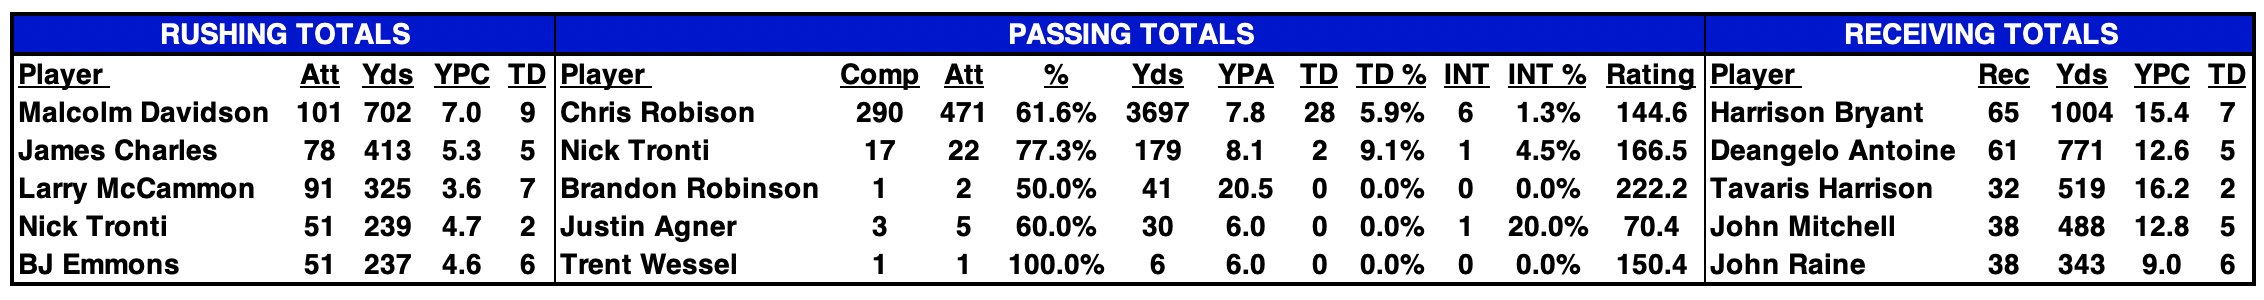
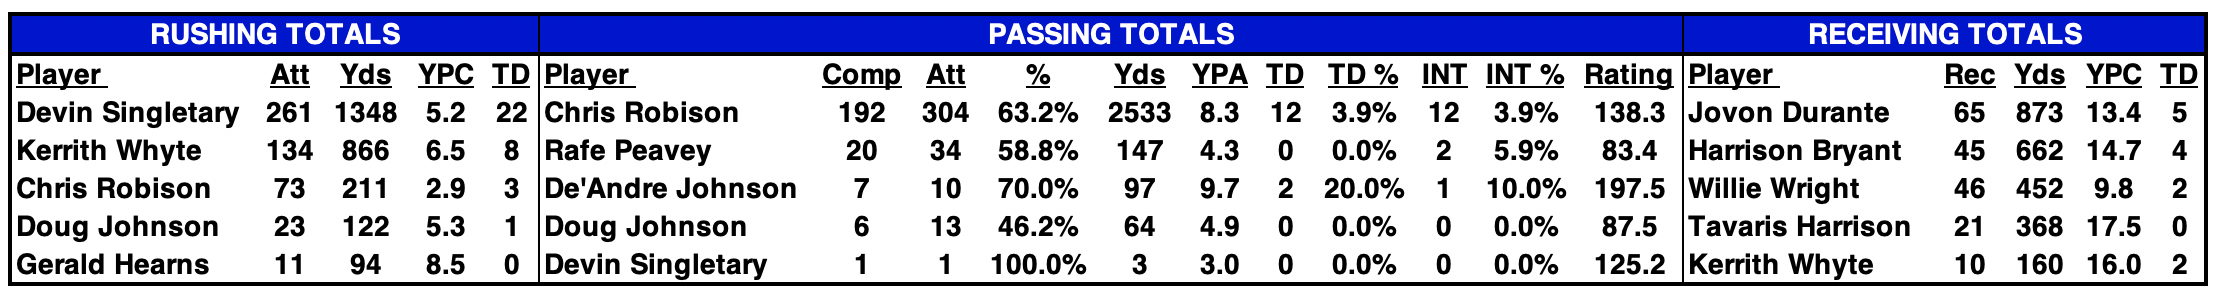
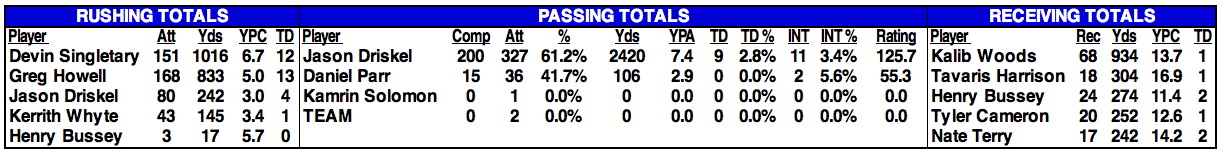
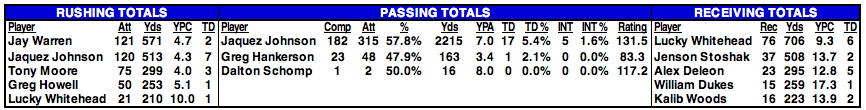
2025 STATISTICAL LEADERS |
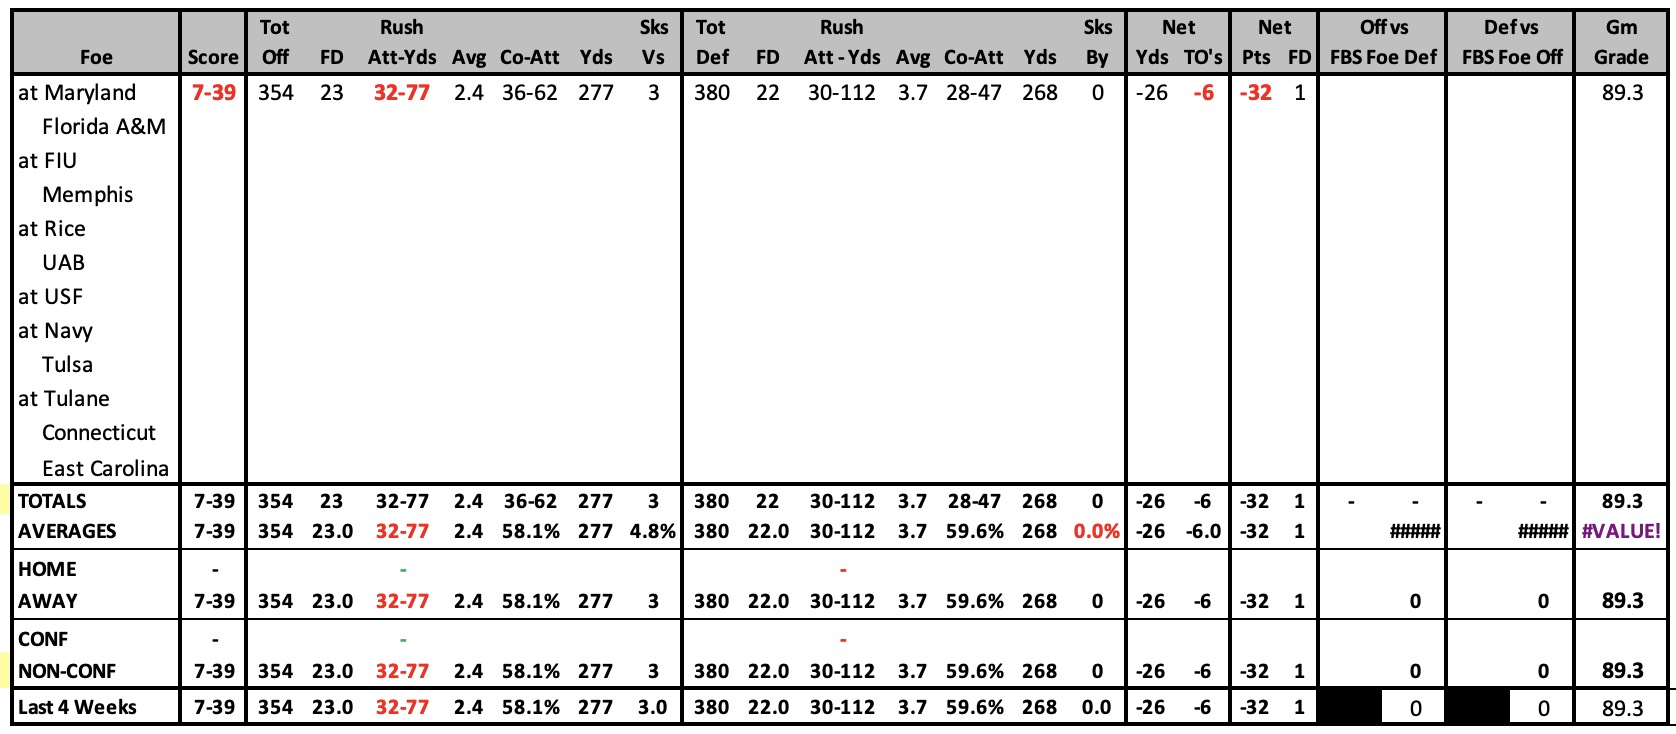
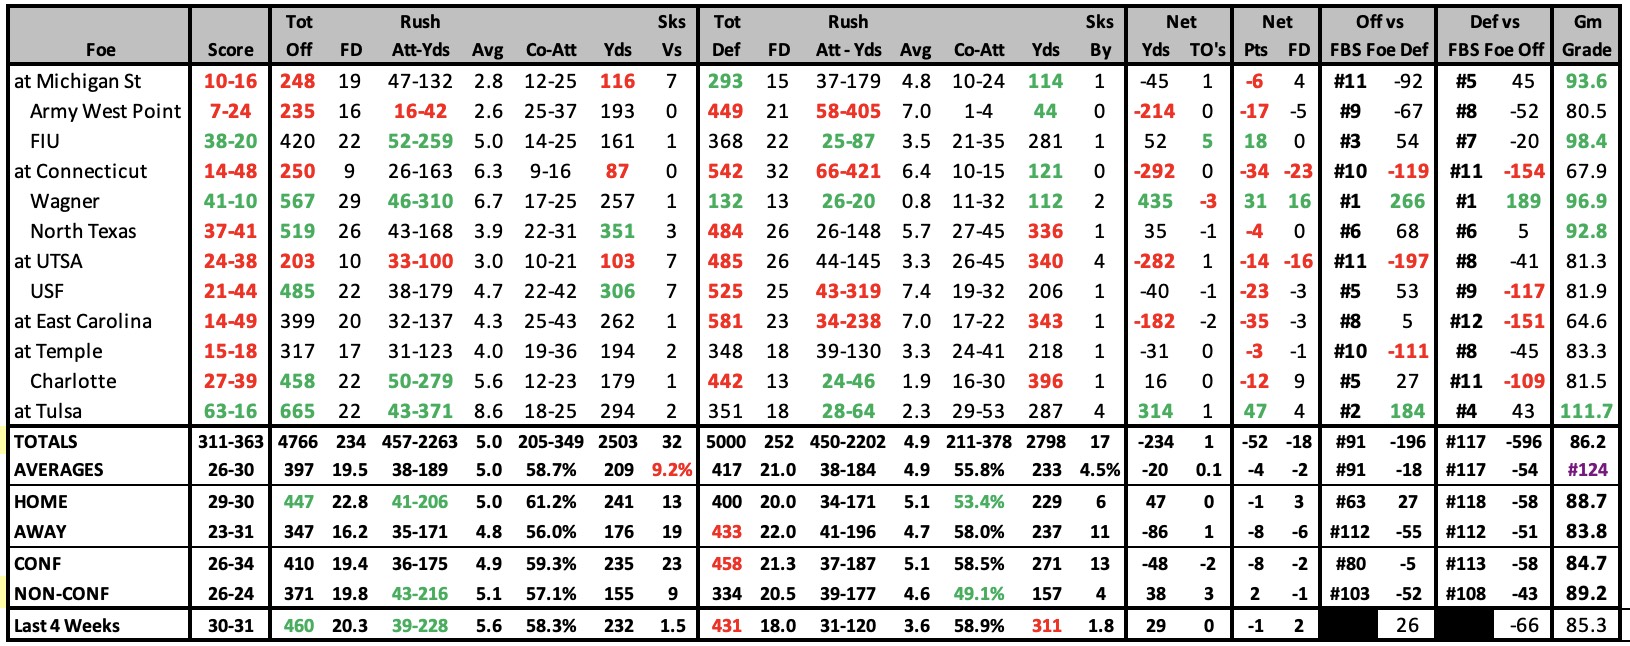
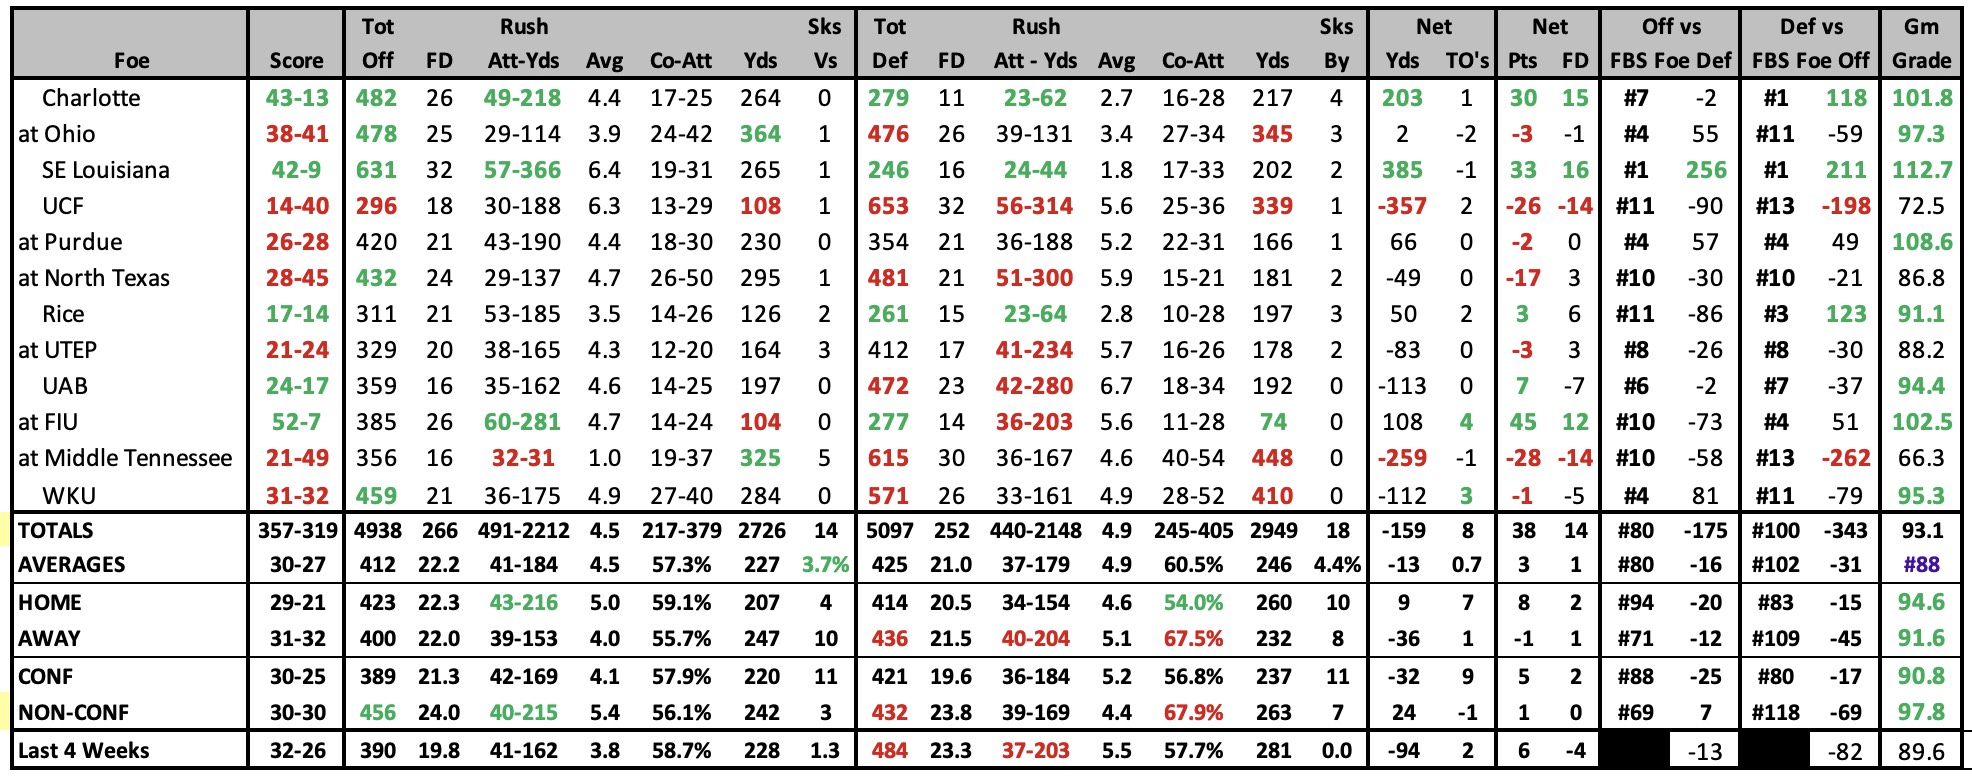
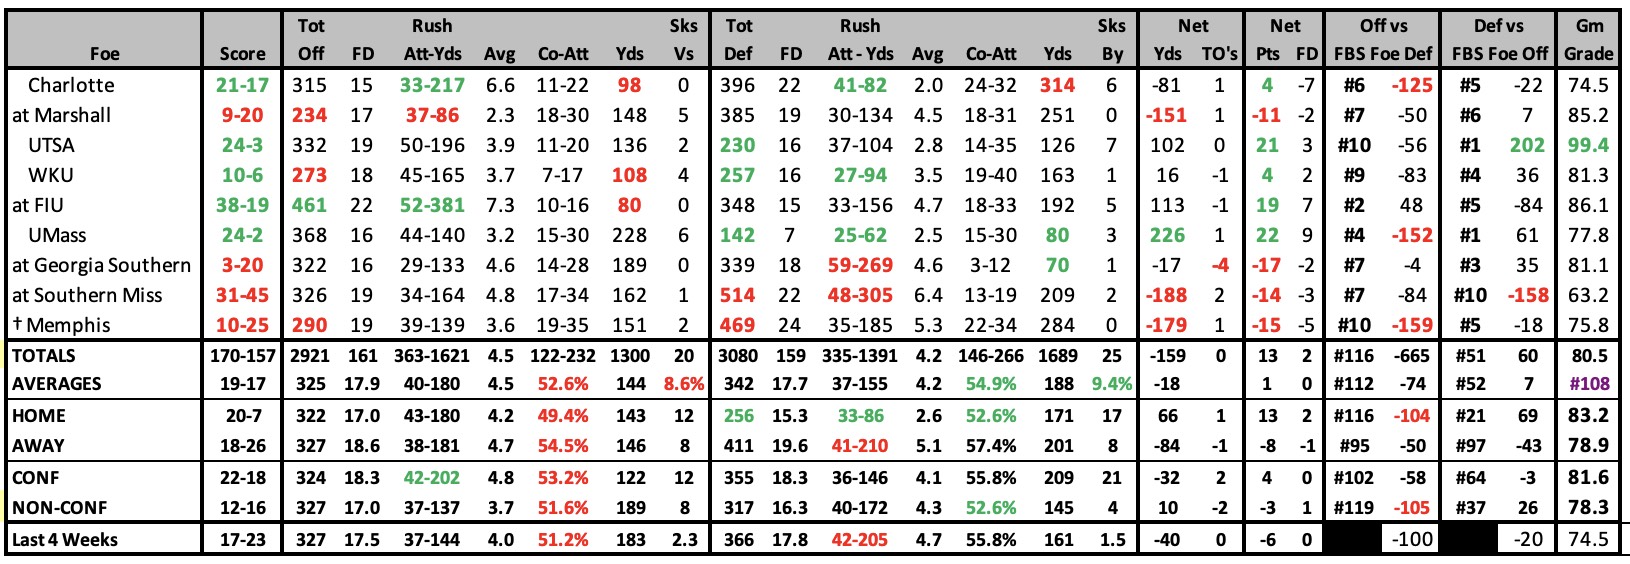
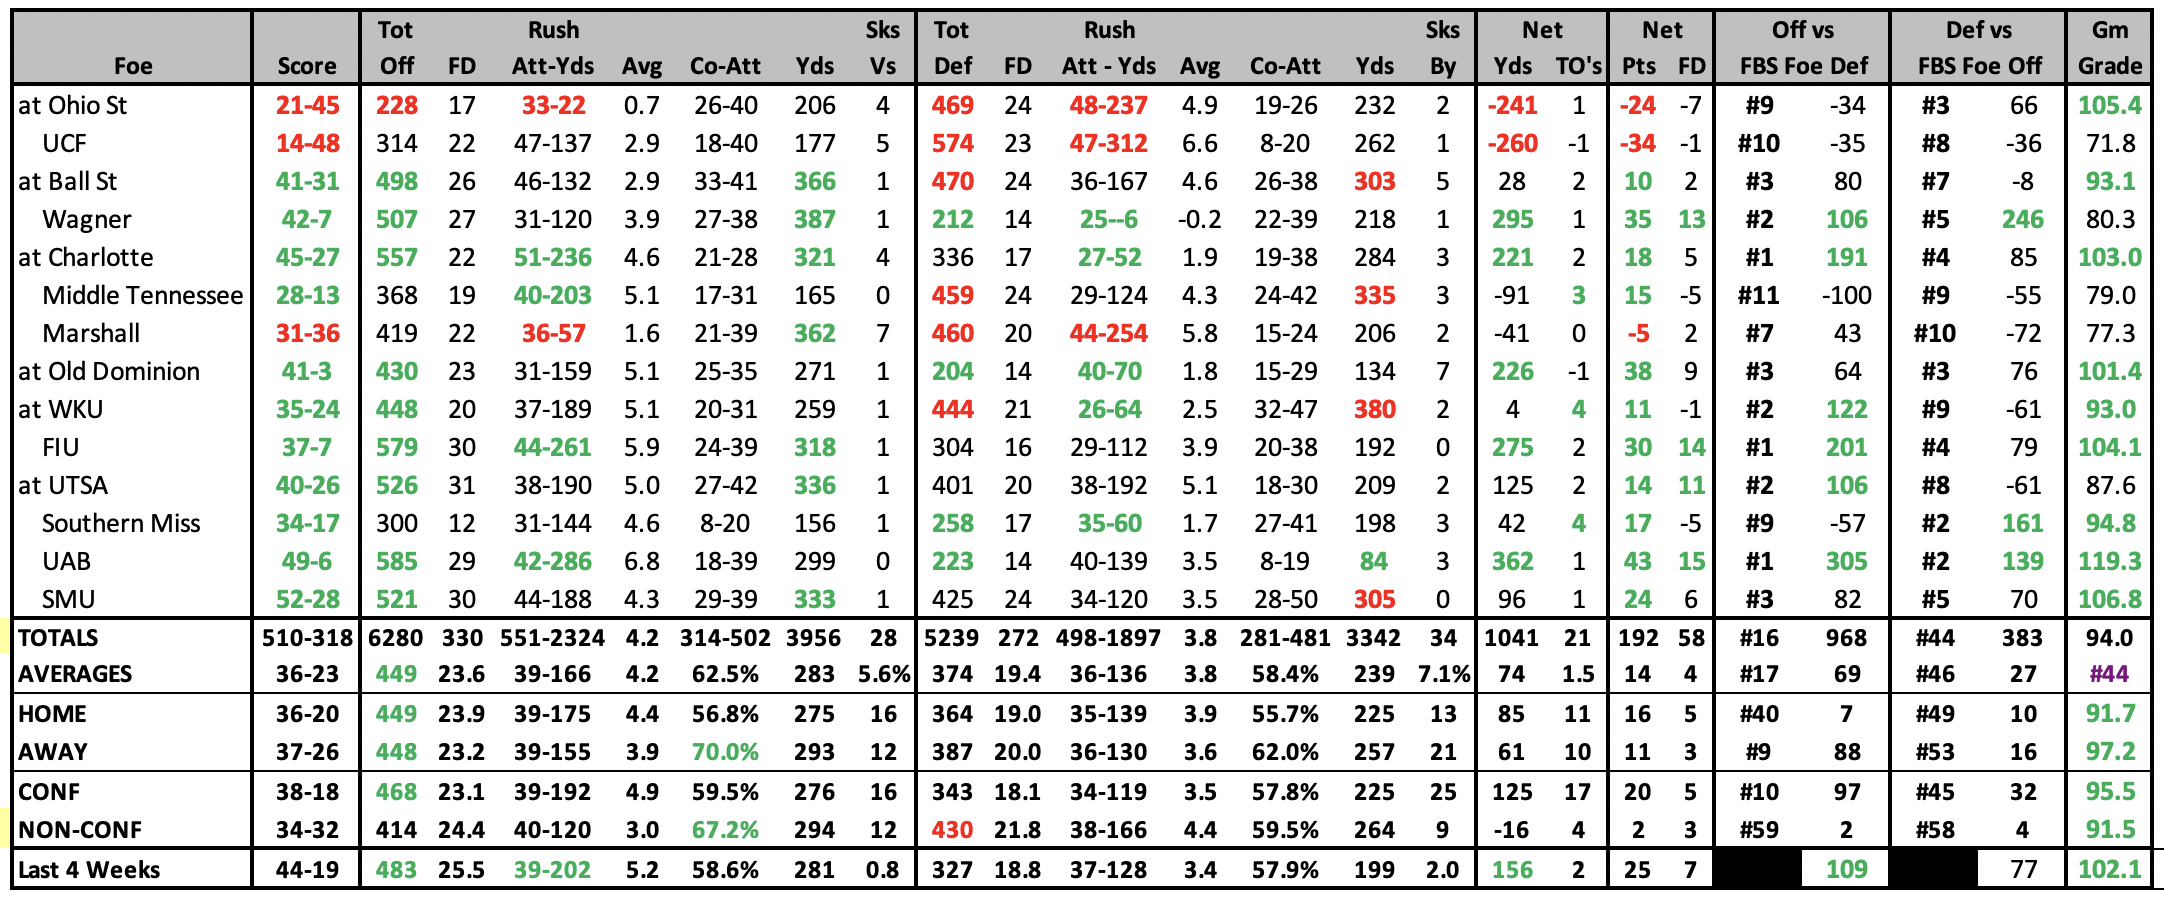
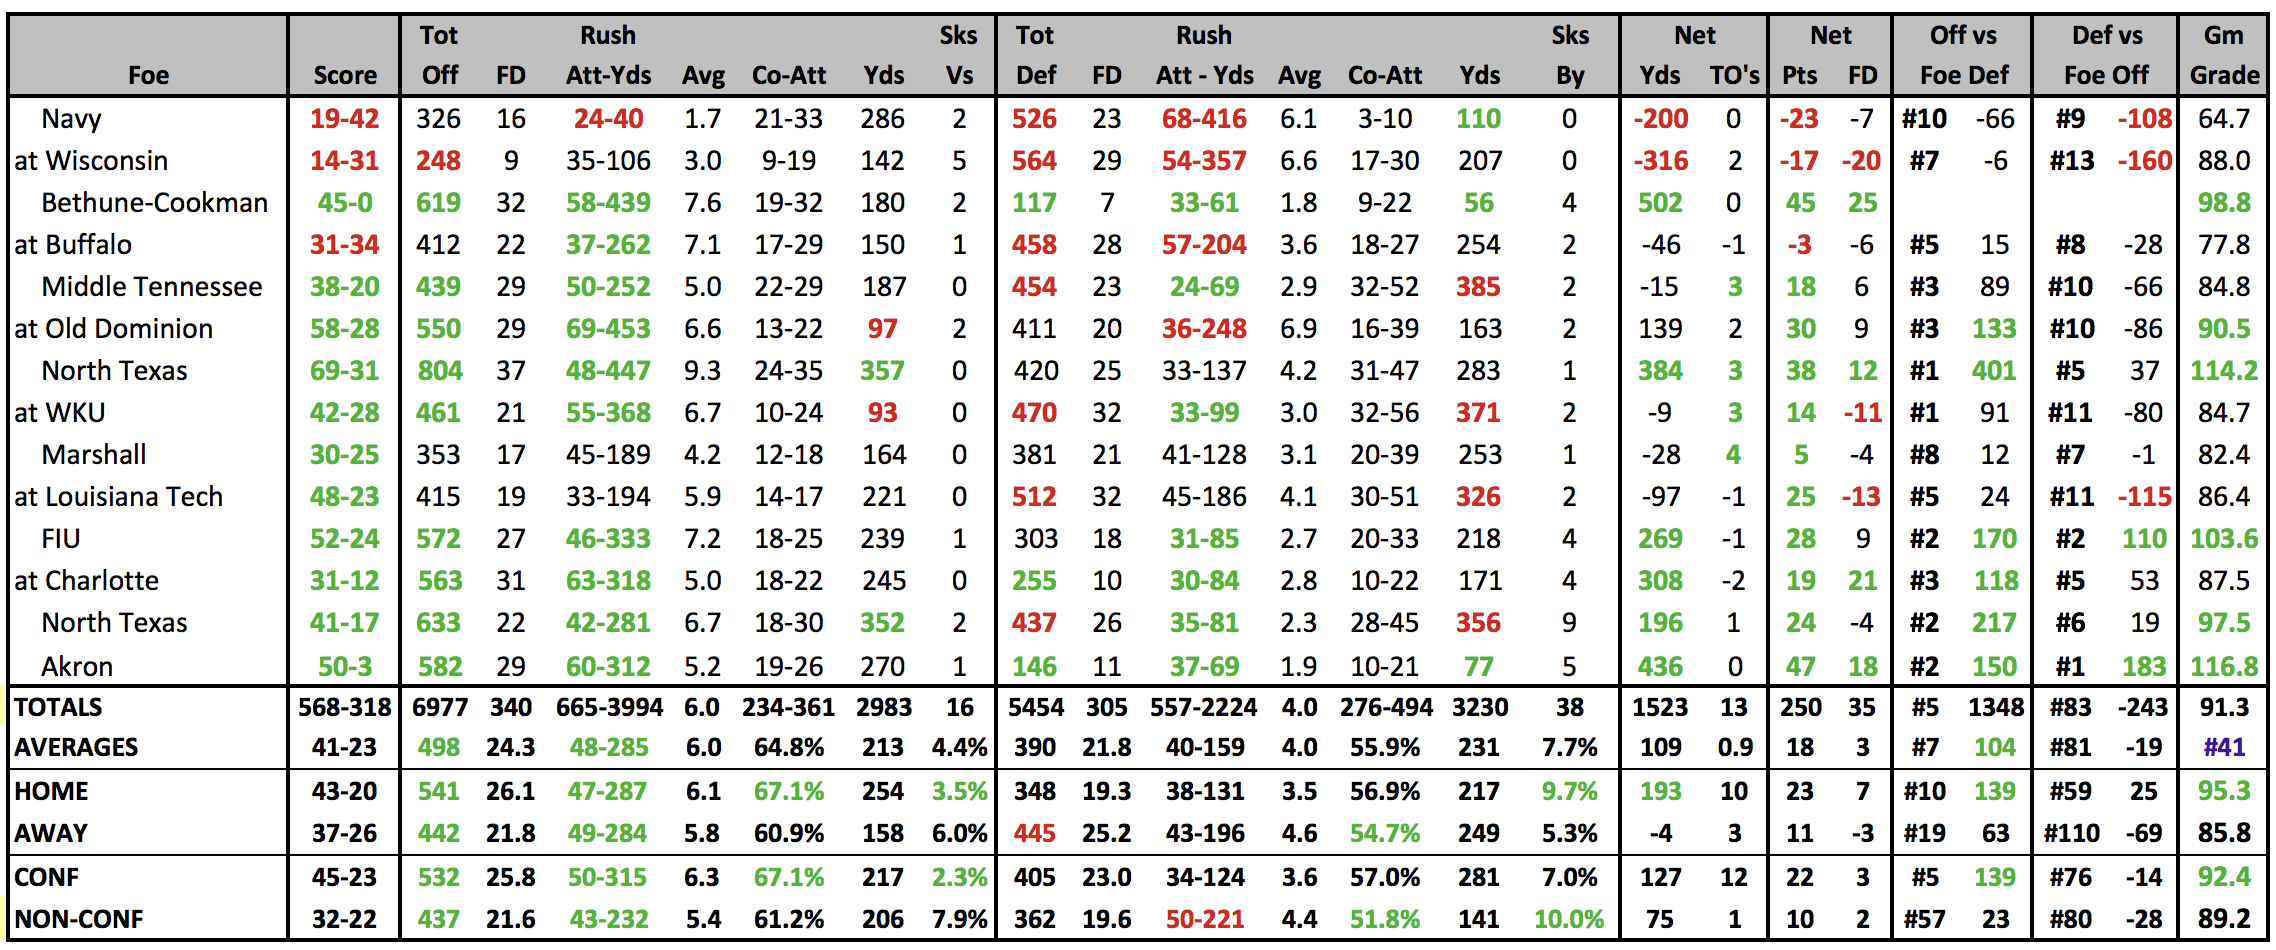
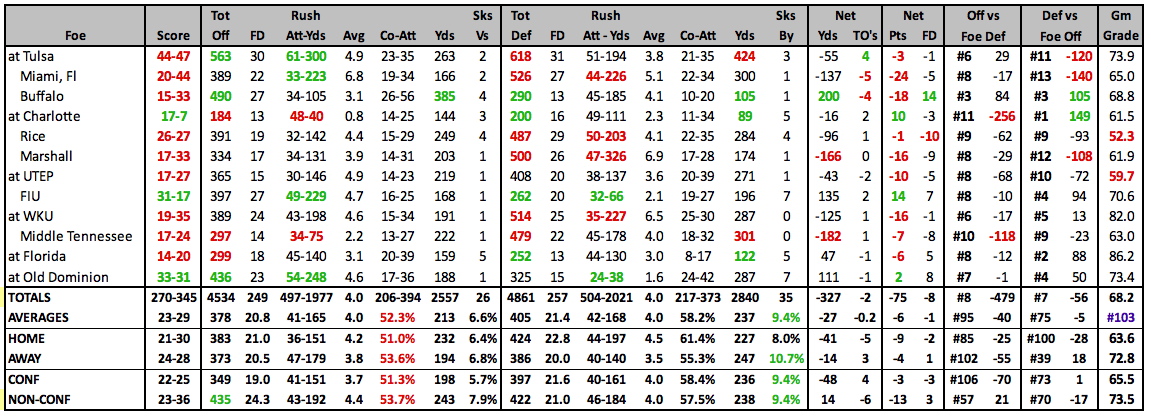
2025 GAME BY GAME STATS |
 |
2025 SCHEDULE |
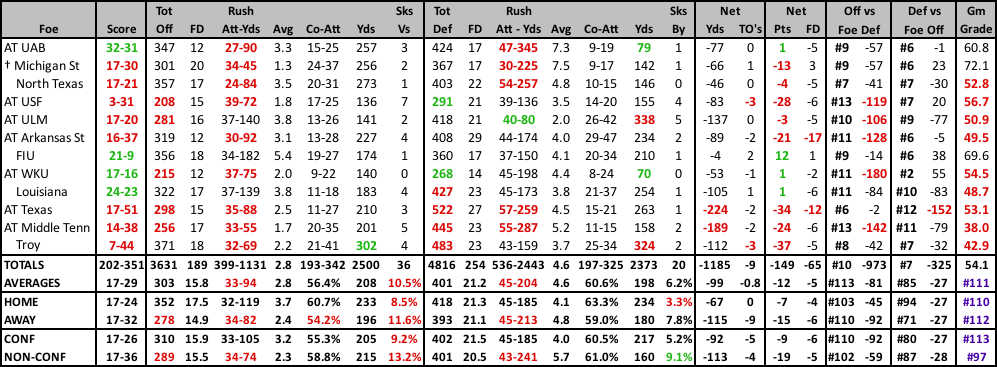
2024 RESULTS |
||||||||||||||||||||||||||||||||||||||||||||||||||||||||||||||||||||||||||||||||||||||||||||||||||||||||||||||||||||||||||||||||||||||||||||||||||||||||||||||||||||||||||||||||||||||||||||||||
|
|
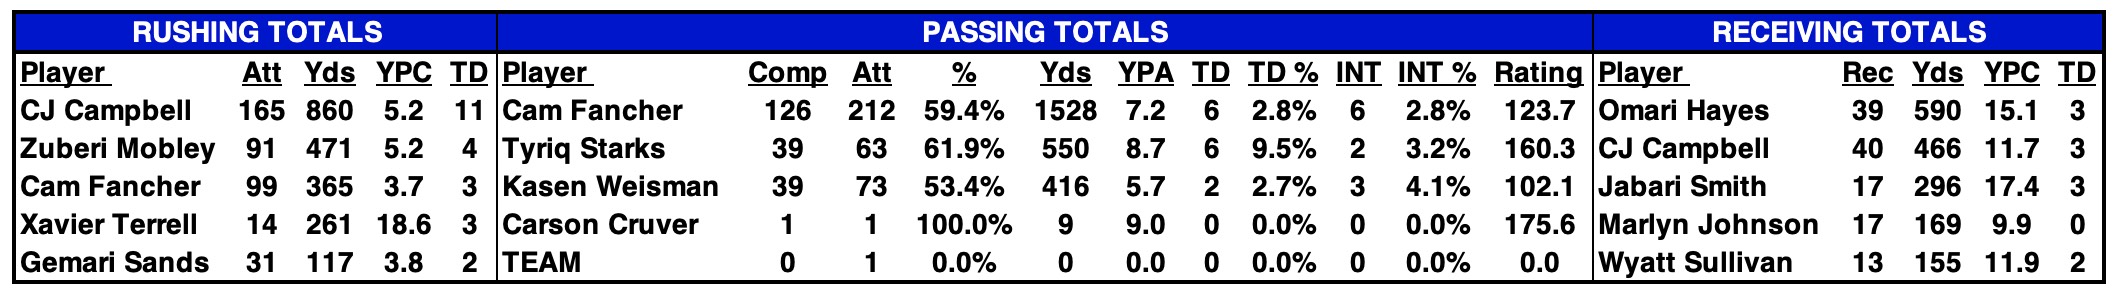
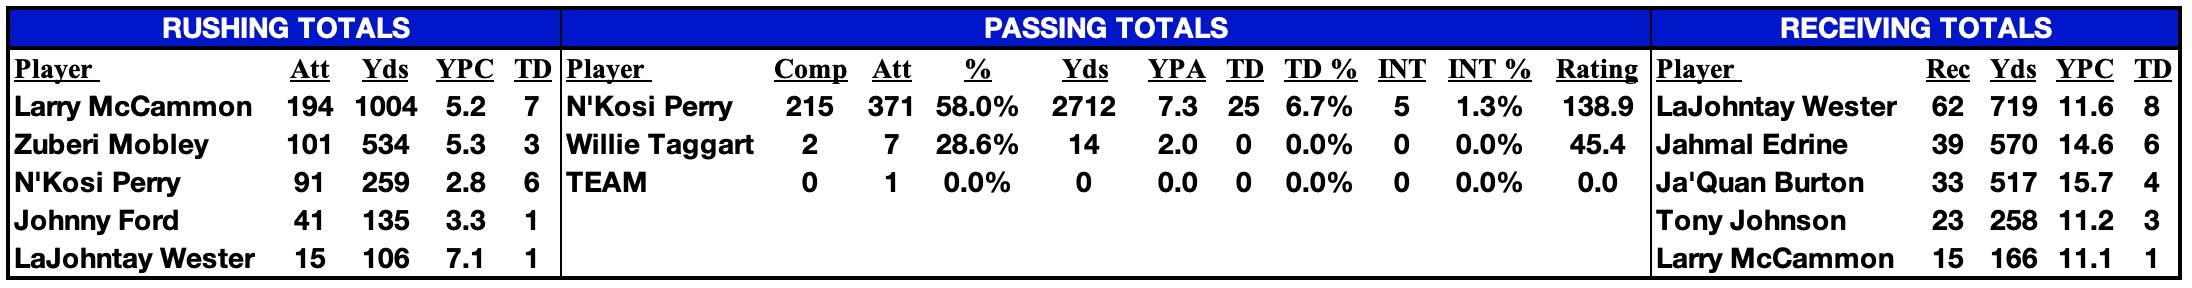
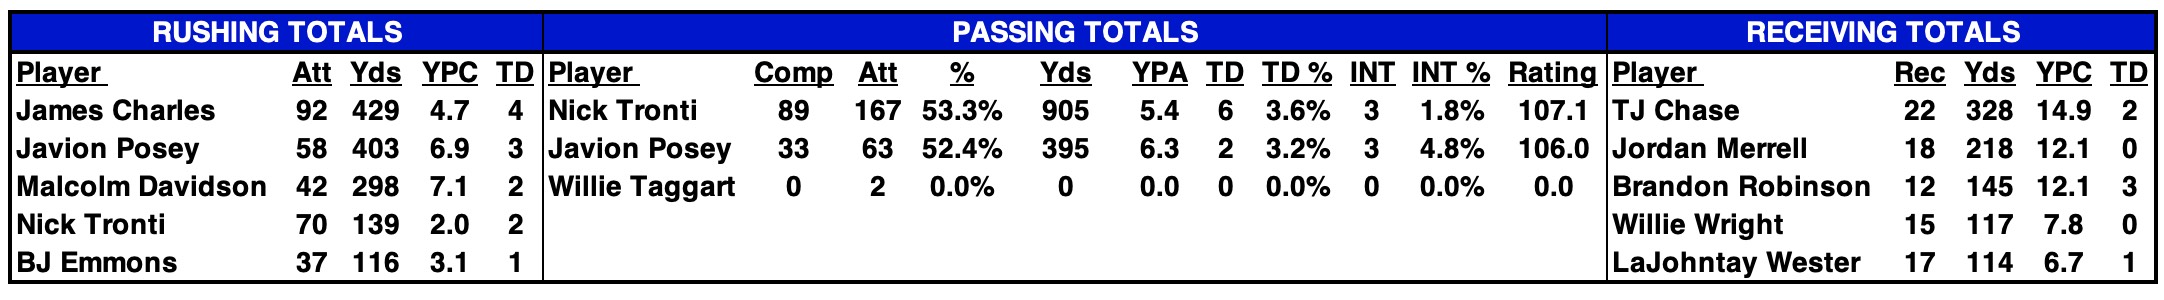
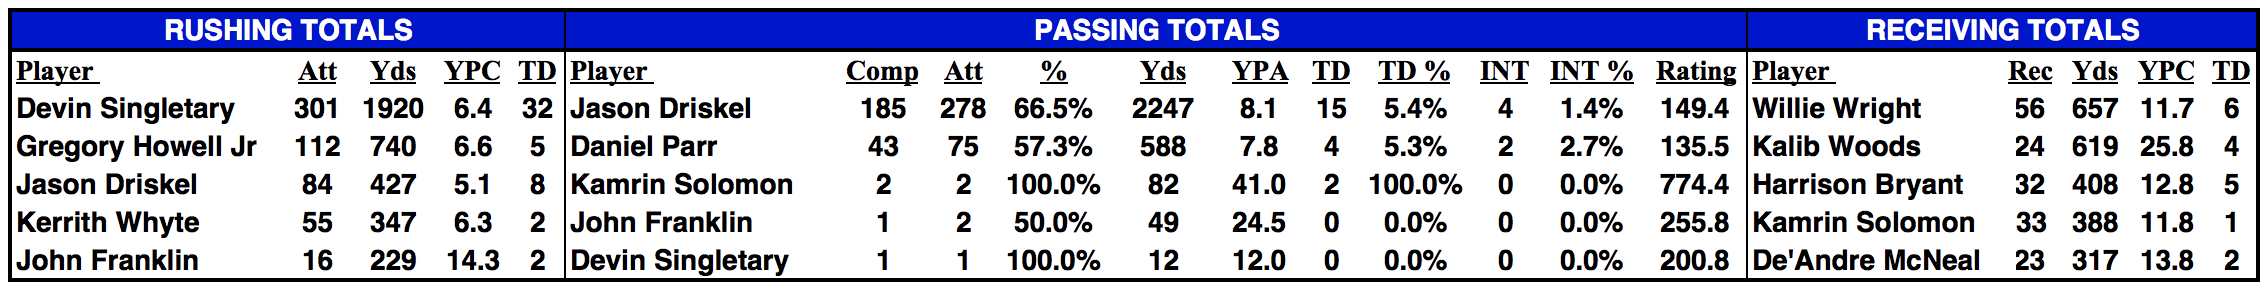
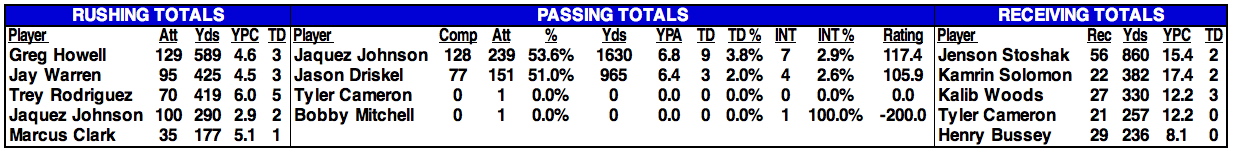
2024 STATISTICAL LEADERS |
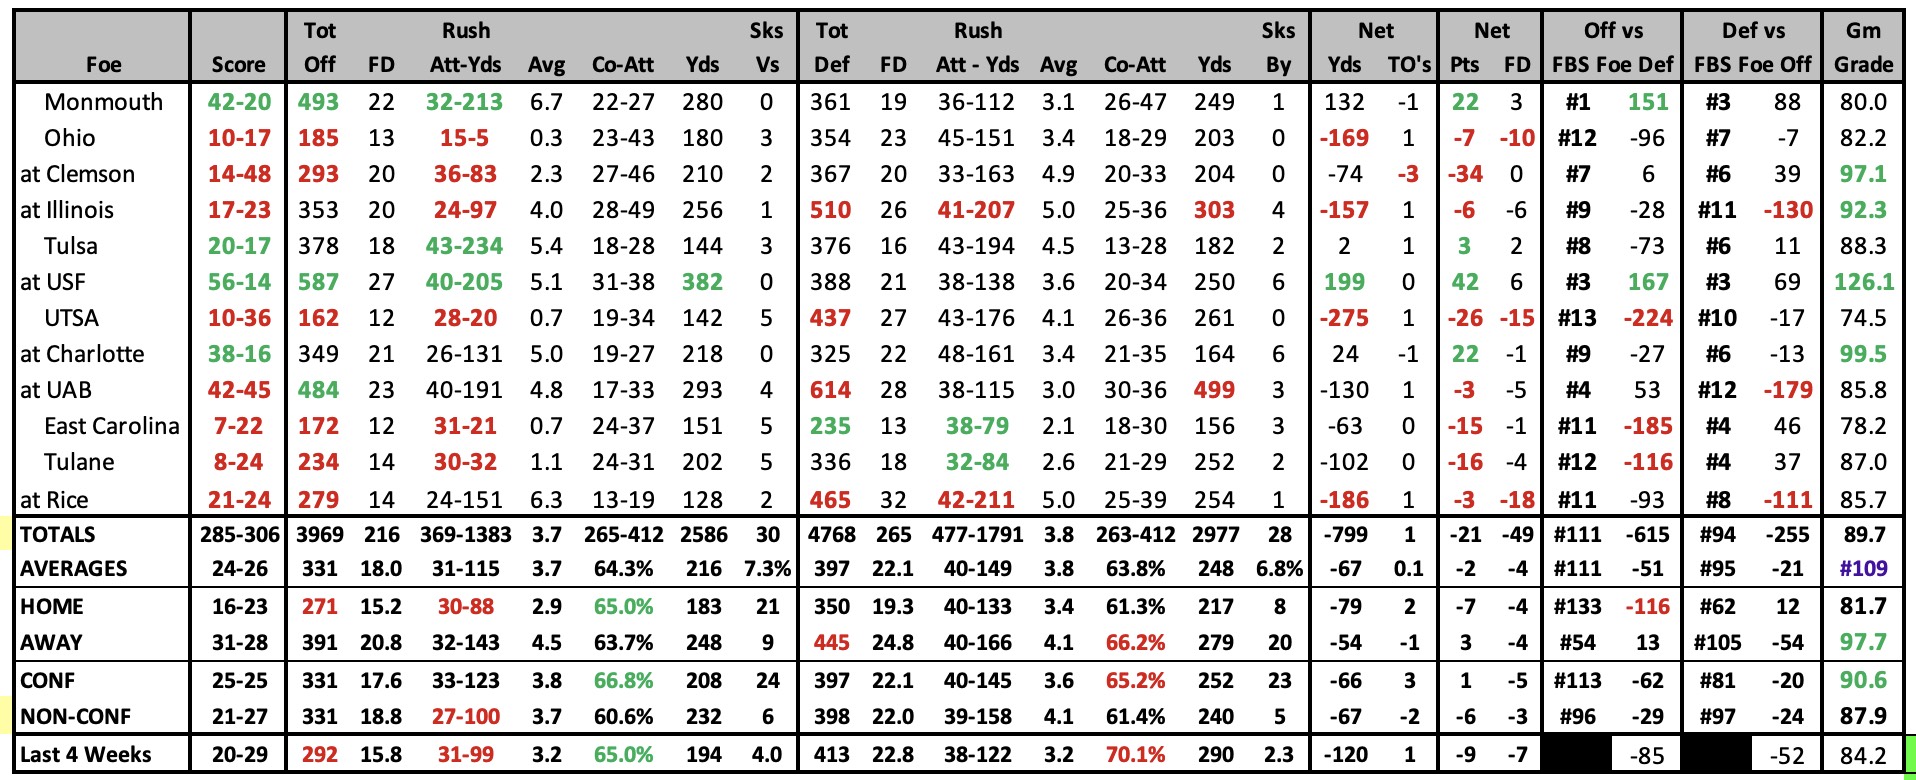
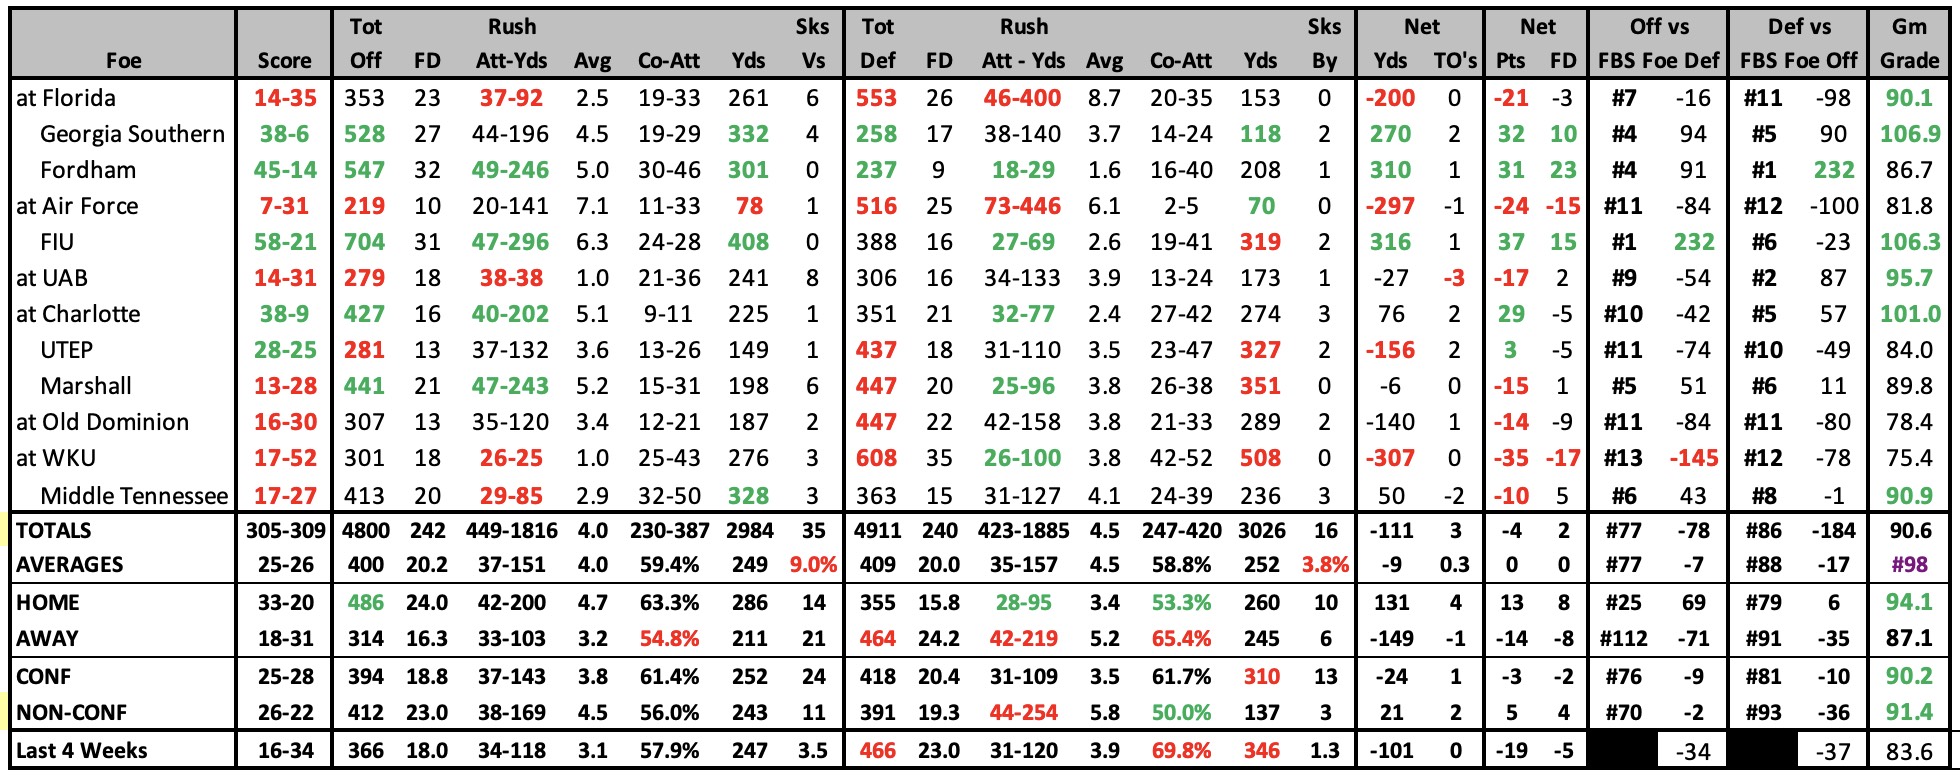
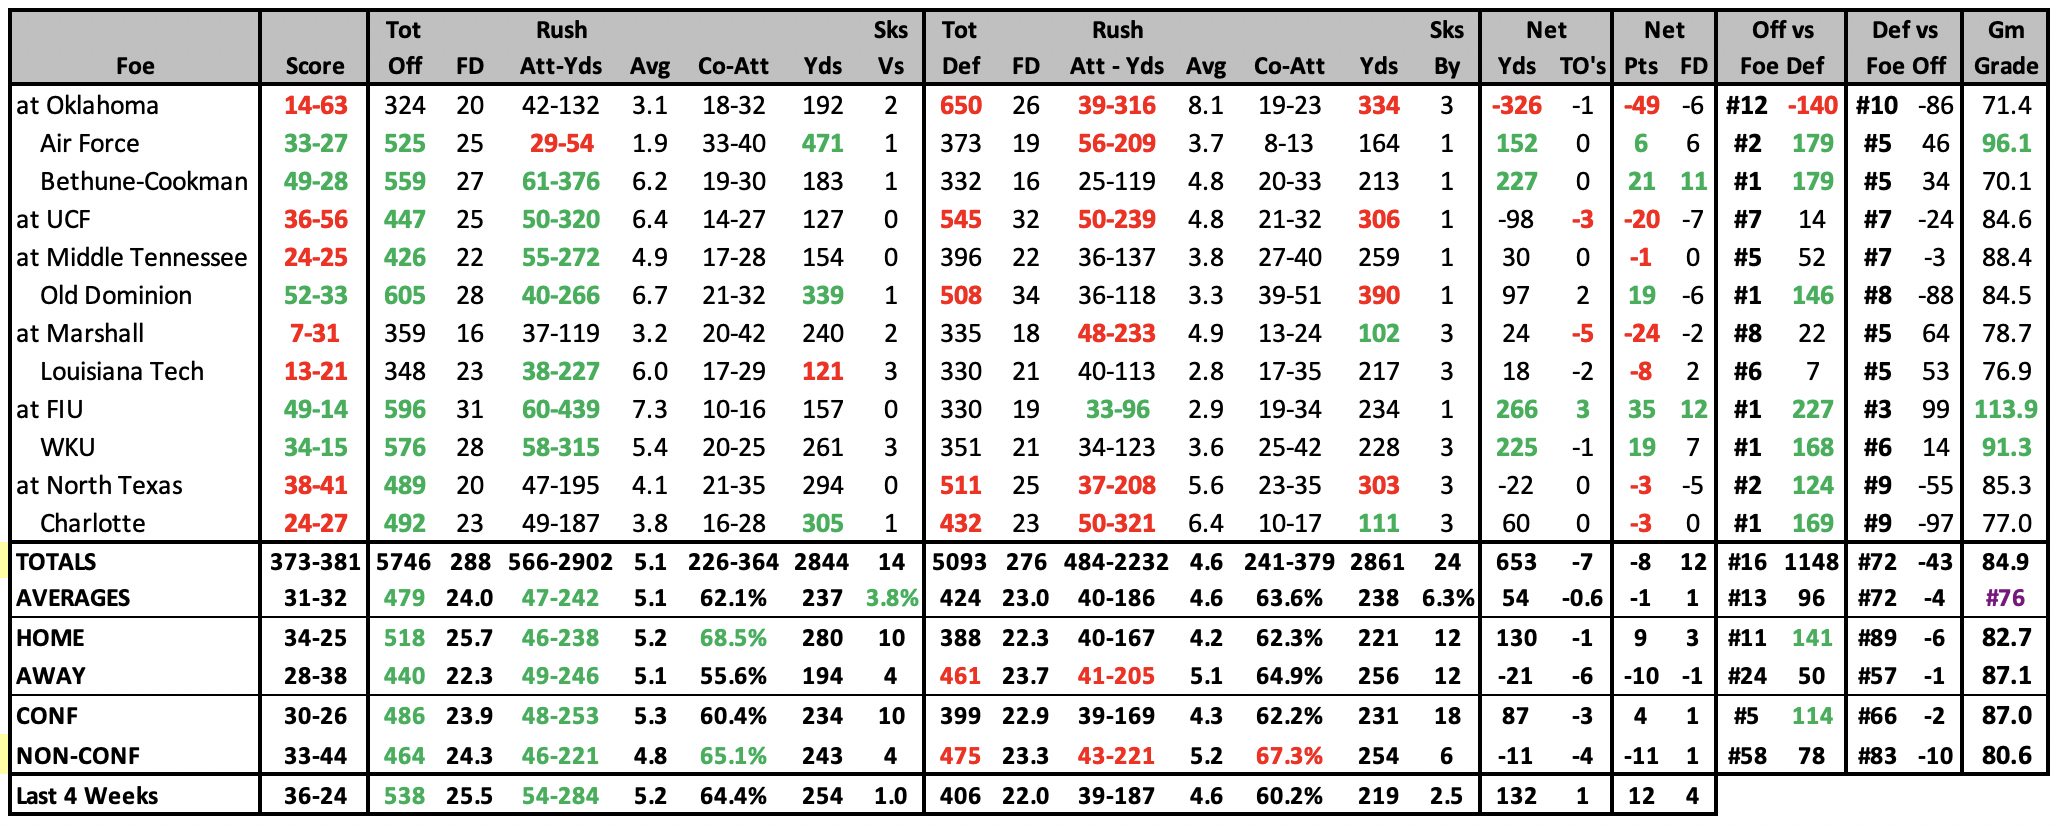
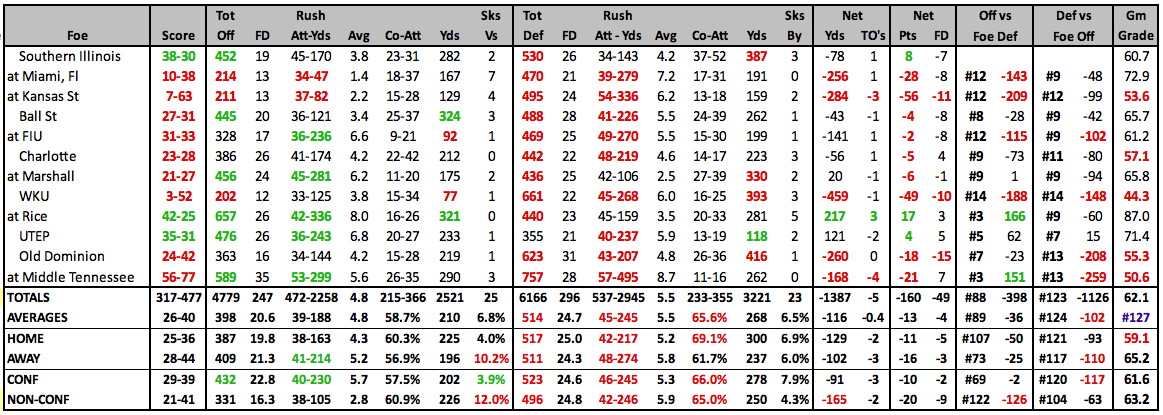
2024 GAME BY GAME STATS |
 |
2024 SCHEDULE |
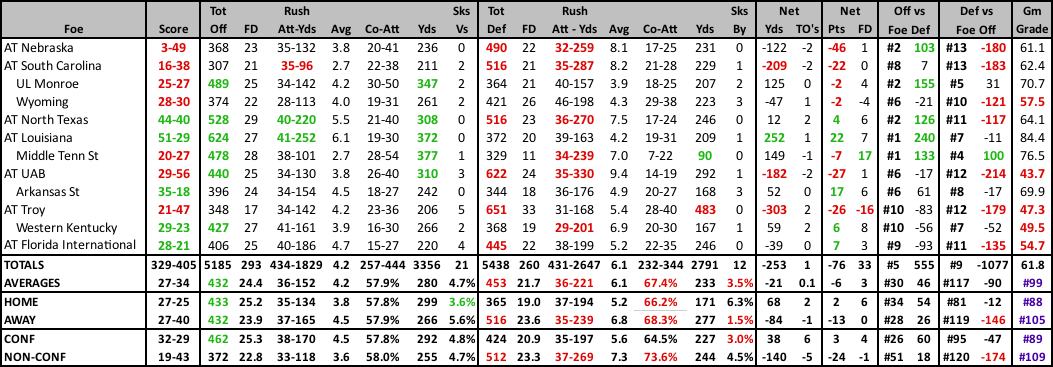
2023 RESULTS |
||||||||||||||||||||||||||||||||||||||||||||||||||||||||||||||||||||||||||||||||||||||||||||||||||||||||||||||||||||||||||||||||||||||||||||||||||||||||||||||||||||||||||||||||||||||||||||||||
|
|
2023 STATISTICAL LEADERS |
2023 GAME BY GAME STATS |
 |
2023 SCHEDULE |
2022 RESULTS |
||||||||||||||||||||||||||||||||||||||||||||||||||||||||||||||||||||||||||||||||||||||||||||||||||||||||||||||||||||||||||||||||||||||||||||||||||||||||||||||||||||||||||||||||||||||||||||||||
|
|
2022 STATISTICAL LEADERS |
2022 GAME BY GAME STATS |
 |
2022 SCHEDULE |
2021 RESULTS |
||||||||||||||||||||||||||||||||||||||||||||||||||||||||||||||||||||||||||||||||||||||||||||||||||||||||||||||||||||||||||||||||||||||||||||||||||||||||||||||||||||||||||||||||||||||||||
|
|
2021 STATISTICAL LEADERS |
2021 GAME BY GAME STATS |
 |
2021 SCHEDULE |
2020 RESULTS |
||||||||||||||||||||||||||||||||||||||||||||||||||||||||||||||||||||||||||||||||||||||||||||||||||||||||||||||||||||||||||||||||||||||||||||||||||||||||||||||||||||||||||||||||||||||||||||||||
|
|
||||||||||||||||||||||||||||||||||||||||||||||||||||||||||||||||||||||||||||||||||||||||||||||||||||||||||||||||||||||||||||||||||||||||||||||||||||||||||||||||||||||||||||||||||||||||||||||||
2020 STATISTICAL LEADERS |
2020 GAME BY GAME STATS |
 |
2020 SCHEDULE |
2019 RESULTS |
||||||||||||||||||||||||||||||||||||||||||||||||||||||||||||||||||||||||||||||||||||||||||||||||||||||||||||||||||||||||||||||||||||||||||||||||||||||||||||||||||||||||||||||||||||||||||||||||||||||||||||||||||||||||
|
|
||||||||||||||||||||||||||||||||||||||||||||||||||||||||||||||||||||||||||||||||||||||||||||||||||||||||||||||||||||||||||||||||||||||||||||||||||||||||||||||||||||||||||||||||||||||||||||||||||||||||||||||||||||||||
2019 STATISTICAL LEADERS |
2019 GAME BY GAME STATS |
 |
2019 SCHEDULE |
2018 RESULTS |
|||||||||||||||||||||||||||||||||||||||||||||||||||||||||||||||||||||||||||||||||||||||||||||||||||||||||||||||||||||||||||||||||||||||||||||||||||||||||||||||||||||||||||||||||||||||||||||||||||||||||||||||||||||||||||
|
|
|||||||||||||||||||||||||||||||||||||||||||||||||||||||||||||||||||||||||||||||||||||||||||||||||||||||||||||||||||||||||||||||||||||||||||||||||||||||||||||||||||||||||||||||||||||||||||||||||||||||||||||||||||||||||||
2018 STATISTICAL LEADERS |
2018 GAME BY GAME STATS |
 |
2018 SCHEDULE |
2017 RESULTS |
|||||||||||||||||||||||||||||||||||||||||||||||||||||||||||||||||||||||||||||||||||||||||||||||||||||||||||||||||||||||||||||||||||||||||||||||||||||||||||||||||||||||||||||||||||||||||||||||||||||||||||||||||||||||||||||||||||||||
|
|
|||||||||||||||||||||||||||||||||||||||||||||||||||||||||||||||||||||||||||||||||||||||||||||||||||||||||||||||||||||||||||||||||||||||||||||||||||||||||||||||||||||||||||||||||||||||||||||||||||||||||||||||||||||||||||||||||||||||
2017 STATISTICAL LEADERS |
2017 GAME BY GAME STATS |
 |
2017 SCHEDULE |
2016 RESULTS |
|||||||||||||||||||||||||||||||||||||||||||||||||||||||||||||||||||||||||||||||||||||||||||||||||||||||||||||||||||||||||||||||||||||||||||||||||||||||||||||||||||||||||||||||||||||||||||||||||||||||||||||||||||||||||||||||||||||||
|
|
|||||||||||||||||||||||||||||||||||||||||||||||||||||||||||||||||||||||||||||||||||||||||||||||||||||||||||||||||||||||||||||||||||||||||||||||||||||||||||||||||||||||||||||||||||||||||||||||||||||||||||||||||||||||||||||||||||||||
2016 STATISTICAL LEADERS |
2016 GAME BY GAME STATS |
 |
2015 STATISTICAL LEADERS |
2015 GAME BY GAME STATS |
 |
2015 SCHEDULE |
2014 RESULTS |
||||||||||||||||||||||||||||||||||||||||||||||||||||||||||||||||||||||||||||||||||||||||||||||||||||||||||||||||||||||||||||||||||||||||||||||||||||||||||||||||||||||||||||||||||||||||||||||||||||||||||||||||||||||||||||||||||||||||||||||
|
|
||||||||||||||||||||||||||||||||||||||||||||||||||||||||||||||||||||||||||||||||||||||||||||||||||||||||||||||||||||||||||||||||||||||||||||||||||||||||||||||||||||||||||||||||||||||||||||||||||||||||||||||||||||||||||||||||||||||||||||||
2014 STATISTICAL LEADERS |
2014 GAME BY GAME STATS |
 |
2013 STATISTICAL LEADERS |
| Player | Att | Yds | YPC | TD | Player | Comp | Att | % | Yds | YPA | TD | INT | Rating | Player | Rec | Yds | YPC | TD |
| Jaquez Johnson | 173 | 771 | 4.5 | 10 | Jaquez Johnson | 149 | 256 | 58.2% | 1871 | 7.3 | 12 | 8 | 128.8 | Daniel McKinney | 49 | 615 | 12.6 | 1 |
| Jonathan Wallace | 119 | 548 | 4.6 | 3 | Greg Hankerson | 46 | 95 | 48.4% | 479 | 5.0 | 3 | 3 | 94.9 | William Dukes | 35 | 553 | 15.8 | 6 |
| Jay Warren | 71 | 340 | 4.8 | 2 | Daniel McKinney | 1 | 1 | 100.0% | 30 | 30.0 | 1 | 0 | 682.0 | Jenson Stoshak | 23 | 293 | 12.7 | 0 |
2013 GAME BY GAME STATS |
 |
2013 RESULTS |
2012 RESULTS |
|||||||||||||||||||||||||||||||||||||||||||||||||||||||||||||||||||||||||||||||||||||||||||||||||||||||||||||||||||||||||||||||||||||||||||||||||||||||||||||||||||||||||||||||||||||||||||||||||||||||||||||||||||||||||||||||||||||||||||||||||||||||||||||||||||||||
|
|
|||||||||||||||||||||||||||||||||||||||||||||||||||||||||||||||||||||||||||||||||||||||||||||||||||||||||||||||||||||||||||||||||||||||||||||||||||||||||||||||||||||||||||||||||||||||||||||||||||||||||||||||||||||||||||||||||||||||||||||||||||||||||||||||||||||||
2012 STATISTICAL LEADERS |
| Player | Att | Yds | YPC | TD | Player | Comp | Att | % | Yds | YPA | TD | INT | Rating | Player | Rec | Yds | YPC | TD | ||
| Jonathan Wallace | 175 | 668 | 3.8 | 6 | Graham Wilbert | 261 | 405 | 64.4% | 2814 | 6.9 | 18 | 6 | 134.5 | William Dukes | 63 | 979 | 15.5 | 4 | ||
| Damian Fortner | 90 | 313 | 3.5 | 3 | Stephen Curtis | 4 | 10 | 40.0% | 37 | 3.7 | 0 | 0 | 71.1 | Daniel McKinney | 48 | 492 | 10.3 | 2 | ||
| Martese Jackson | 47 | 224 | 4.8 | 1 | Byron Hankerson | 27 | 344 | 12.7 | 2 |
| 2012 Individual Player Stats • 2012 Start Chart/Starters Lost |
|---|
2012 GAME BY GAME STATS |
 |
2011 STATISTICAL LEADERS |
| Player | Att | Yds | YPC | TD | Player | Comp | Att | % | Yds | YPA | TD | INT | Rating | Player | Rec | Yds | YPC | TD | ||
| Alfred Morris | 235 | 1186 | 5.0 | 9 | Graham Wilbert | 153 | 291 | 52.6% | 1455 | 5.0 | 7 | 14 | 92.9 | Darian Williams | 26 | 291 | 11.2 | 3 | ||
| Xavier Stinson | 35 | 88 | 2.5 | 0 | David Kooi | 21 | 37 | 56.8% | 142 | 3.8 | 1 | 0 | 97.9 | DeAndre Richardson | 32 | 269 | 8.4 | 0 | ||
| DeAndre Richardson | 1 | 37 | 37.0 | 0 | Stephen Curtis | 10 | 21 | 47.6% | 90 | 4.3 | 0 | 0 | 83.6 | Marcus Cunningham | 18 | 257 | 14.3 | 1 |
| 2011 Individual Player Stats • 2011 START CHART/STARTERS LOST |
|---|
2011 GAME BY GAME STATS |
2011 RESULTS |
2010 RESULTS |
|||||||||||||||||||||||||||||||||||||||||||||||||||||||||||||||||||||||||||||||||||||||||||||||||||||||||||||||||||||||||||||||||||||||||||||||||||||||||||||||||||||||||||||||||||||||||||||||||||
|
|
|||||||||||||||||||||||||||||||||||||||||||||||||||||||||||||||||||||||||||||||||||||||||||||||||||||||||||||||||||||||||||||||||||||||||||||||||||||||||||||||||||||||||||||||||||||||||||||||||||
2010 STATISTICAL LEADERS |
| Player | Att | Yds | YPC | TD | Player | Comp | Att | % | Yds | YPA | TD | INT | Rating | Player | Rec | Yds | YPC | TD | ||
| Alfred Morris | 228 | 928 | 4.07 | 6 | Jeff Van Camp | 191 | 334 | 57.2% | 2451 | 7.3 | 17 | 13 | 127.8 | Lester Jean | 64 | 988 | 15.4 | 8 | ||
| Willie Floyd | 39 | 261 | 6.69 | 1 | Graham Wilbert | 1 | 5 | 20.0% | 41 | 8.2 | 0 | 1 | 48.9 | Rob Housler | 38 | 626 | 16.5 | 4 | ||
| Xavier Stinson | 29 | 95 | 3.28 | 0 | David Kooi | 0 | 2 | 0.0% | 0 | 0.0 | 0 | 0 | 0.0 | Avery Holley | 25 | 293 | 11.7 | 1 |
2010 GAME BY GAME STATS |
2009 STATISTICAL LEADERS |
| Player | Att | Yds | YPC | TD | Player | Comp | Att | % | Yds | YPA | TD | INT | Rating | Player | Rec | Yds | YPC | TD | ||
| Alfred Morris | 263 | 1392 | 5.29 | 11 | Rusty Smith | 145 | 253 | 57.3% | 1915 | 7.6 | 14 | 5 | 135.2 | Jason Harmon | 48 | 649 | 13.5 | 6 | ||
| Willie Rose | 62 | 307 | 4.95 | 1 | Jeff VanCamp | 109 | 184 | 59.2% | 1372 | 7.5 | 12 | 2 | 141.2 | Chris Bonner | 32 | 571 | 17.8 | 6 | ||
| Xavier Stinson | 30 | 94 | 3.13 | 0 | David Kooi | 3 | 6 | 50.0% | 69 | 11.5 | 0 | 0 | 146.6 | Lester Jean | 38 | 501 | 13.2 | 4 |
| 2009 Individual Player Stats |
|---|
2009 GAME BY GAME STATS |
2009 RESULTS |
2008 RESULTS |
|||||||||||||||||||||||||||||||||||||||||||||||||||||||||||||||||||||||||||||||||||||||||||||||||||||||||||||||||||||||||||||||||||||||||||||||||||||||||||
|
|
|||||||||||||||||||||||||||||||||||||||||||||||||||||||||||||||||||||||||||||||||||||||||||||||||||||||||||||||||||||||||||||||||||||||||||||||||||||||||||
| 2008 Individual Player Stats • 2007 Individual Player Stats |
|---|