| MEMPHIS TIGERS |
|---|
|
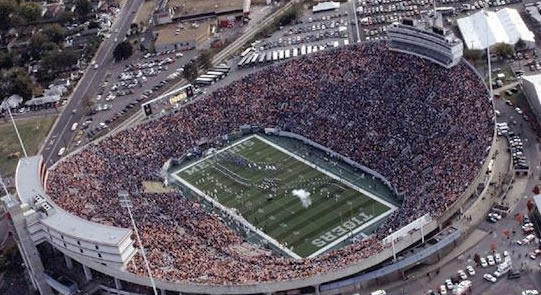
STADIUM: Liberty Bowl Memorial Stadium PLAYING SURFACE: AstroTurf • CAPACITY: 58,325 STARTERS RETURNING (O/D): 5*/4 LETTERMAN RETURNING: 18 (7,10,1) • LETTERMAN LOST: 41 (17,20,4) |
 |
|
| LOCATION: Memphis, TN | |
| FOUNDED: 1912 | |
| ENROLLMENT: 16,702 | |
| COLORS: Royal Blue & Gray | |
| MASCOT: Bengal Tiger | |
| CONFE: AAC | |
| Head Coach: Ryan Silverfield |
|
| Years with Team: 6th | |
| Overall Record: 42-21 | |
| Record with Team: 42-21 | |
| 2025 STATISTICAL LEADERS |
|---|

| 2025 GAME BY GAME STATS |
|---|
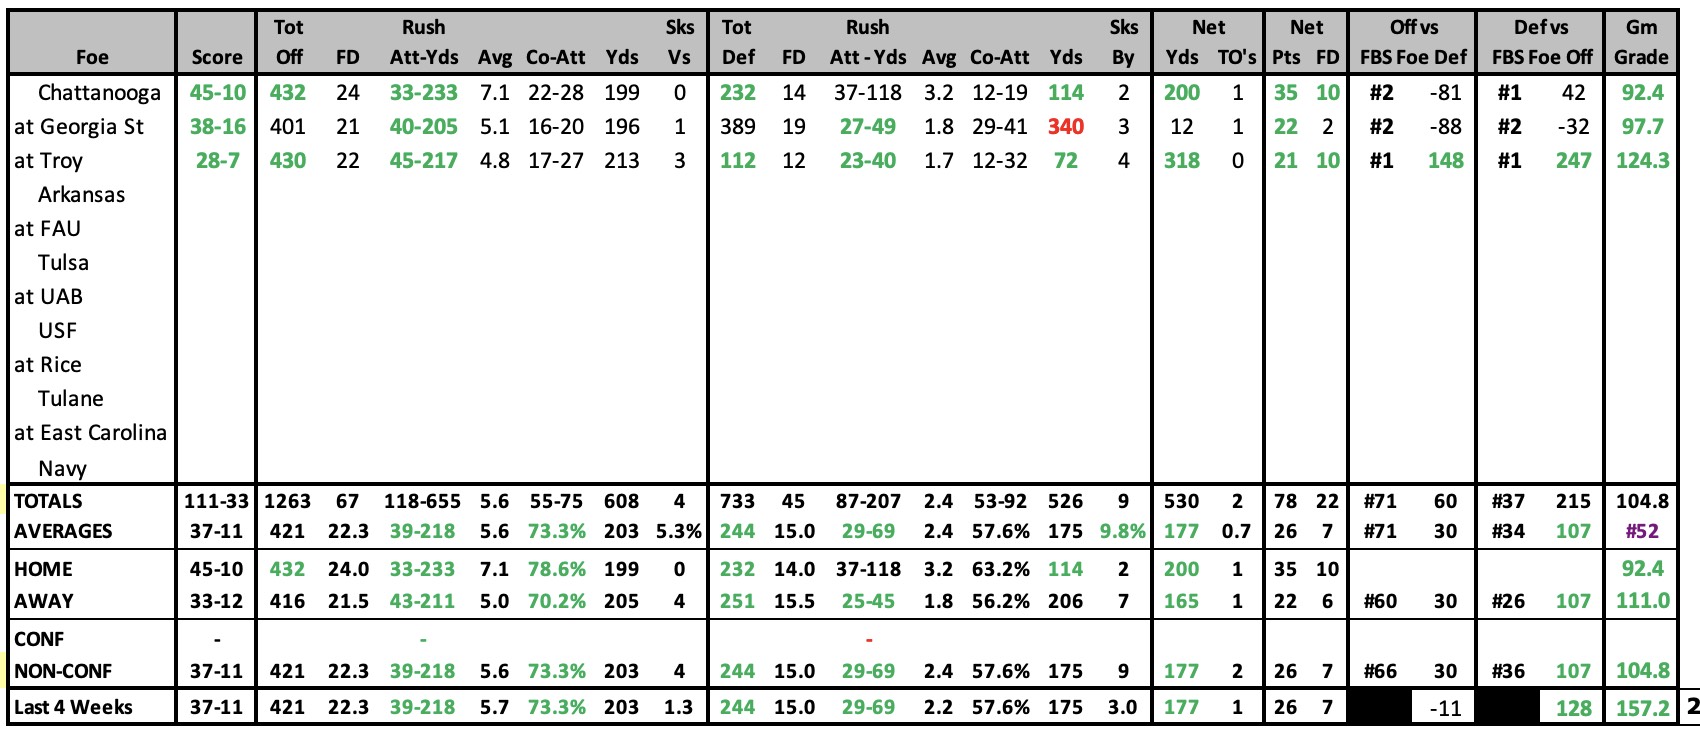
2025 SCHEDULE |
2024 RESULTS |
||||||||||||||||||||||||||||||||||||||||||||||||||||||||||||||||||||||||||||||||||||||||||||||||||||||||||||||||||||||||||||||||||||||||||||||||||||||||||||||||||||||||||||||||||||||||||||||||||||||||||||
|
|
||||||||||||||||||||||||||||||||||||||||||||||||||||||||||||||||||||||||||||||||||||||||||||||||||||||||||||||||||||||||||||||||||||||||||||||||||||||||||||||||||||||||||||||||||||||||||||||||||||||||||||
| 2024 STATISTICAL LEADERS |
|---|

| 2024 GAME BY GAME STATS |
|---|

| 2023 STATISTICAL LEADERS |
|---|

| 2023 GAME BY GAME STATS |
|---|

2023 SCHEDULE |
2022 RESULTS |
||||||||||||||||||||||||||||||||||||||||||||||||||||||||||||||||||||||||||||||||||||||||||||||||||||||||||||||||||||||||||||||||||||||||||||||||||||||||||||||||||||||||||||||||||||||||||||||||||||||
|
|
||||||||||||||||||||||||||||||||||||||||||||||||||||||||||||||||||||||||||||||||||||||||||||||||||||||||||||||||||||||||||||||||||||||||||||||||||||||||||||||||||||||||||||||||||||||||||||||||||||||
| 2022 STATISTICAL LEADERS |
|---|

| 2022 GAME BY GAME STATS |
|---|

2022 SCHEDULE |
2021 RESULTS |
||||||||||||||||||||||||||||||||||||||||||||||||||||||||||||||||||||||||||||||||||||||||||||||||||||||||||||||||||||||||||||||||||||||||||||||||||||||||||||||||||||||||||||||||||||||||||||||||||||||
|
|
||||||||||||||||||||||||||||||||||||||||||||||||||||||||||||||||||||||||||||||||||||||||||||||||||||||||||||||||||||||||||||||||||||||||||||||||||||||||||||||||||||||||||||||||||||||||||||||||||||||
| 2021 STATISTICAL LEADERS |
|---|

| 2021 GAME BY GAME STATS |
|---|

2021 SCHEDULE |
2020 RESULTS |
||||||||||||||||||||||||||||||||||||||||||||||||||||||||||||||||||||||||||||||||||||||||||||||||||||||||||||||||||||||||||||||||||||||||||||||||||||||||||||||||||||||||||||||||||||||||||||||||||||||||||||
|
|
||||||||||||||||||||||||||||||||||||||||||||||||||||||||||||||||||||||||||||||||||||||||||||||||||||||||||||||||||||||||||||||||||||||||||||||||||||||||||||||||||||||||||||||||||||||||||||||||||||||||||||
| 2020 STATISTICAL LEADERS |
|---|

| 2020 GAME BY GAME STATS |
|---|

2020 SCHEDULE |
2019 RESULTS |
||||||||||||||||||||||||||||||||||||||||||||||||||||||||||||||||||||||||||||||||||||||||||||||||||||||||||||||||||||||||||||||||||||||||||||||||||||||||||||||||||||||||||||||||||||||||||||||||||||||||||||||||||||||||||||||
|
|
||||||||||||||||||||||||||||||||||||||||||||||||||||||||||||||||||||||||||||||||||||||||||||||||||||||||||||||||||||||||||||||||||||||||||||||||||||||||||||||||||||||||||||||||||||||||||||||||||||||||||||||||||||||||||||||
| 2019 STATISTICAL LEADERS |
|---|

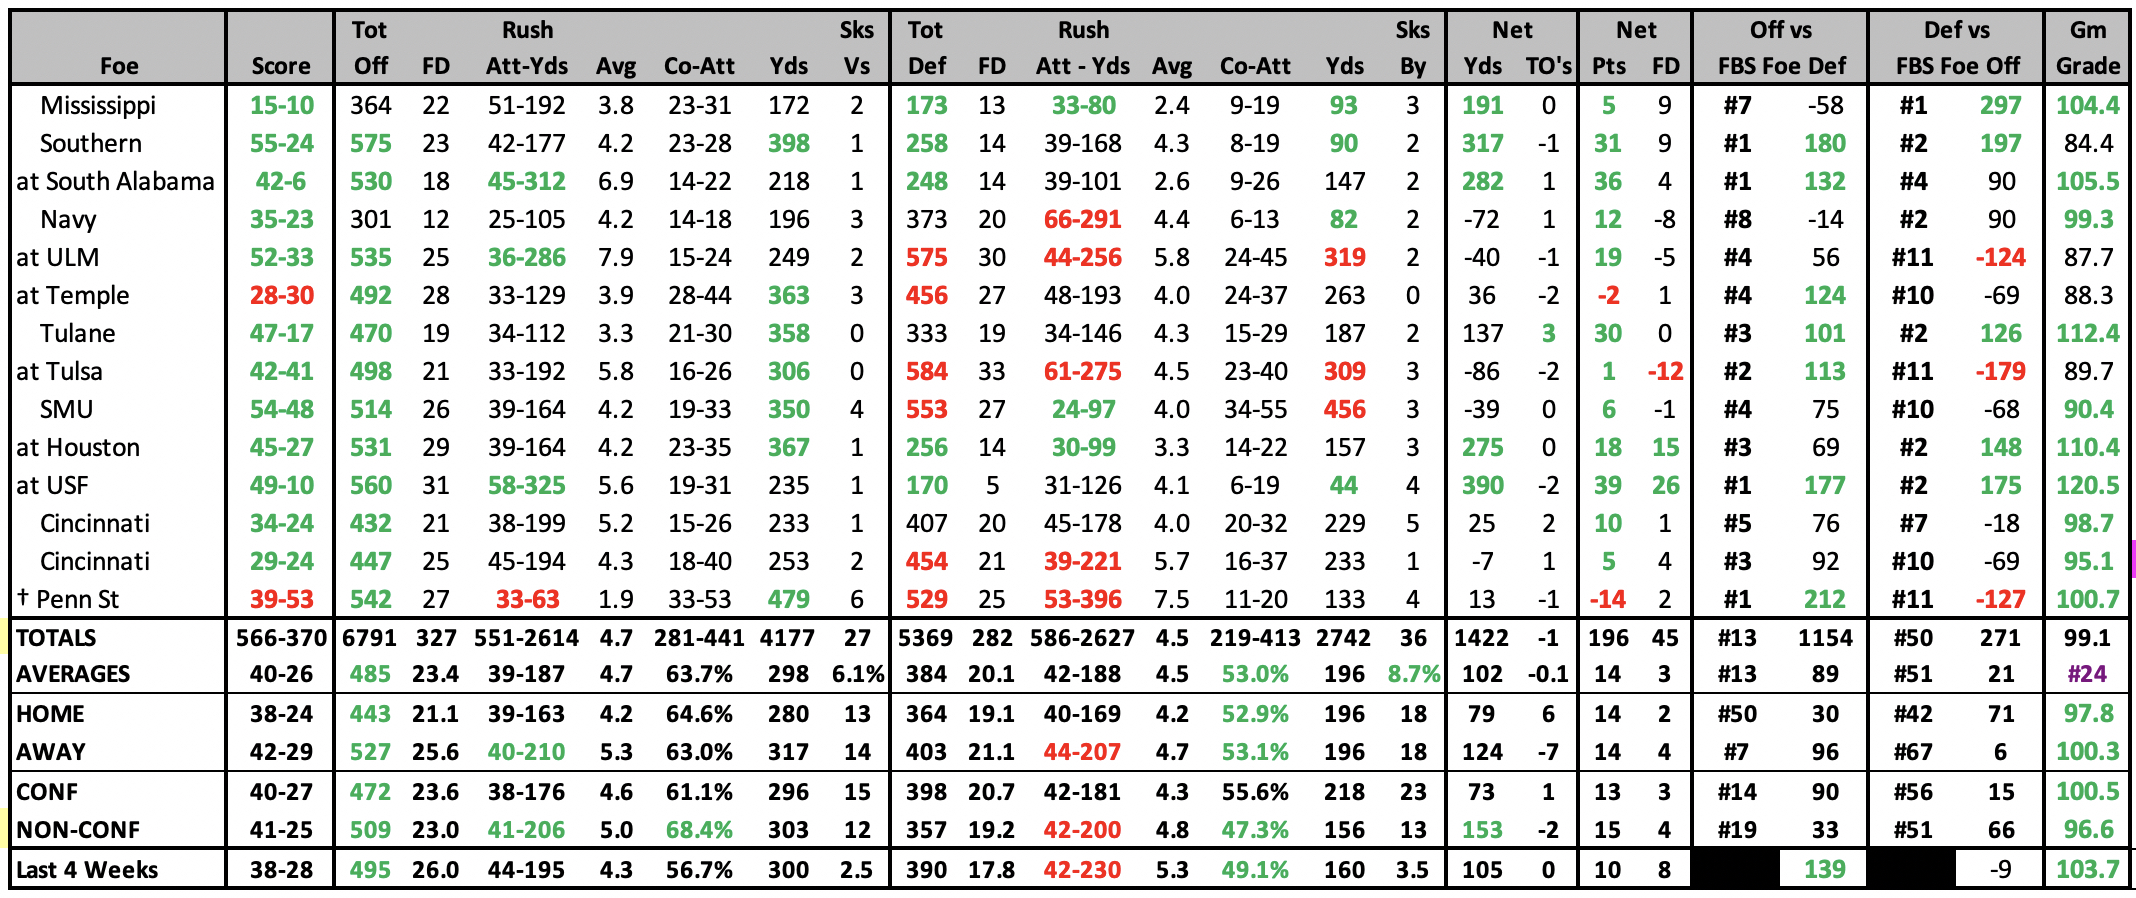
| 2019 GAME BY GAME STATS |
|---|
 |
2019 SCHEDULE |
2018 RESULTS |
||||||||||||||||||||||||||||||||||||||||||||||||||||||||||||||||||||||||||||||||||||||||||||||||||||||||||||||||||||||||||||||||||||||||||||||||||||||||||||||||||||||||||||||||||||||||||||||||||||||||||||||||||||||||||||||||||||||||||||||||
|
|
||||||||||||||||||||||||||||||||||||||||||||||||||||||||||||||||||||||||||||||||||||||||||||||||||||||||||||||||||||||||||||||||||||||||||||||||||||||||||||||||||||||||||||||||||||||||||||||||||||||||||||||||||||||||||||||||||||||||||||||||
| 2018 STATISTICAL LEADERS |
|---|

| 2018 GAME BY GAME STATS |
|---|
 |
2018 SCHEDULE |
2017 RESULTS |
||||||||||||||||||||||||||||||||||||||||||||||||||||||||||||||||||||||||||||||||||||||||||||||||||||||||||||||||||||||||||||||||||||||||||||||||||||||||||||||||||||||||||||||||||||||||||||||||||||||||||||||||||||||||||||||||||||||||||||||||||||||||||||
|
|
||||||||||||||||||||||||||||||||||||||||||||||||||||||||||||||||||||||||||||||||||||||||||||||||||||||||||||||||||||||||||||||||||||||||||||||||||||||||||||||||||||||||||||||||||||||||||||||||||||||||||||||||||||||||||||||||||||||||||||||||||||||||||||
| 2017 STATISTICAL LEADERS |
|---|

| 2017 GAME BY GAME STATS |
|---|
 |
2017 SCHEDULE |
2016 RESULTS |
|||||||||||||||||||||||||||||||||||||||||||||||||||||||||||||||||||||||||||||||||||||||||||||||||||||||||||||||||||||||||||||||||||||||||||||||||||||||||||||||||||||||||||||||||||||||||||||||||||||||||||||||||||||||||||||||||||||||||||||||||||||
|
|
|||||||||||||||||||||||||||||||||||||||||||||||||||||||||||||||||||||||||||||||||||||||||||||||||||||||||||||||||||||||||||||||||||||||||||||||||||||||||||||||||||||||||||||||||||||||||||||||||||||||||||||||||||||||||||||||||||||||||||||||||||||
| 2016 STATISTICAL LEADERS |
|---|

| 2016 GAME BY GAME STATS |
|---|
 |
| 2015 STATISTICAL LEADERS |
|---|

| 2015 GAME BY GAME STATS |
|---|
 |
2015 SCHEDULE |
2014 RESULTS |
||||||||||||||||||||||||||||||||||||||||||||||||||||||||||||||||||||||||||||||||||||||||||||||||||||||||||||||||||||||||||||||||||||||||||||||||||||||||||||||||||||||||||||||||||||||||||||||||||||||||||||||||||||||||||||||||||||||||||||||
|
|
||||||||||||||||||||||||||||||||||||||||||||||||||||||||||||||||||||||||||||||||||||||||||||||||||||||||||||||||||||||||||||||||||||||||||||||||||||||||||||||||||||||||||||||||||||||||||||||||||||||||||||||||||||||||||||||||||||||||||||||
| 2014 STATISTICAL LEADERS |
|---|

| 2014 GAME BY GAME STATS |
|---|
 |
| 2013 STATISTICAL LEADERS |
|---|
| Player | Att | Yds | YPC | TD | Player | Comp | Att | % | Yds | YPA | TD | INT | Rating | Player | Rec | Yds | YPC | TD |
| Brandon Hayes | 201 | 860 | 4.3 | 5 | Paxton Lynch | 202 | 348 | 58.0% | 2050 | 5.9 | 9 | 11 | 109.7 | Joe Craig | 37 | 338 | 9.1 | 0 |
| Marquis Warford | 51 | 303 | 5.9 | 1 | Jacob Karam | 2 | 3 | 66.7% | 16 | 5.3 | 0 | 0 | 111.5 | Sam Craft | 29 | 319 | 11.0 | 1 |
| Dorola Dorceus | 30 | 173 | 5.8 | 0 | Brandon Hayes | 1 | 5 | 20.0% | 6 | 1.2 | 0 | 1 | -9.9 | Keiwone Malone | 25 | 311 | 12.4 | 1 |
| 2013 GAME BY GAME STATS |
|---|
 |
2013 SCHEDULE |
2012 RESULTS |
||||||||||||||||||||||||||||||||||||||||||||||||||||||||||||||||||||||||||||||||||||||||||||||||||||||||||||||||||||||||||||||||||||||||||||||||||||||||||||||||||||||||||||||||||||||||||||||||||||||||||||||||||||||||||||||||||||||||||||||||||||||||||||||
|
|
||||||||||||||||||||||||||||||||||||||||||||||||||||||||||||||||||||||||||||||||||||||||||||||||||||||||||||||||||||||||||||||||||||||||||||||||||||||||||||||||||||||||||||||||||||||||||||||||||||||||||||||||||||||||||||||||||||||||||||||||||||||||||||||
| 2012 STATISTICAL LEADERS |
|---|
| Player | Att | Yds | YPC | TD | Player | Comp | Att | % | Yds | YPA | TD | INT | Rating | Player | Rec | Yds | YPC | TD | ||
| Brandon Hayes | 118 | 576 | 4.9 | 6 | Jacob Karam | 176 | 274 | 64.2% | 1895 | 6.9 | 14 | 3 | 137.0 | Marcus Rucker | 47 | 525 | 11.2 | 3 | ||
| Jai Steib | 119 | 427 | 3.6 | 6 | Tom Hornsey | 1 | 1 | 100.0% | 61 | 61.0 | 0 | 0 | 612.4 | Kelwone Malone | 44 | 476 | 10.8 | 3 | ||
| Jerrell Rhodes | 52 | 224 | 4.3 | 2 | Eric Mathews | 3 | 5 | 60.0% | 24 | 4.8 | 1 | 0 | 166.3 | Alan Cross | 23 | 301 | 13.1 | 5 |
| 2012 Individual Player Stats • 2012 Start Chart/Starters Lost |
|---|
| 2012 GAME BY GAME STATS |
|---|
 |
| 2011 STATISTICAL LEADERS |
|---|
| Player | Att | Yds | YPC | TD | Player | Comp | Att | % | Yds | YPA | TD | INT | Rating | Player | Rec | Yds | YPC | TD | ||
| Billy Foster | 132 | 479 | 3.6 | 6 | Taylor Reed | 169 | 295 | 57.3% | 1690 | 5.7 | 10 | 4 | 113.9 | Tannar Rehrer | 70 | 593 | 8.5 | 4 | ||
| Artaves Gibson | 104 | 316 | 3.0 | 0 | Andy Summerlin | 45 | 94 | 47.9% | 469 | 5.0 | 0 | 2 | 85.5 | Kevin Wright | 36 | 398 | 11.1 | 1 | ||
| Jerrell Rhodes | 30 | 152 | 5.1 | 2 | Skylar Jones | 10 | 18 | 55.6% | 124 | 6.9 | 0 | 2 | 91.2 | Billy Foster | 22 | 299 | 13.6 | 1 |
| 2011 Individual Player Stats |
|---|
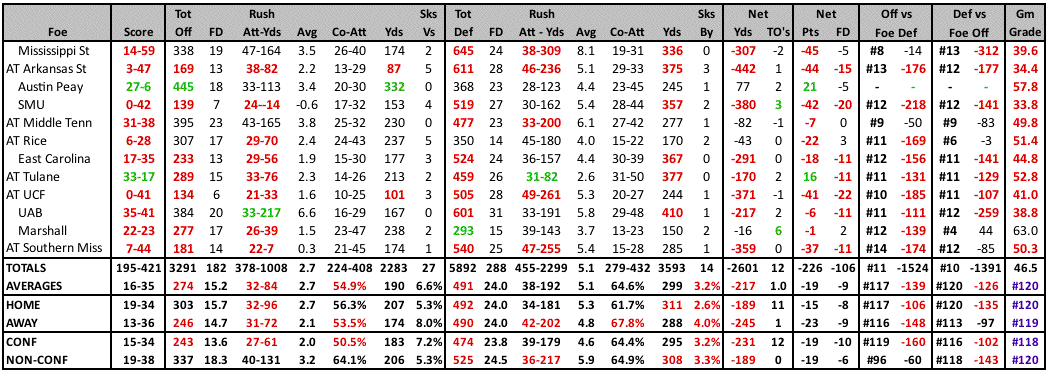
| 2011 GAME BY GAME STATS |
|---|
2011 RESULTS |
2010 RESULTS |
|||||||||||||||||||||||||||||||||||||||||||||||||||||||||||||||||||||||||||||||||||||||||||||||||||||||||||||||||||||||||||||||||||||||||||||||||||||||||||||||||||
|
|
|||||||||||||||||||||||||||||||||||||||||||||||||||||||||||||||||||||||||||||||||||||||||||||||||||||||||||||||||||||||||||||||||||||||||||||||||||||||||||||||||||
| 2010 STATISTICAL LEADERS |
|---|
| Player | Att | Yds | YPC | TD | Player | Comp | Att | % | Yds | YPA | TD | INT | Rating | Player | Rec | Yds | YPC | TD | ||
| Gregory Ray | 157 | 676 | 4.31 | 3 | Ryan Williams | 165 | 290 | 56.9% | 2075 | 7.2 | 13 | 10 | 124.9 | Marcus Rucker | 41 | 704 | 17.2 | 8 | ||
| Jerrell Rhodes | 116 | 469 | 4.04 | 1 | Cannon Smith | 22 | 43 | 51.2% | 246 | 5.7 | 1 | 3 | 92.9 | Jermaine McKenzie | 24 | 405 | 16.9 | 3 | ||
| Jeremy Longstreet | 15 | 42 | 2.80 | 0 | Tyler Bass | 0 | 2 | 0.0% | 0 | 0.0 | 0 | 0 | 0.0 | Tannar Rehrer | 23 | 284 | 12.3 | 0 |
| 2010 Individual Player Stats |
|---|
| 2010 GAME BY GAME STATS |
|---|
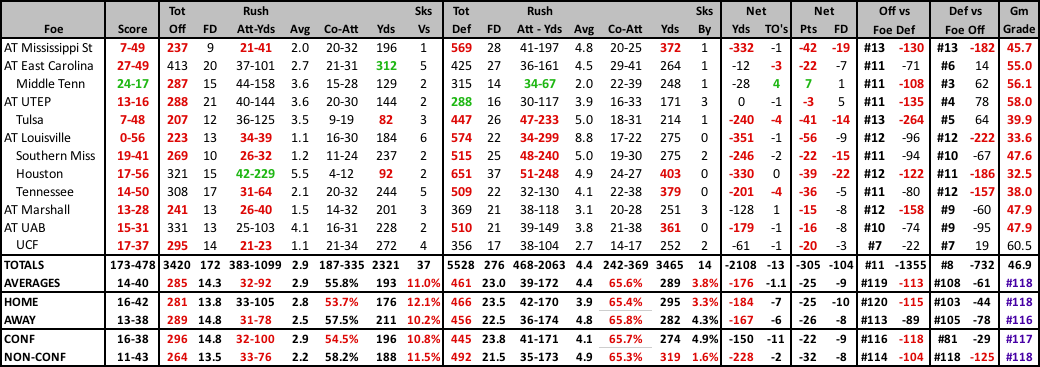
| 2009 STATISTICAL LEADERS |
|---|
| Player | Att | Yds | YPC | TD | Player | Comp | Att | % | Yds | YPA | TD | INT | Rating | Player | Rec | Yds | YPC | TD | ||
| Curtis Steele | 198 | 1239 | 6.26 | 15 | Will Hudgens | 141 | 235 | 60.0% | 1538 | 6.5 | 7 | 6 | 119.7 | Duke Calhoun | 66 | 917 | 13.9 | 5 | ||
| TJ Pitts | 83 | 343 | 4.13 | 0 | Tyler Bass | 53 | 81 | 65.4% | 673 | 8.3 | 6 | 4 | 149.8 | Carlos Singleton | 39 | 507 | 13.0 | 3 | ||
| Tyler Bass | 42 | 180 | 4.29 | 1 | Arkelon Hall | 44 | 82 | 53.7% | 332 | 4.0 | 0 | 5 | 75.5 | Marcus Rucker | 18 | 241 | 13.4 | 2 |
|
|---|
| 2009 GAME BY GAME STATS |
|---|
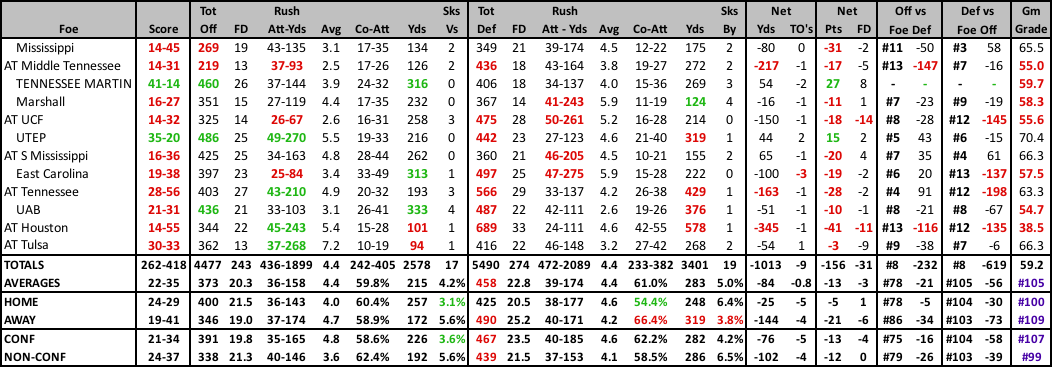
2009 RESULTS |
2008 RESULTS |
|||||||||||||||||||||||||||||||||||||||||||||||||||||||||||||||||||||||||||||||||||||||||||||||||||||||||||||||||||||||||||||||||||||||||||||||||||||||||||
|
|
|||||||||||||||||||||||||||||||||||||||||||||||||||||||||||||||||||||||||||||||||||||||||||||||||||||||||||||||||||||||||||||||||||||||||||||||||||||||||||
| 2008 Individual Player Stats • 2007 Individual Player Stats |
|---|

