
NORTH TEXAS MEAN GREEN |
|
STADIUM: DATCU Stadium PLAYING SURFACE: SportsExe PowerBlade HP • CAPACITY: 30,850 STARTERS RETURNING (O/D): 5/9 LETTERMAN RETURNING: 32 (14,15,3) • LETTERMAN LOST: 34 (14,18,2) |
 |
|
| LOCATION: Denton, TX | |
| FOUNDED: 1890 | |
| ENROLLMENT: 32,596 | |
| COLORS: Green & White | |
| MASCOT: Scrappy | |
| CONFERENCE: AAC | |
| Head Coach: Eric Morris | |
| Yrs with Tm: 3rd | |
| Overall Record: 11-14 | |
| Record with Tm: 11-14 |
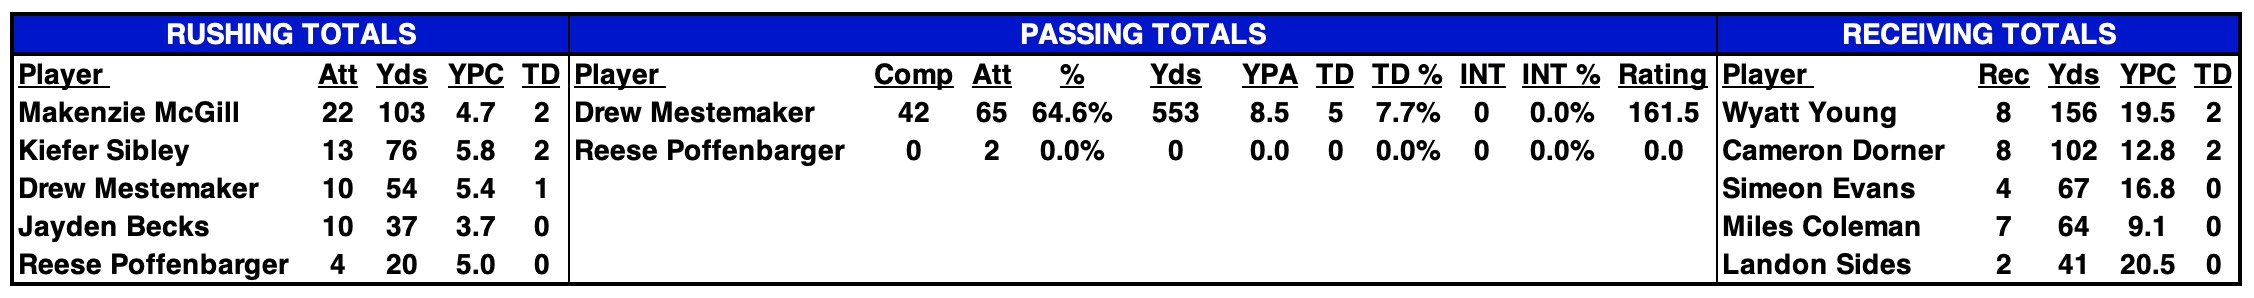
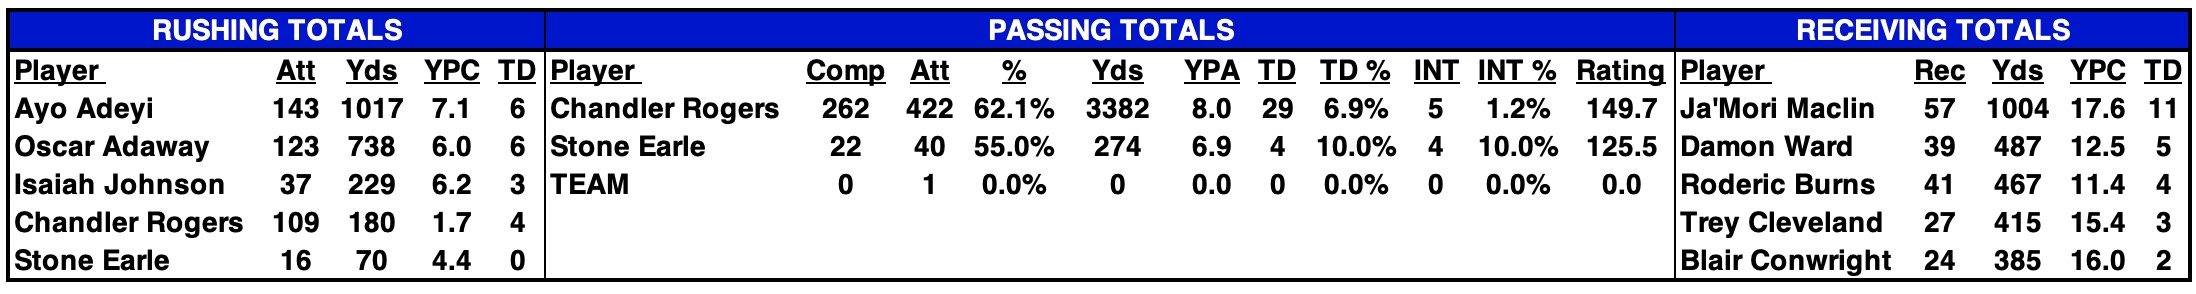
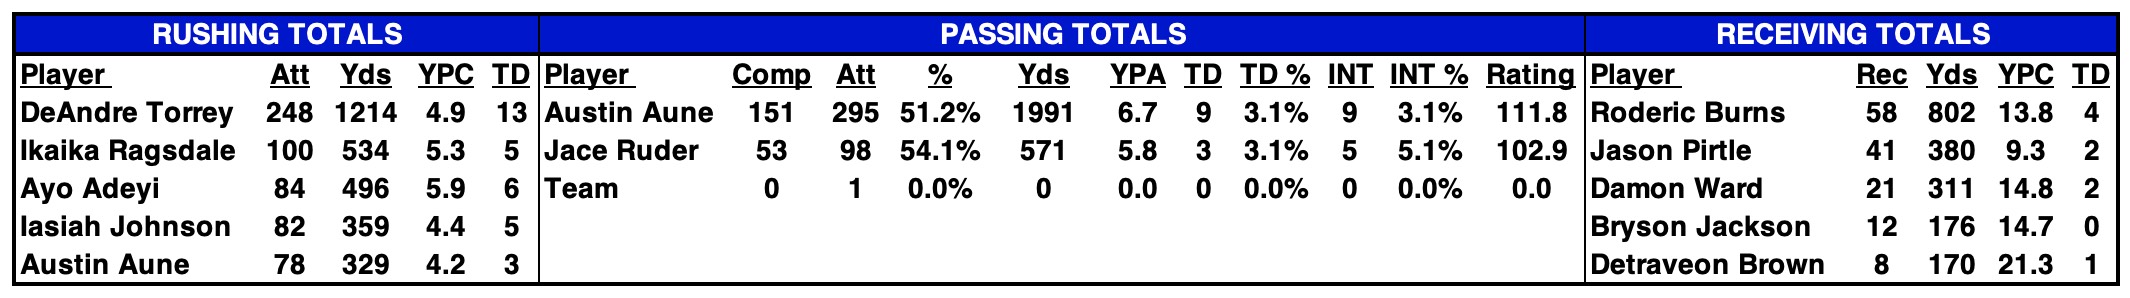
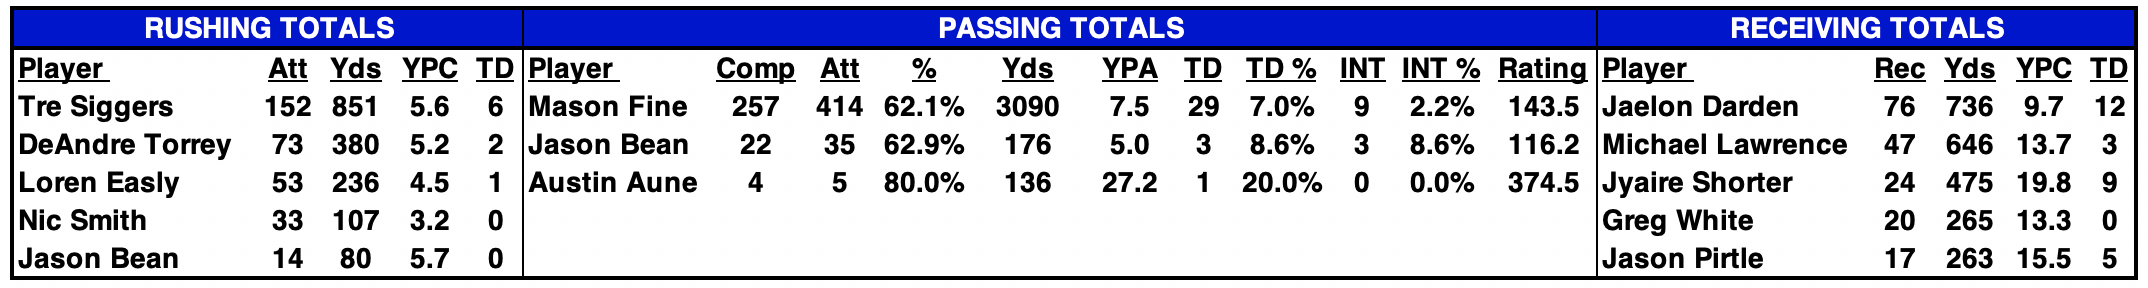
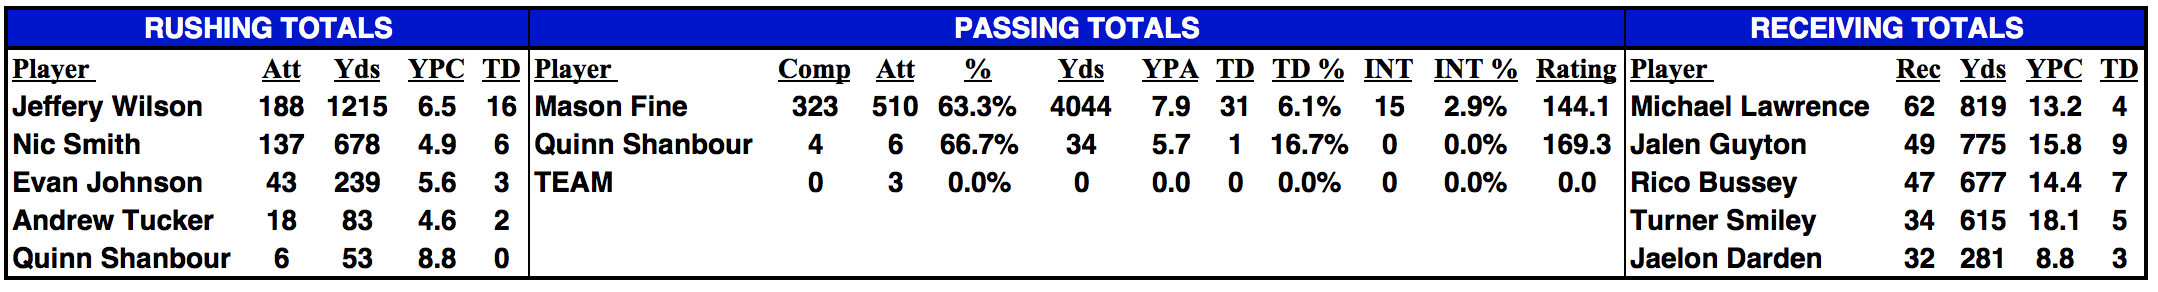
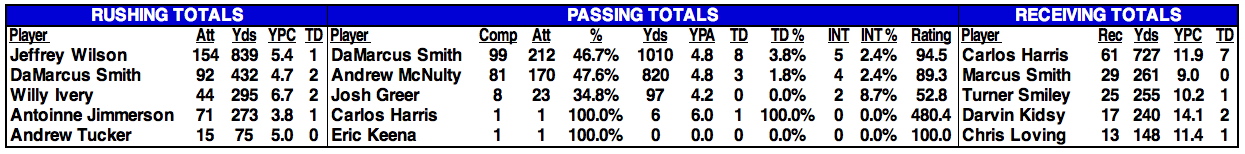
2025 STATISTICAL LEADERS |
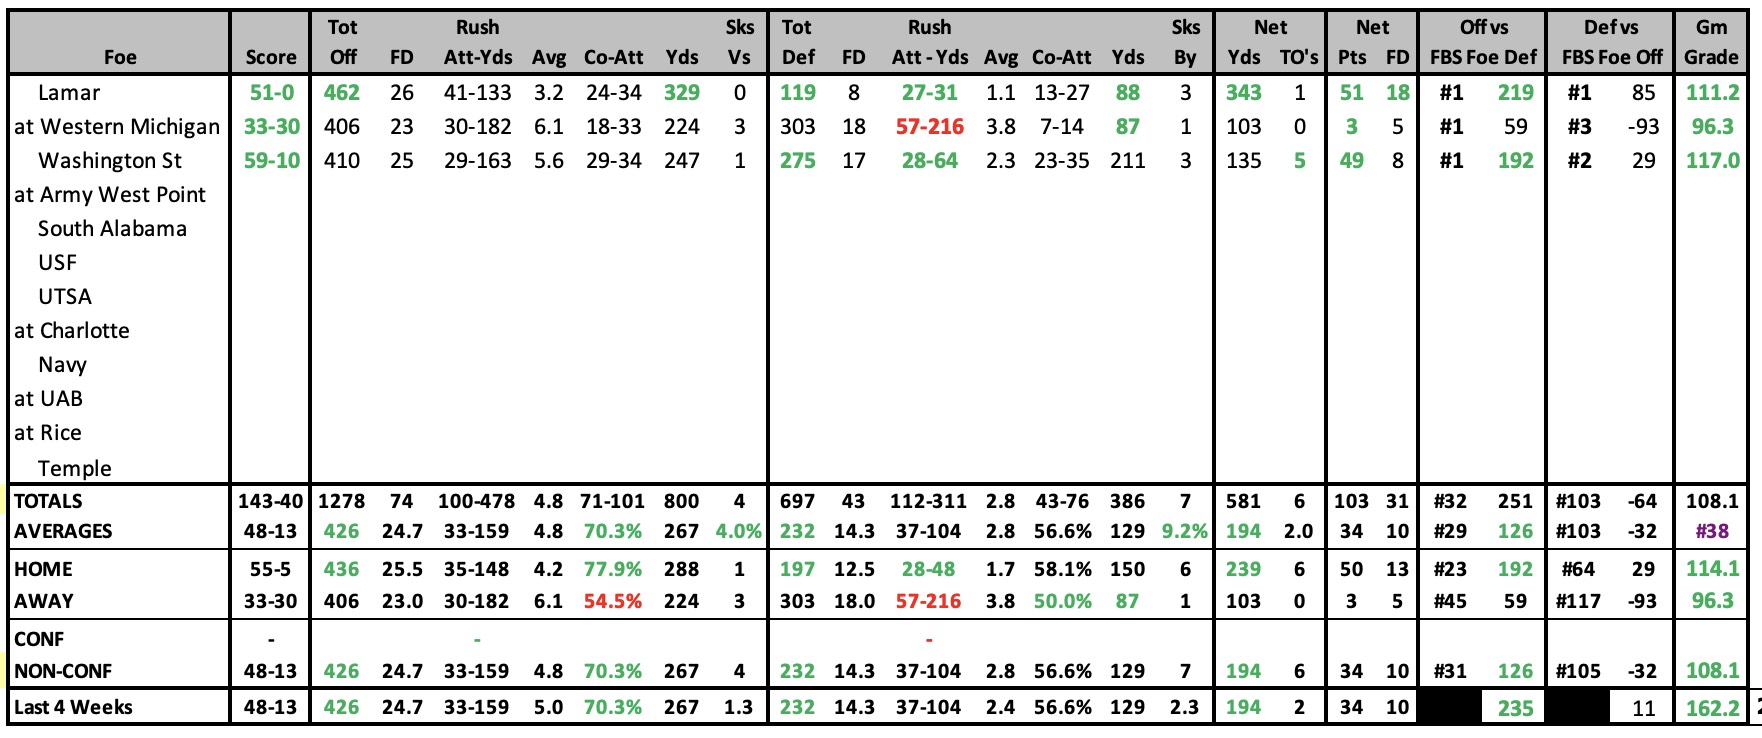
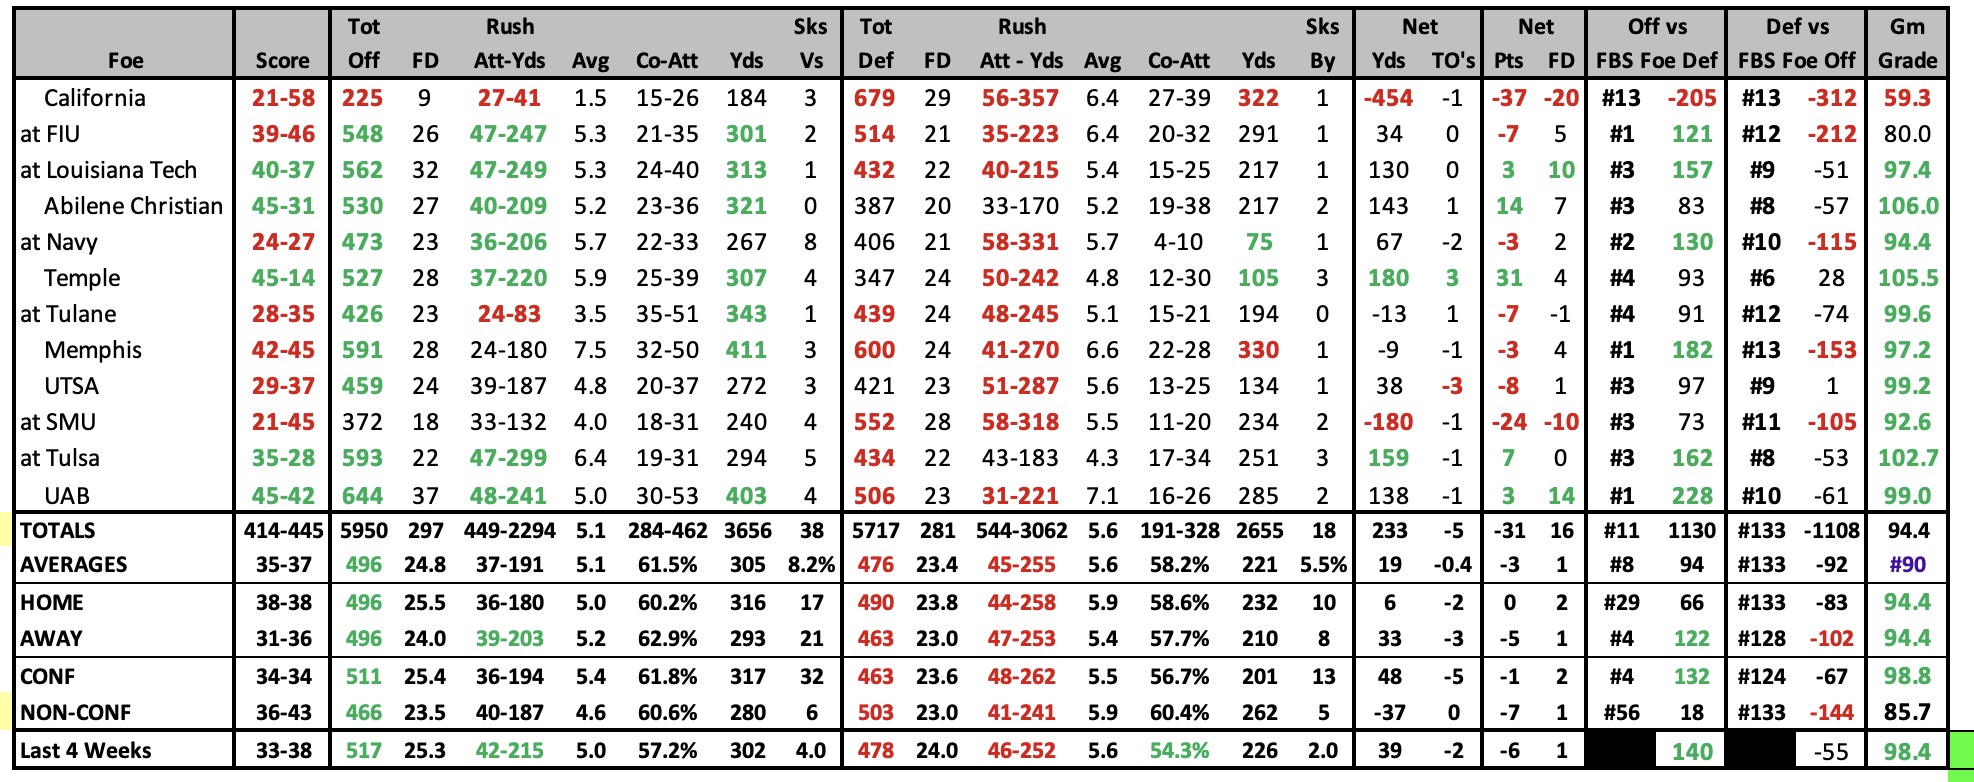
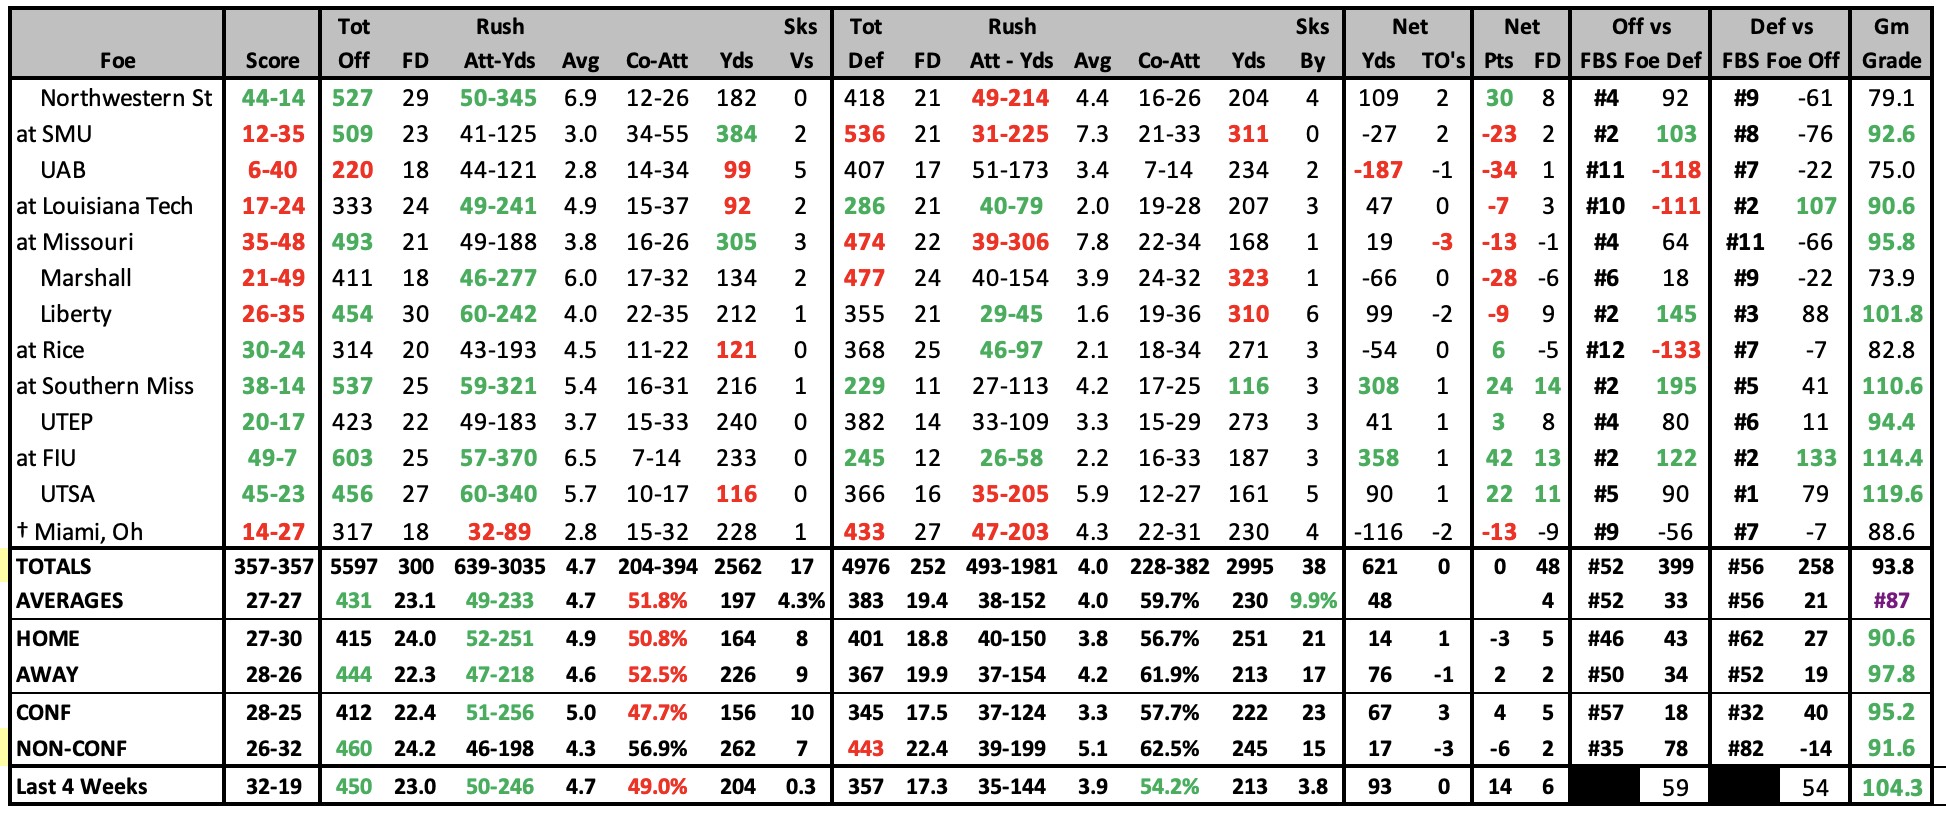
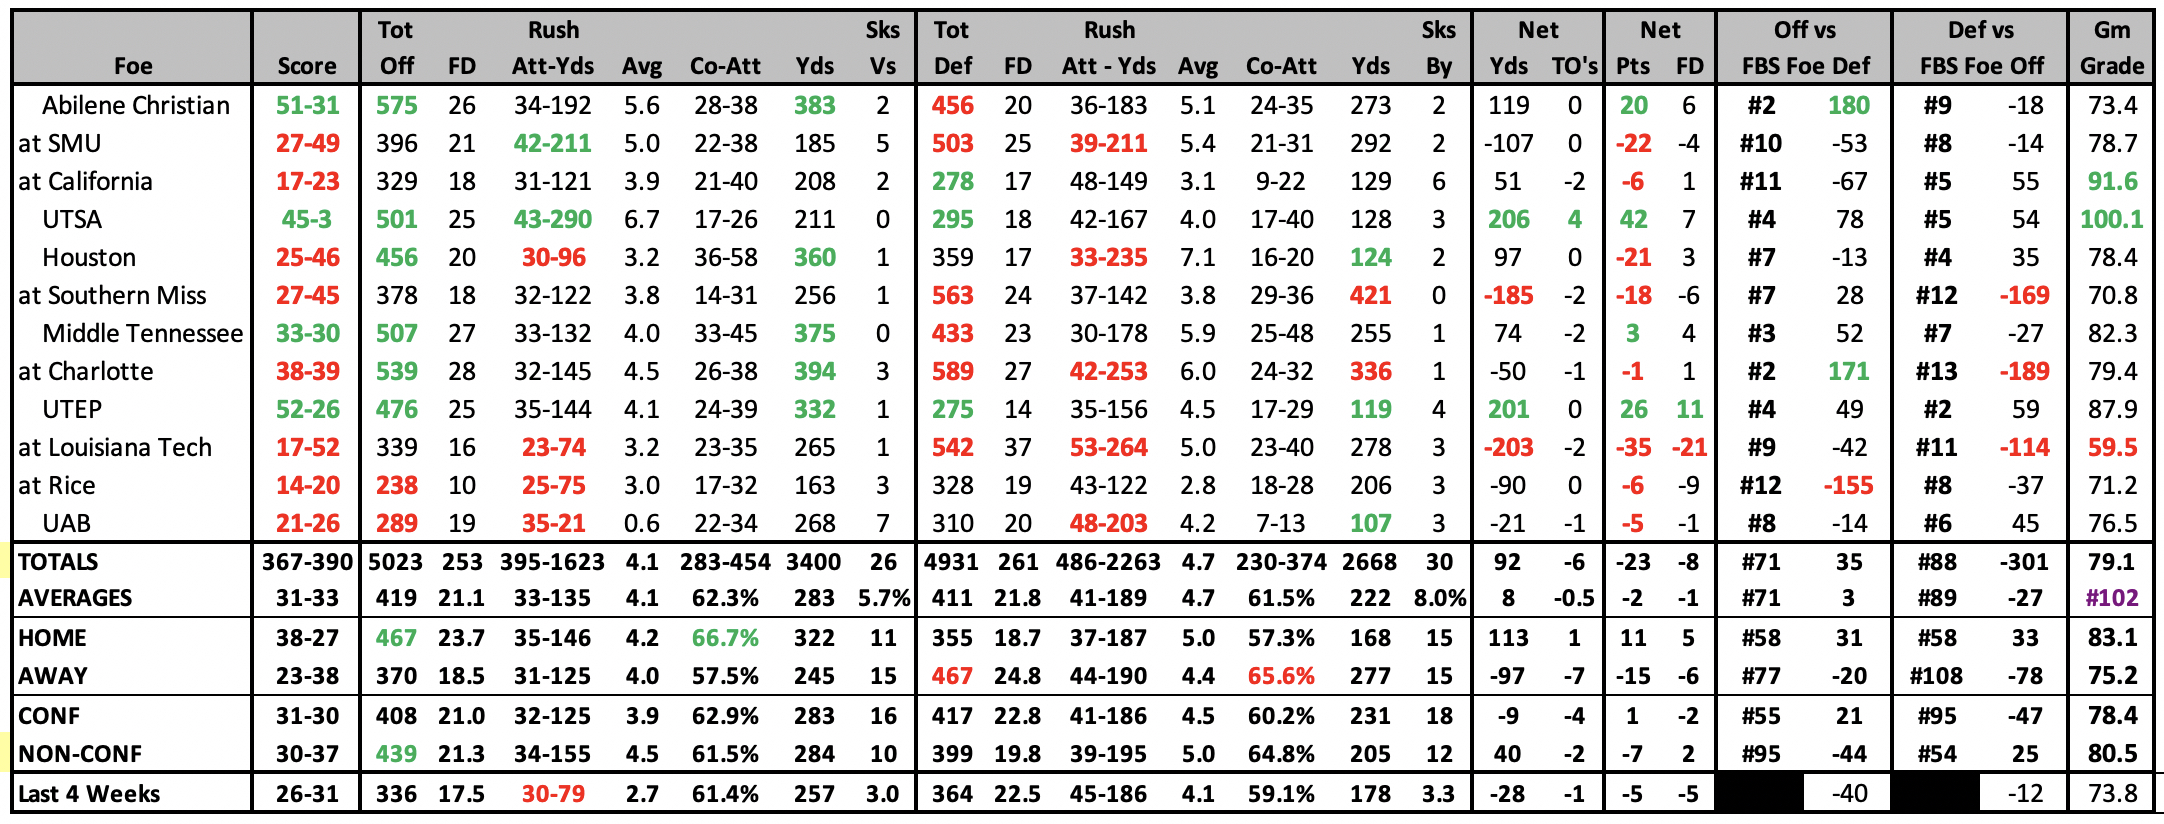
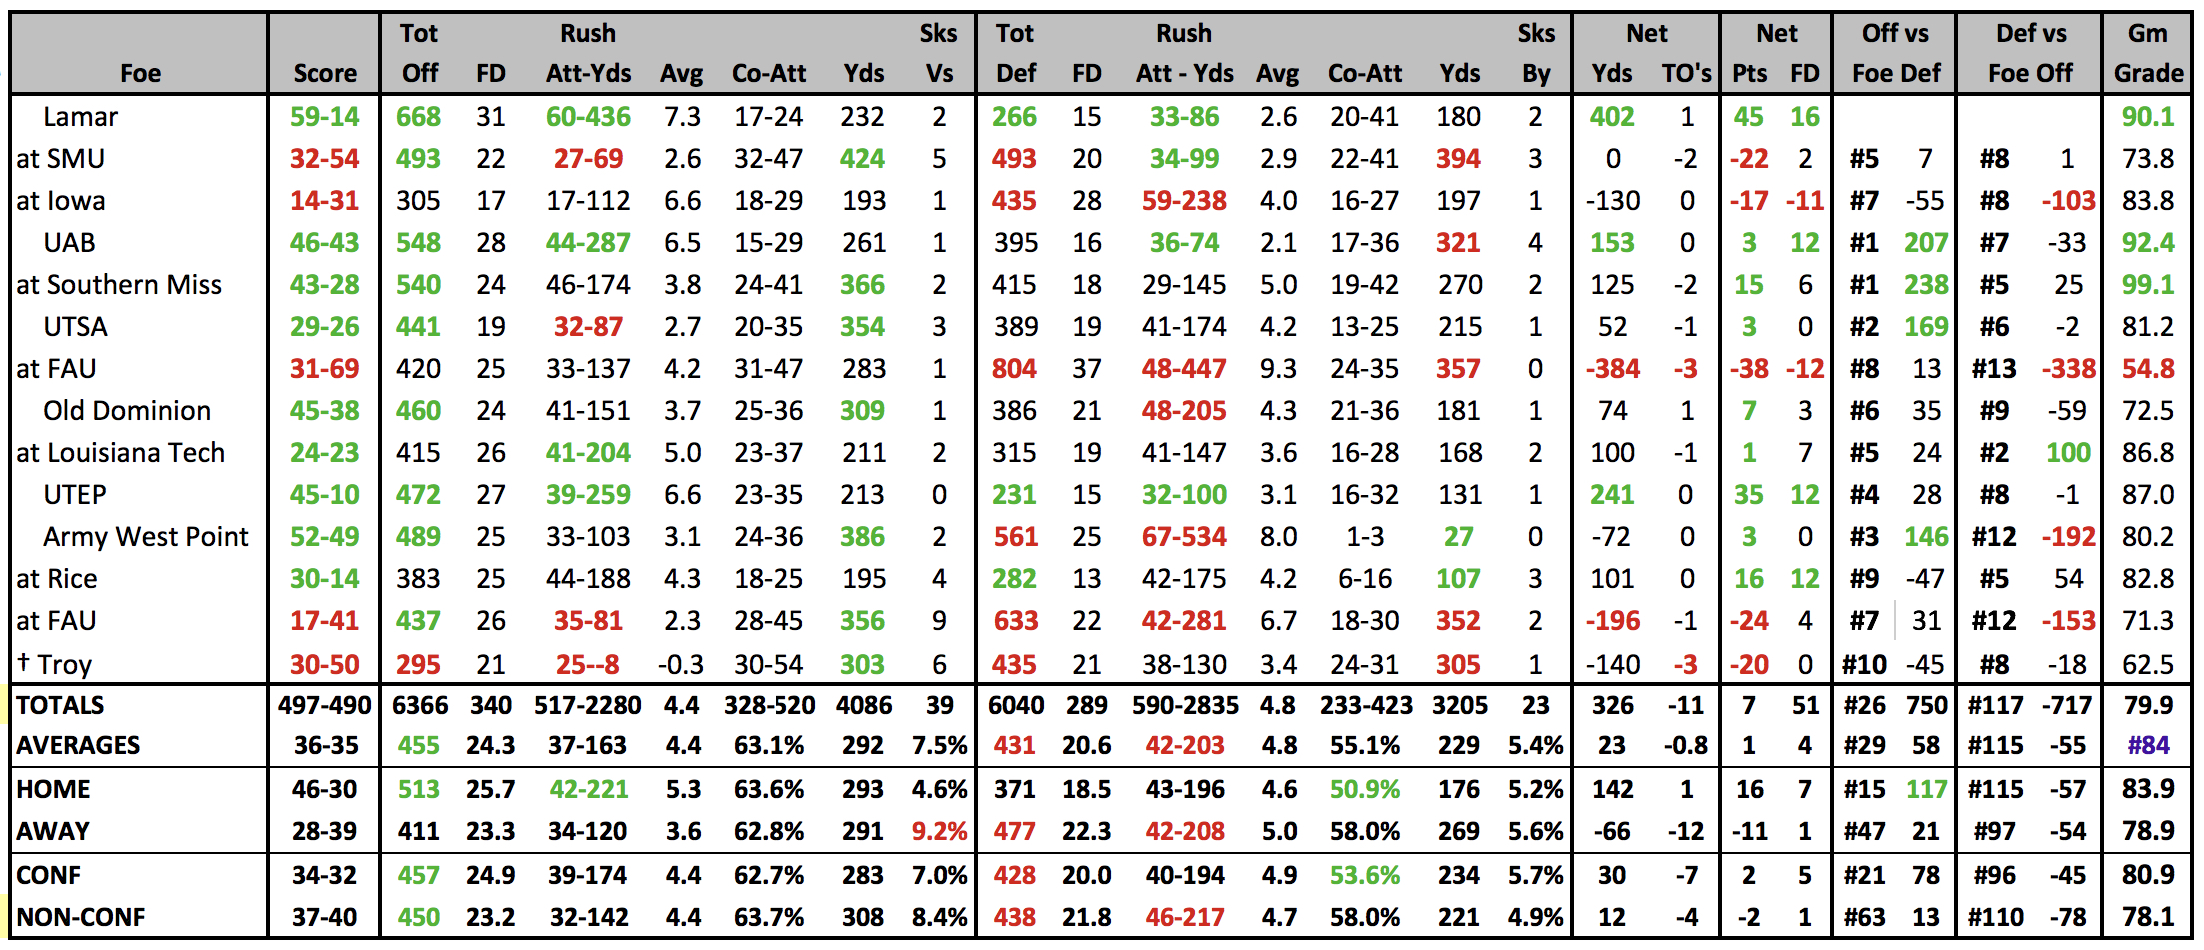
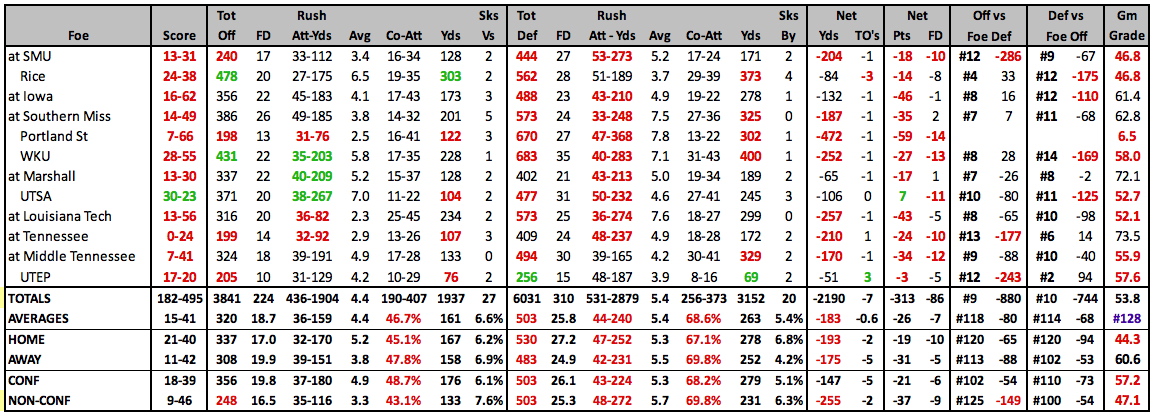
2025 GAME BY GAME STATS |
 |
2025 SCHEDULE |
2024 RESULTS |
||||||||||||||||||||||||||||||||||||||||||||||||||||||||||||||||||||||||||||||||||||||||||||||||||||||||||||||||||||||||||||||||||||||||||||||||||||||||||||||||||||||||||||||||||||||||||||||||||||||||||||||||||||||||||||||
|
|
||||||||||||||||||||||||||||||||||||||||||||||||||||||||||||||||||||||||||||||||||||||||||||||||||||||||||||||||||||||||||||||||||||||||||||||||||||||||||||||||||||||||||||||||||||||||||||||||||||||||||||||||||||||||||||||
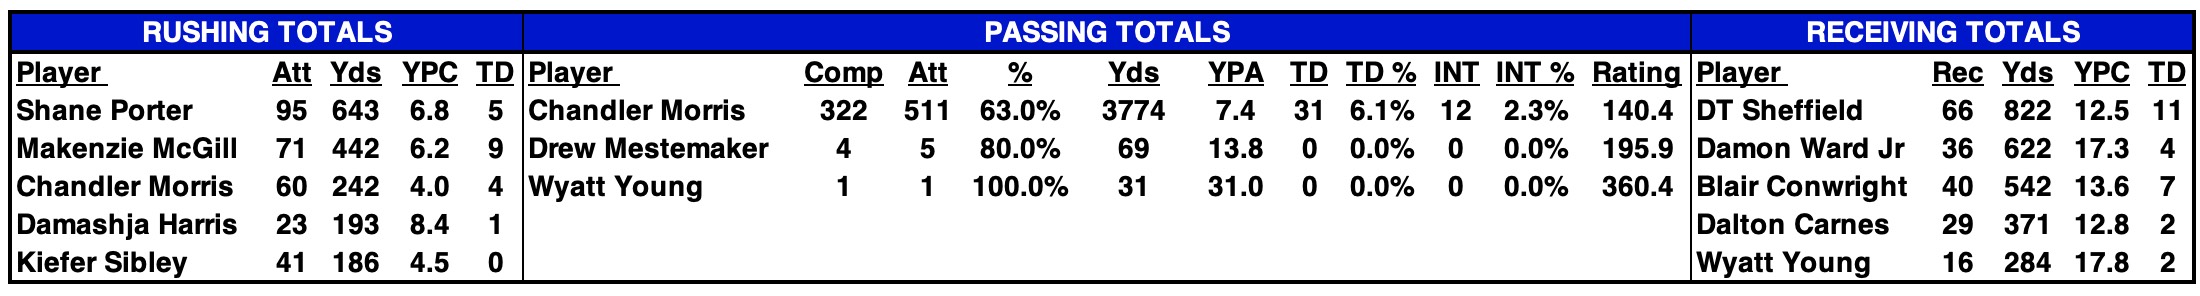
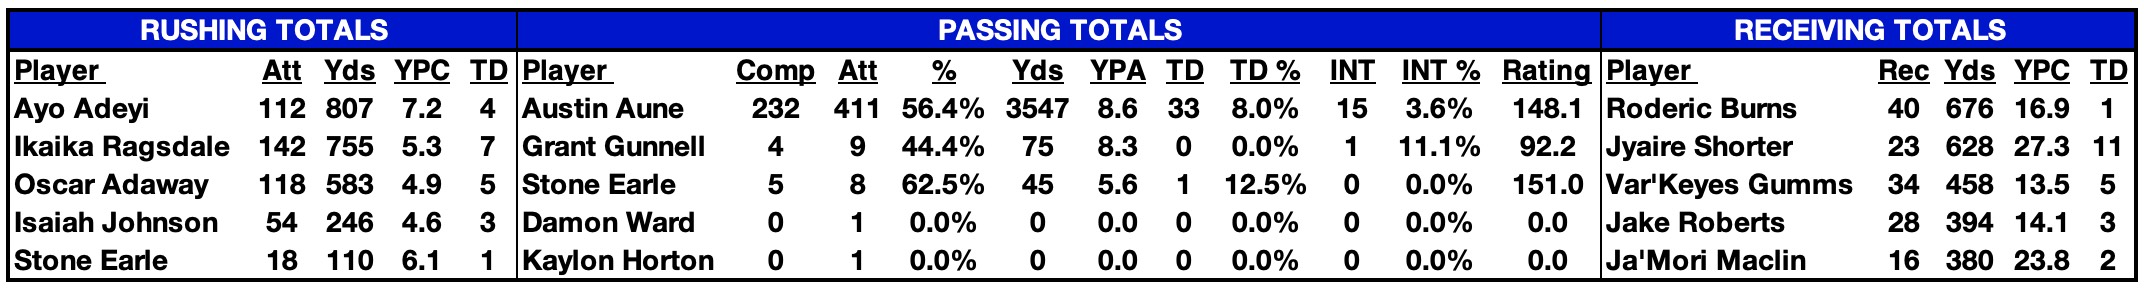
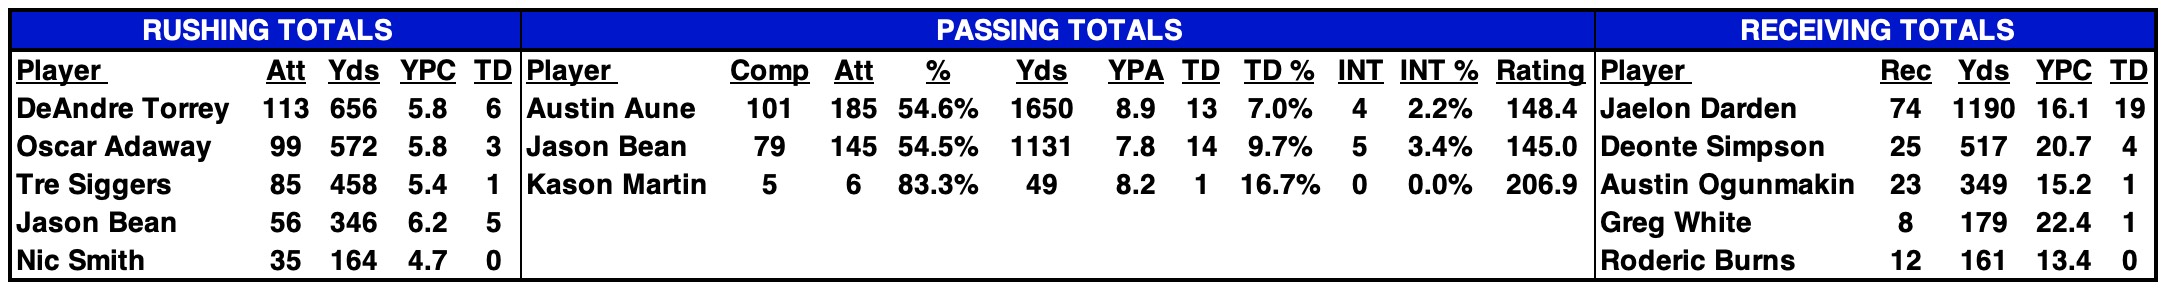
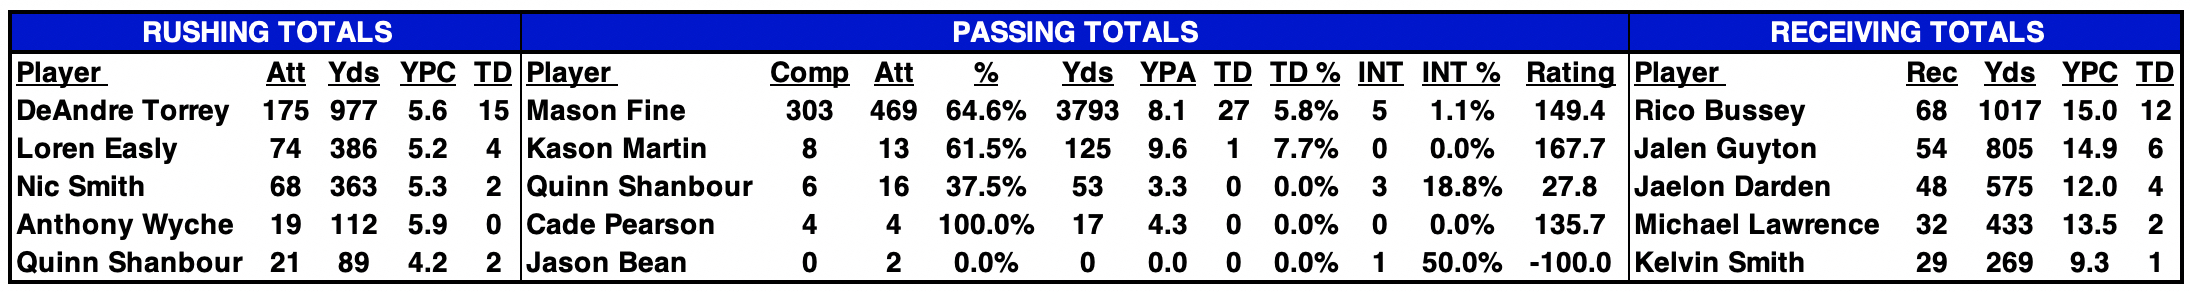
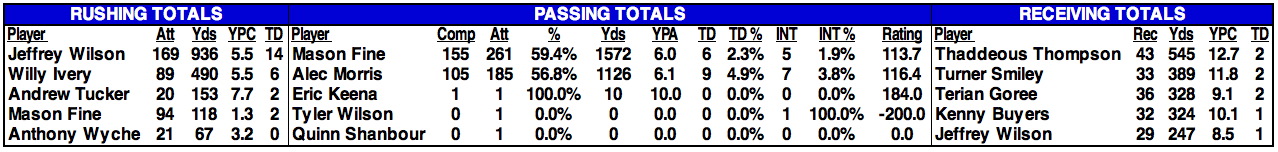
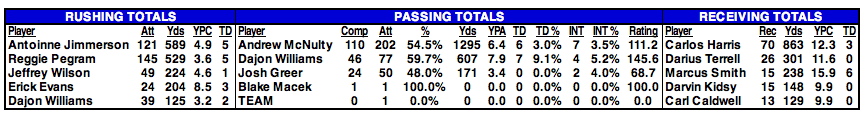
2024 STATISTICAL LEADERS |
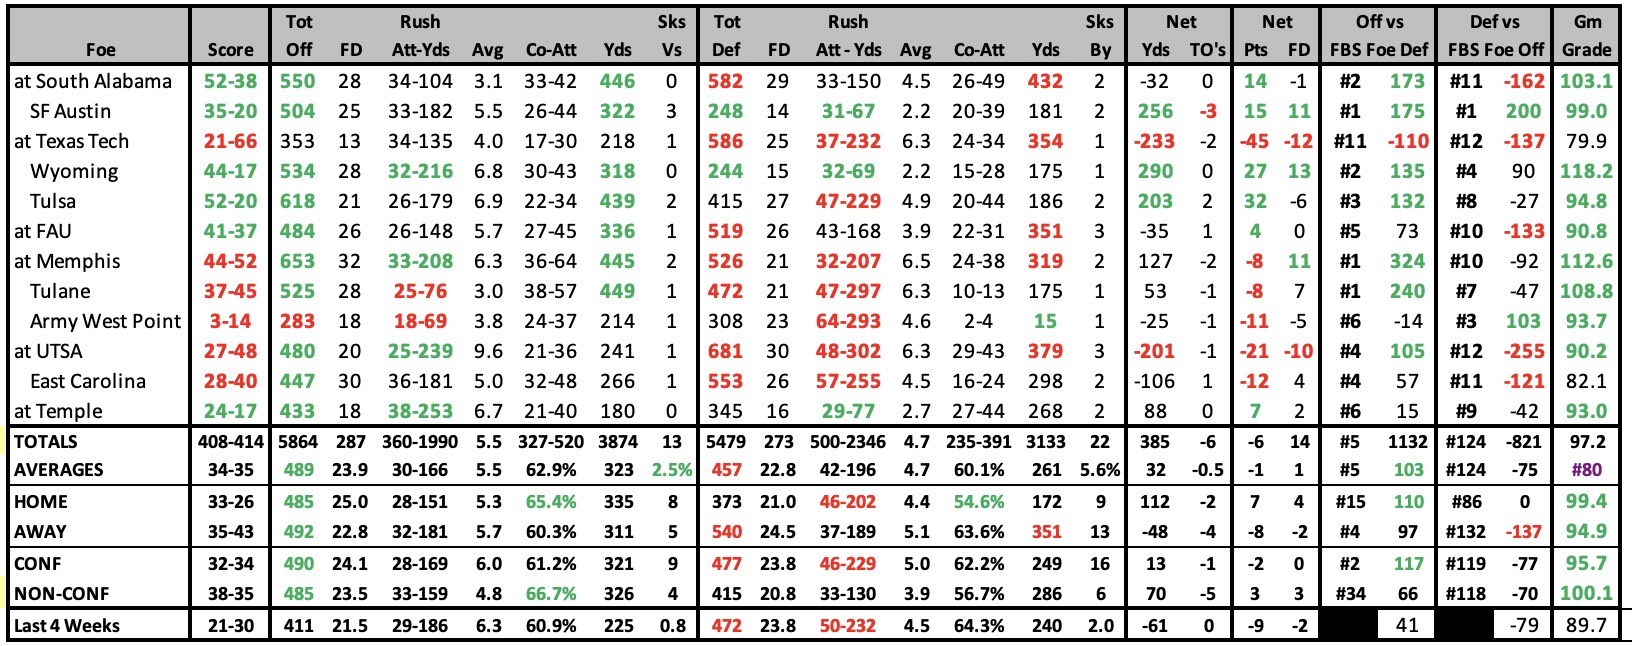
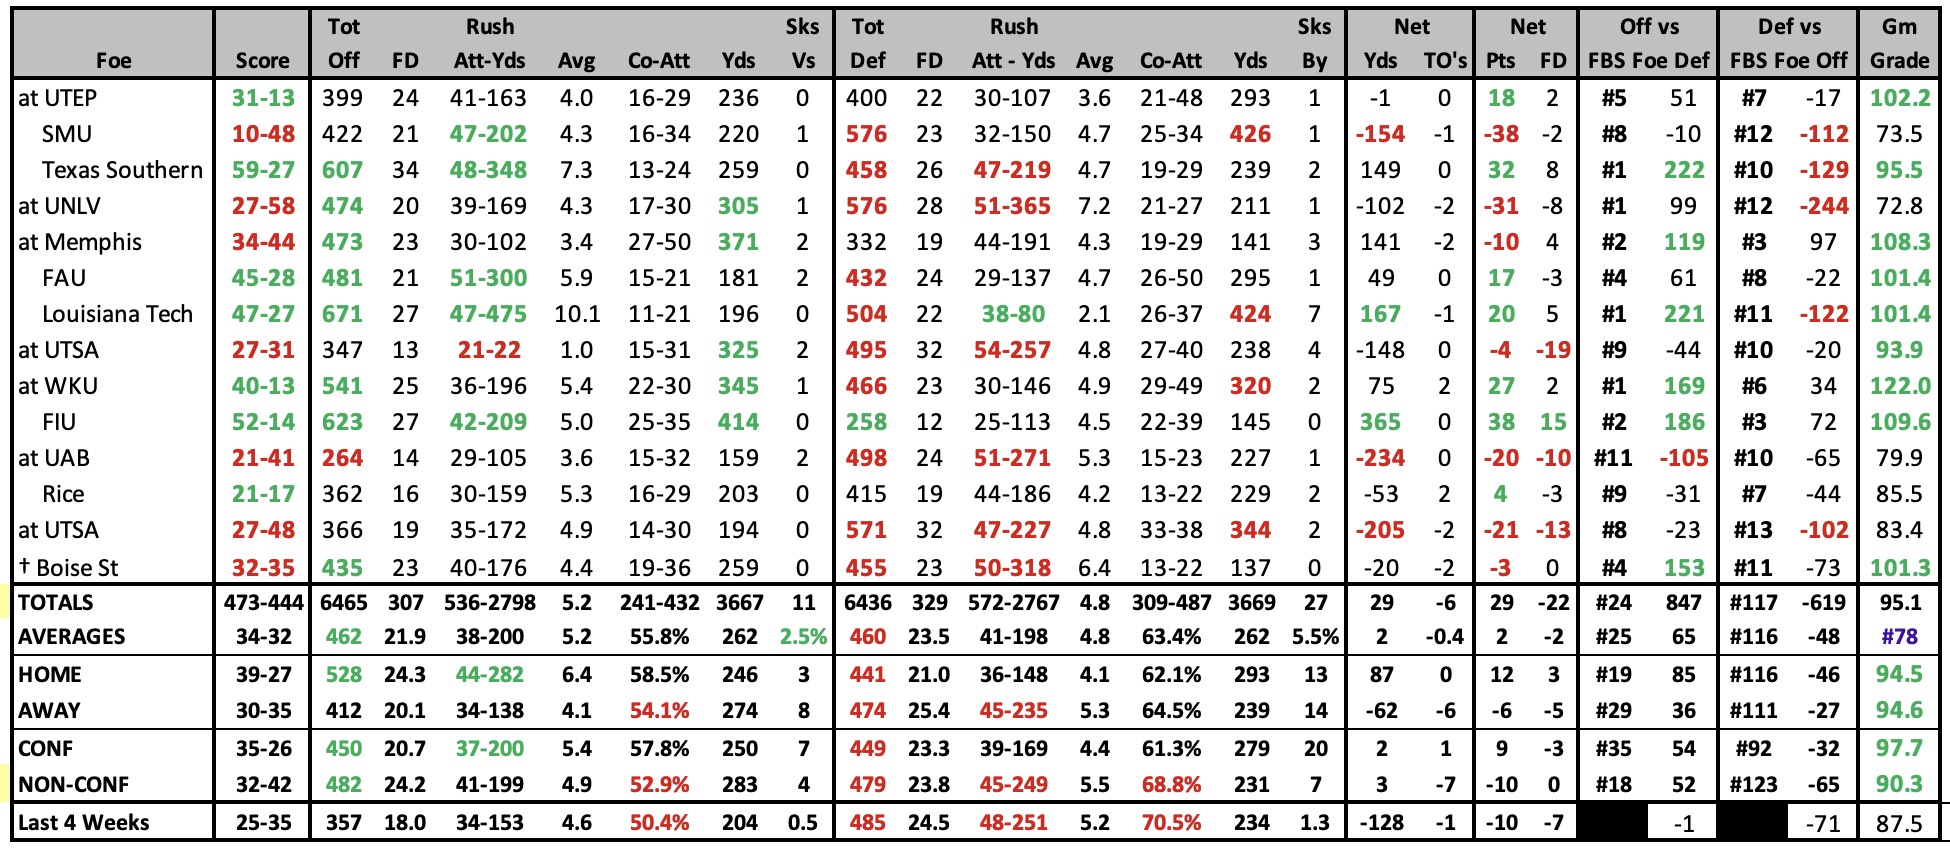
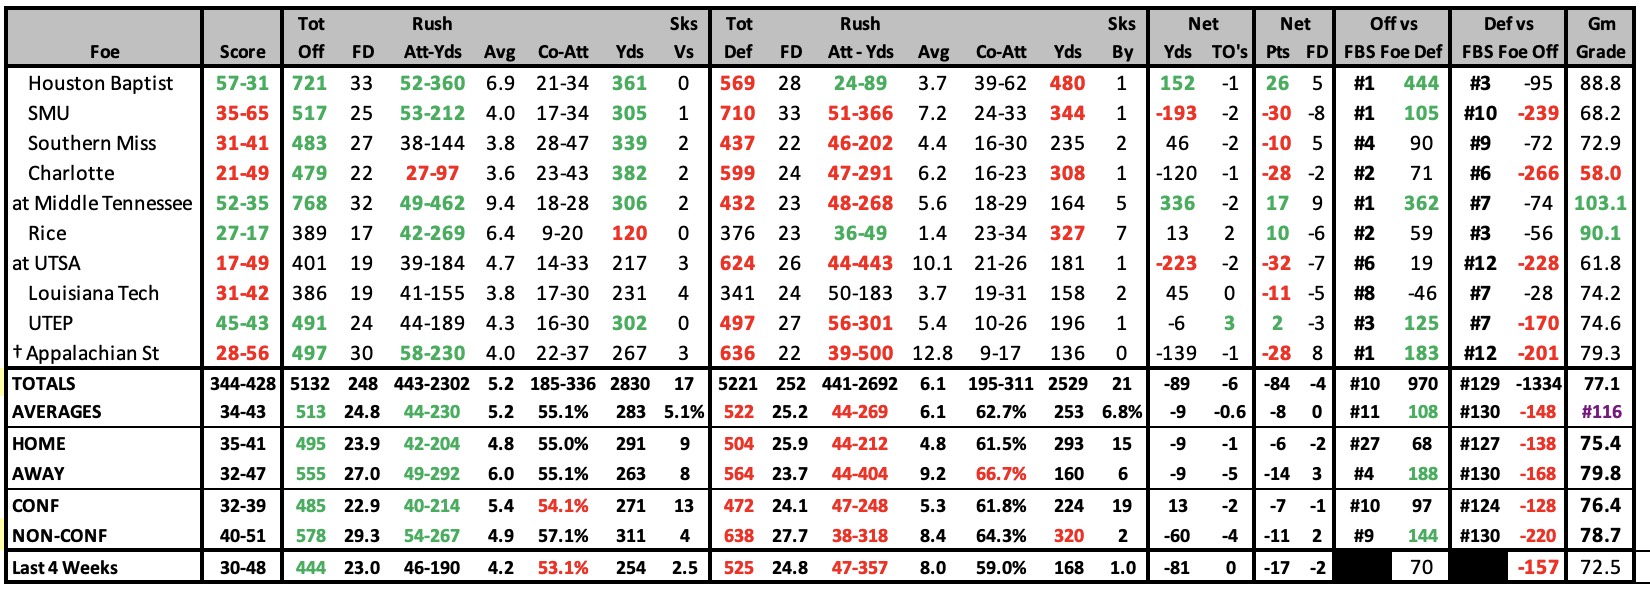
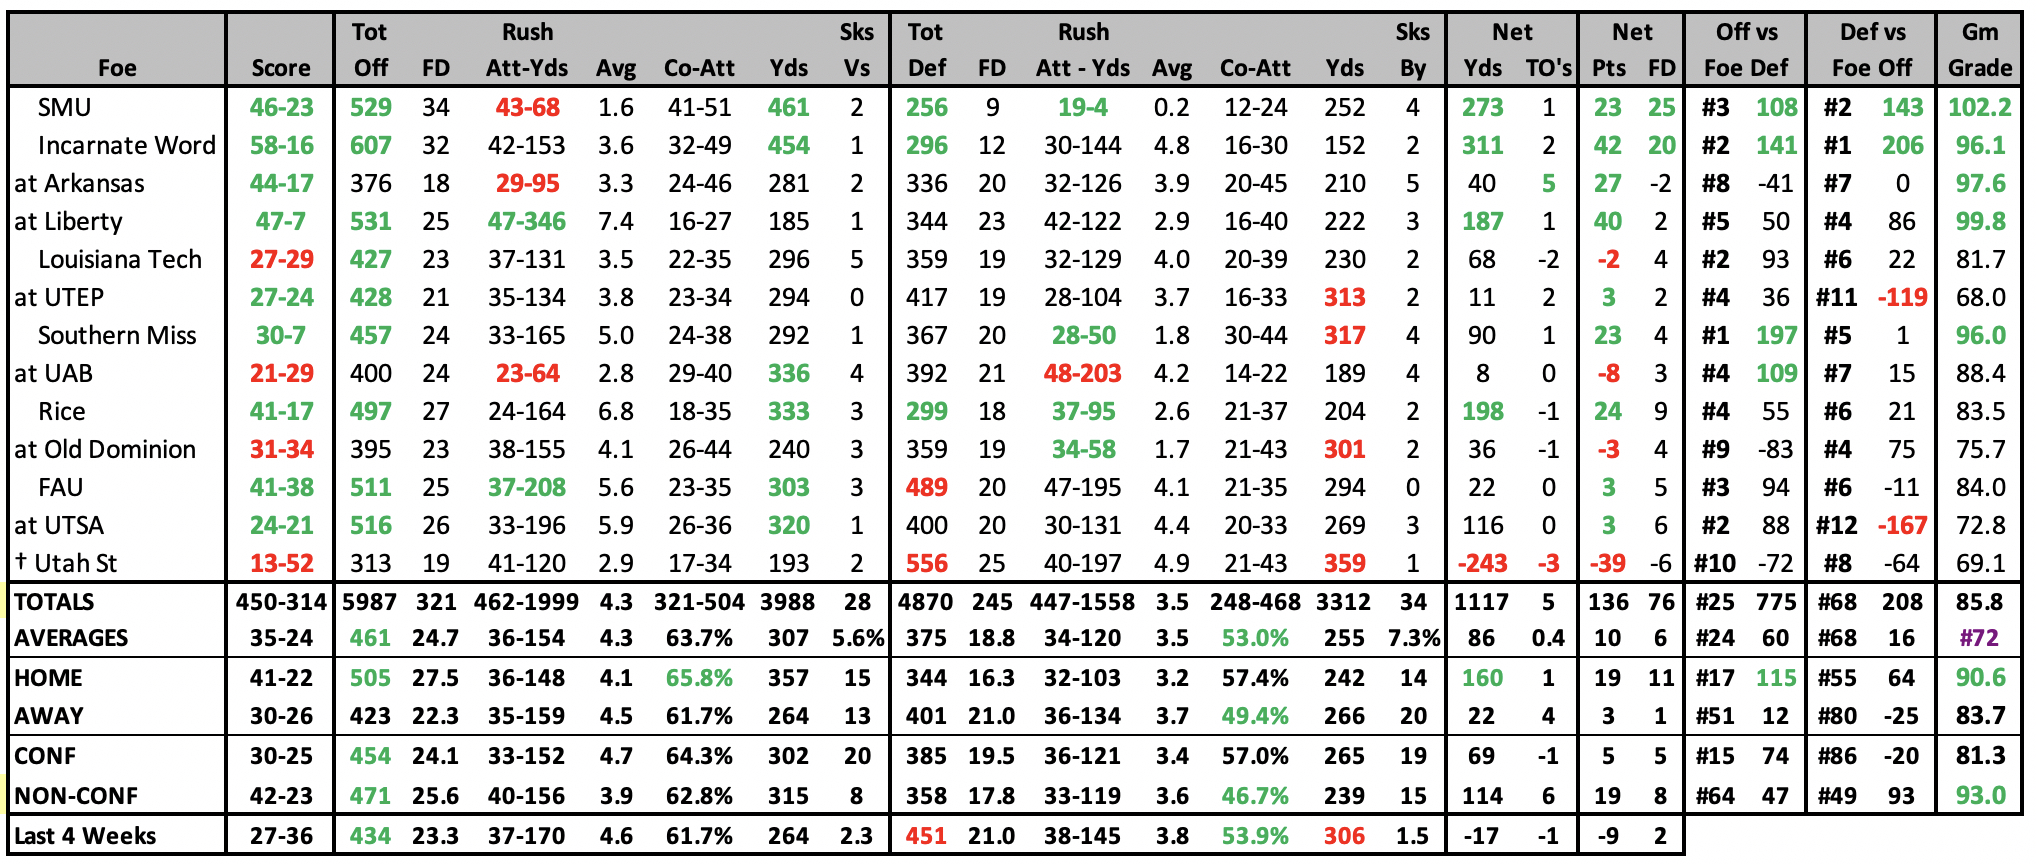
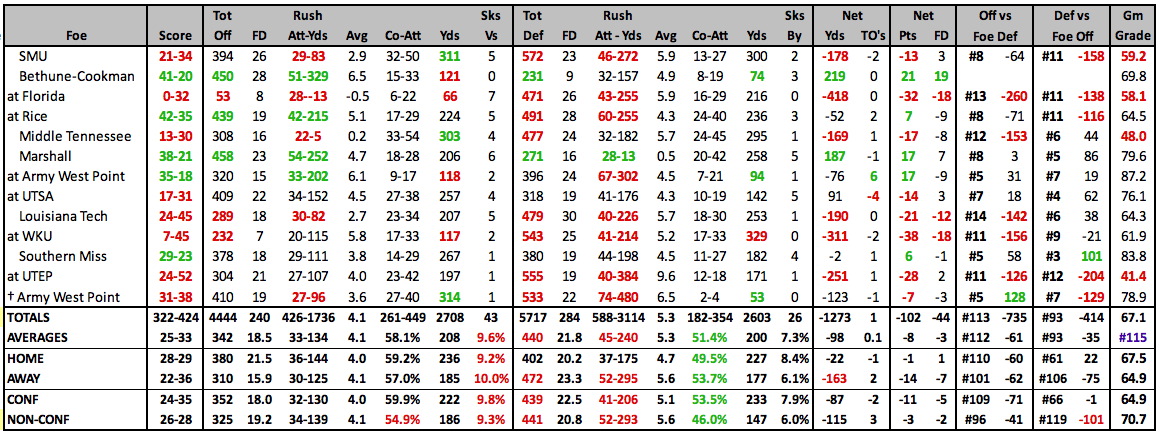
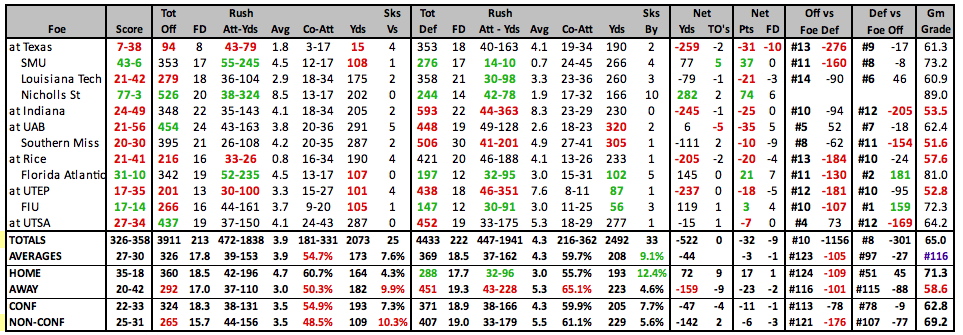
2024 GAME BY GAME STATS |
 |
2023 STATISTICAL LEADERS |
2023 GAME BY GAME STATS |
 |
2023 SCHEDULE |
2022 RESULTS |
||||||||||||||||||||||||||||||||||||||||||||||||||||||||||||||||||||||||||||||||||||||||||||||||||||||||||||||||||||||||||||||||||||||||||||||||||||||||||||||||||||||||||||||||||||||||||||||||||||||||||||||||||
|
|
||||||||||||||||||||||||||||||||||||||||||||||||||||||||||||||||||||||||||||||||||||||||||||||||||||||||||||||||||||||||||||||||||||||||||||||||||||||||||||||||||||||||||||||||||||||||||||||||||||||||||||||||||
2022 STATISTICAL LEADERS |
2022 GAME BY GAME STATS |
 |
2022 SCHEDULE |
2021 RESULTS |
||||||||||||||||||||||||||||||||||||||||||||||||||||||||||||||||||||||||||||||||||||||||||||||||||||||||||||||||||||||||||||||||||||||||||||||||||||||||||||||||||||||||||||||||||||||||||||||||||||||||||||||||||
|
|
||||||||||||||||||||||||||||||||||||||||||||||||||||||||||||||||||||||||||||||||||||||||||||||||||||||||||||||||||||||||||||||||||||||||||||||||||||||||||||||||||||||||||||||||||||||||||||||||||||||||||||||||||
2021 STATISTICAL LEADERS |
2021 GAME BY GAME STATS |
 |
2021 SCHEDULE |
2020 RESULTS |
||||||||||||||||||||||||||||||||||||||||||||||||||||||||||||||||||||||||||||||||||||||||||||||||||||||||||||||||||||||||||||||||||||||||||||||||||||||||||||||||||||||||||||||||||||||||||||||||||||||||||||
|
|
||||||||||||||||||||||||||||||||||||||||||||||||||||||||||||||||||||||||||||||||||||||||||||||||||||||||||||||||||||||||||||||||||||||||||||||||||||||||||||||||||||||||||||||||||||||||||||||||||||||||||||
2020 STATISTICAL LEADERS |
2020 GAME BY GAME STATS |
 |
2020 SCHEDULE |
2019 RESULTS |
||||||||||||||||||||||||||||||||||||||||||||||||||||||||||||||||||||||||||||||||||||||||||||||||||||||||||||||||||||||||||||||||||||||||||||||||||||||||||||||||||||||||||||||||||||||||||||||||||||||||||||
|
|
||||||||||||||||||||||||||||||||||||||||||||||||||||||||||||||||||||||||||||||||||||||||||||||||||||||||||||||||||||||||||||||||||||||||||||||||||||||||||||||||||||||||||||||||||||||||||||||||||||||||||||
2019 STATISTICAL LEADERS |
2019 GAME BY GAME STATS |
 |
2019 SCHEDULE |
2018 RESULTS |
||||||||||||||||||||||||||||||||||||||||||||||||||||||||||||||||||||||||||||||||||||||||||||||||||||||||||||||||||||||||||||||||||||||||||||||||||||||||||||||||||||||||||||||||||||||||||||||||||||||||||||||||
|
|
||||||||||||||||||||||||||||||||||||||||||||||||||||||||||||||||||||||||||||||||||||||||||||||||||||||||||||||||||||||||||||||||||||||||||||||||||||||||||||||||||||||||||||||||||||||||||||||||||||||||||||||||
2018 STATISTICAL LEADERS |
2018 GAME BY GAME STATS |
 |
2018 SCHEDULE |
2017 RESULTS |
||||||||||||||||||||||||||||||||||||||||||||||||||||||||||||||||||||||||||||||||||||||||||||||||||||||||||||||||||||||||||||||||||||||||||||||||||||||||||||||||||||||||||||||||||||||||||||||||||||||||||||||||||||||||||||||||||||||||||||||
|
|
||||||||||||||||||||||||||||||||||||||||||||||||||||||||||||||||||||||||||||||||||||||||||||||||||||||||||||||||||||||||||||||||||||||||||||||||||||||||||||||||||||||||||||||||||||||||||||||||||||||||||||||||||||||||||||||||||||||||||||||
2017 STATISTICAL LEADERS |
2017 GAME BY GAME STATS |
 |
2017 SCHEDULE |
2016 RESULTS |
|||||||||||||||||||||||||||||||||||||||||||||||||||||||||||||||||||||||||||||||||||||||||||||||||||||||||||||||||||||||||||||||||||||||||||||||||||||||||||||||||||||||||||||||||||||||||||||||||||||||||||||||||||||||||||||||||||||||||||||||||||||
|
|
|||||||||||||||||||||||||||||||||||||||||||||||||||||||||||||||||||||||||||||||||||||||||||||||||||||||||||||||||||||||||||||||||||||||||||||||||||||||||||||||||||||||||||||||||||||||||||||||||||||||||||||||||||||||||||||||||||||||||||||||||||||
2016 STATISTICAL LEADERS |
2016 GAME BY GAME STATS |
 |
2015 STATISTICAL LEADERS |
2015 GAME BY GAME STATS |
 |
2015 SCHEDULE |
2014 RESULTS |
||||||||||||||||||||||||||||||||||||||||||||||||||||||||||||||||||||||||||||||||||||||||||||||||||||||||||||||||||||||||||||||||||||||||||||||||||||||||||||||||||||||||||||||||||||||||||||||||||||||||||||||||||||||||||||||||||||||||||||||
|
|
||||||||||||||||||||||||||||||||||||||||||||||||||||||||||||||||||||||||||||||||||||||||||||||||||||||||||||||||||||||||||||||||||||||||||||||||||||||||||||||||||||||||||||||||||||||||||||||||||||||||||||||||||||||||||||||||||||||||||||||
2014 STATISTICAL LEADERS |
2014 GAME BY GAME STATS |
 |
2013 STATISTICAL LEADERS |
| Player | Att | Yds | YPC | TD | Player | Comp | Att | % | Yds | YPA | TD | INT | Rating | Player | Rec | Yds | YPC | TD |
| Brandin Byrd | 182 | 1023 | 5.6 | 11 | Derek Thompson | 230 | 360 | 63.9% | 2640 | 7.3 | 14 | 13 | 131.1 | Brelan Chancellor | 47 | 718 | 15.3 | 4 |
| Antoinne Jimmerson | 99 | 432 | 4.4 | 6 | Dajon Williams | 5 | 6 | 83.3% | 55 | 9.2 | 0 | 0 | 160.3 | Darnell Smith | 65 | 716 | 11.0 | 3 |
| Reggie Pegram | 94 | 338 | 3.6 | 6 | Andrew McNulty | 5 | 6 | 83.3% | 36 | 6.0 | 0 | 1 | 100.4 | Carlos Harris | 44 | 519 | 11.8 | 2 |
2013 GAME BY GAME STATS |
 |
2013 RESULTS |
2012 RESULTS |
|||||||||||||||||||||||||||||||||||||||||||||||||||||||||||||||||||||||||||||||||||||||||||||||||||||||||||||||||||||||||||||||||||||||||||||||||||||||||||||||||||||||||||||||||||||||||||||||||||||||||||||||||||||||||||||||||||||||||||||||||||||||||||||||||||||||||||||||||||||
|
|
|||||||||||||||||||||||||||||||||||||||||||||||||||||||||||||||||||||||||||||||||||||||||||||||||||||||||||||||||||||||||||||||||||||||||||||||||||||||||||||||||||||||||||||||||||||||||||||||||||||||||||||||||||||||||||||||||||||||||||||||||||||||||||||||||||||||||||||||||||||
2012 STATISTICAL LEADERS |
| Player | Att | Yds | YPC | TD | Player | Comp | Att | % | Yds | YPA | TD | INT | Rating | Player | Rec | Yds | YPC | TD | ||
| Brandin Byrd | 205 | 860 | 4.2 | 4 | Derek Thompson | 213 | 369 | 57.7% | 2633 | 7.1 | 14 | 14 | 122.6 | Ivan Delgado | 42 | 570 | 13.6 | 0 | ||
| Antoinne Jimmerson | 108 | 544 | 5.0 | 5 | Team | 1 | 3 | 33.3% | 1 | 0.3 | 0 | 0 | 36.1 | Brelan Chancellor | 25 | 450 | 18.0 | 5 | ||
| Jeremy Brown | 96 | 500 | 5.2 | 4 | Derrick Teegarden | 0 | 1 | 0.0% | 0 | 0.0 | 0 | 0 | 0.0 | Darnell Smith | 28 | 379 | 13.5 | 2 |
| 2012 Individual Player Stats • 2012 Start Chart/Starters Lost |
|---|
2012 GAME BY GAME STATS |
 |
2011 STATISTICAL LEADERS |
| Player | Att | Yds | YPC | TD | Player | Comp | Att | % | Yds | YPA | TD | INT | Rating | Player | Rec | Yds | YPC | TD | ||
| Lance Dunbar | 269 | 1115 | 4.1 | 10 | Derek Thompson | 157 | 272 | 57.7% | 1759 | 6.5 | 11 | 6 | 121.0 | Brelan Chancellor | 37 | 457 | 12.4 | 3 | ||
| James Hamilton | 92 | 406 | 4.4 | 4 | Andrew McNulty | 28 | 51 | 54.9% | 352 | 6.9 | 1 | 3 | 107.6 | Chris Bynes | 37 | 442 | 11.9 | 5 | ||
| Derek Thompson | 50 | 113 | 2.3 | 3 | Brent Osborn | 13 | 21 | 61.9% | 127 | 6.0 | 2 | 0 | 144.1 | Lance Dunbar | 29 | 350 | 12.1 | 2 |
| 2011 Individual Player Stats • 2011 START CHART/STARTERS LOST |
|---|
2011 GAME BY GAME STATS |
2011 RESULTS |
2010 RESULTS |
|||||||||||||||||||||||||||||||||||||||||||||||||||||||||||||||||||||||||||||||||||||||||||||||||||||||||||||||||||||||||||||||||||||||||||||||||||||||||||||||||||||||||||||||||||||||||||||
|
|
|||||||||||||||||||||||||||||||||||||||||||||||||||||||||||||||||||||||||||||||||||||||||||||||||||||||||||||||||||||||||||||||||||||||||||||||||||||||||||||||||||||||||||||||||||||||||||||
2010 STATISTICAL LEADERS |
| Player | Att | Yds | YPC | TD | Player | Comp | Att | % | Yds | YPA | TD | INT | Rating | Player | Rec | Yds | YPC | TD | ||
| Lance Dunbar | 274 | 1552 | 5.66 | 14 | Riley Dodge | 106 | 176 | 60.2% | 1212 | 6.9 | 11 | 4 | 134.2 | Darius Carey | 38 | 524 | 13.8 | 5 | ||
| Riley Dodge | 79 | 253 | 3.20 | 1 | Nathan Tune | 39 | 66 | 59.1% | 525 | 8.0 | 4 | 3 | 136.8 | Jamaal Jackson | 33 | 446 | 13.5 | 4 | ||
| James Hamilton | 26 | 209 | 8.04 | 1 | Chase Baine | 26 | 53 | 49.1% | 257 | 4.8 | 1 | 1 | 92.2 | Lance Dunbar | 28 | 332 | 11.9 | 3 |
| 2010 Individual Player Stats |
|---|
2010 GAME BY GAME STATS |
2009 STATISTICAL LEADERS |
| Player | Att | Yds | YPC | TD | Player | Comp | Att | % | Yds | YPA | TD | INT | Rating | Player | Rec | Yds | YPC | TD | ||
| Lance Dunbar | 200 | 1378 | 6.89 | 17 | Riley Dodge | 205 | 303 | 67.7% | 1975 | 6.5 | 9 | 15 | 122.3 | Jamaal Jackson | 71 | 701 | 9.9 | 6 | ||
| Riley Dodge | 104 | 463 | 4.45 | 5 | Nathan Tune | 69 | 107 | 64.5% | 646 | 6.0 | 5 | 2 | 126.9 | Darius Carey | 57 | 509 | 8.9 | 4 | ||
| Cam Montgomery | 66 | 265 | 4.02 | 2 | Derek Thompson | 3 | 3 | 100.0% | 60 | 20.0 | 1 | 0 | 378.0 | Michael Outlaw | 41 | 473 | 11.5 | 2 |
| 2009 Individual Player Stats |
|---|
2009 GAME BY GAME STATS |
2009 RESULTS |
2008 RESULTS |
|||||||||||||||||||||||||||||||||||||||||||||||||||||||||||||||||||||||||||||||||||||||||||||||||||||||||||||||||||||||||||||||||||||||||||||||||||||||||||||||
|
|
|||||||||||||||||||||||||||||||||||||||||||||||||||||||||||||||||||||||||||||||||||||||||||||||||||||||||||||||||||||||||||||||||||||||||||||||||||||||||||||||
| 2008 Individual Player Stats • 2007 Individual Player Stats |
|---|