
| RICE OWLS |
|---|
|
STADIUM: Rice Stadium PLAYING SURFACE: FieldTurf • CAPACITY: 47,000 STARTERS RETURNING (O/D): 3/4 LETTERMAN RETURNING: 36 (15,17,4) • LETTERMAN LOST: 31 (13,16,2) |
 |
|
| CONF: CUSA (West) | |
| LOCATION: Houston, TX | |
| FOUNDED: 1891 | |
| ENROLLMENT: 3,992 | |
| COLORS: Blue & Grey | |
| MASCOT: Sammy the Owl | |
| CONF: AAC | |
| HEAD COACH: Scott Abell | |
| YEARS WITH TM: 1st | |
| OVERALL RECORD: 0-0 | |
| RECORD WITH TM: 0-0 |
|
|---|
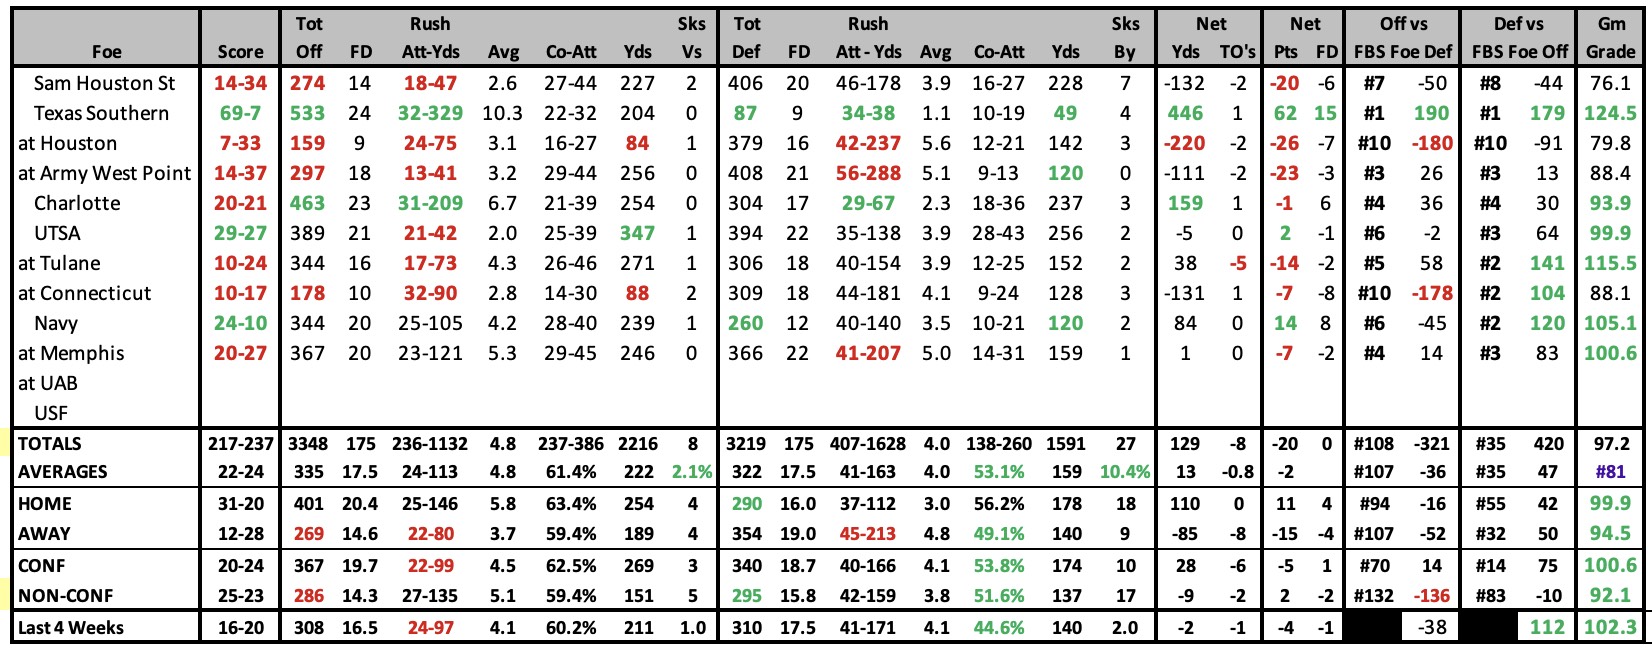
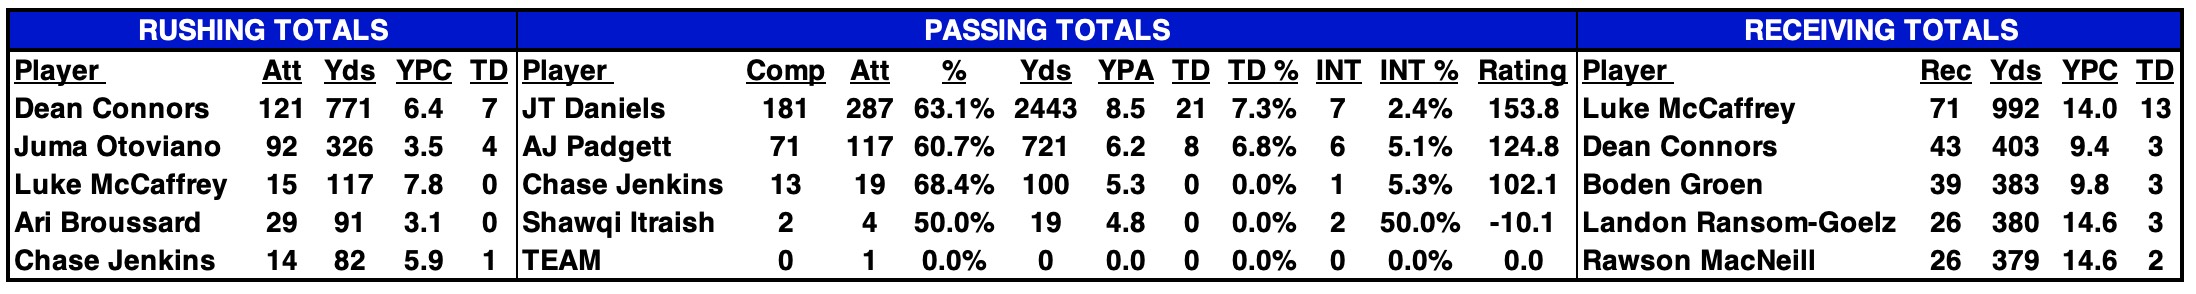
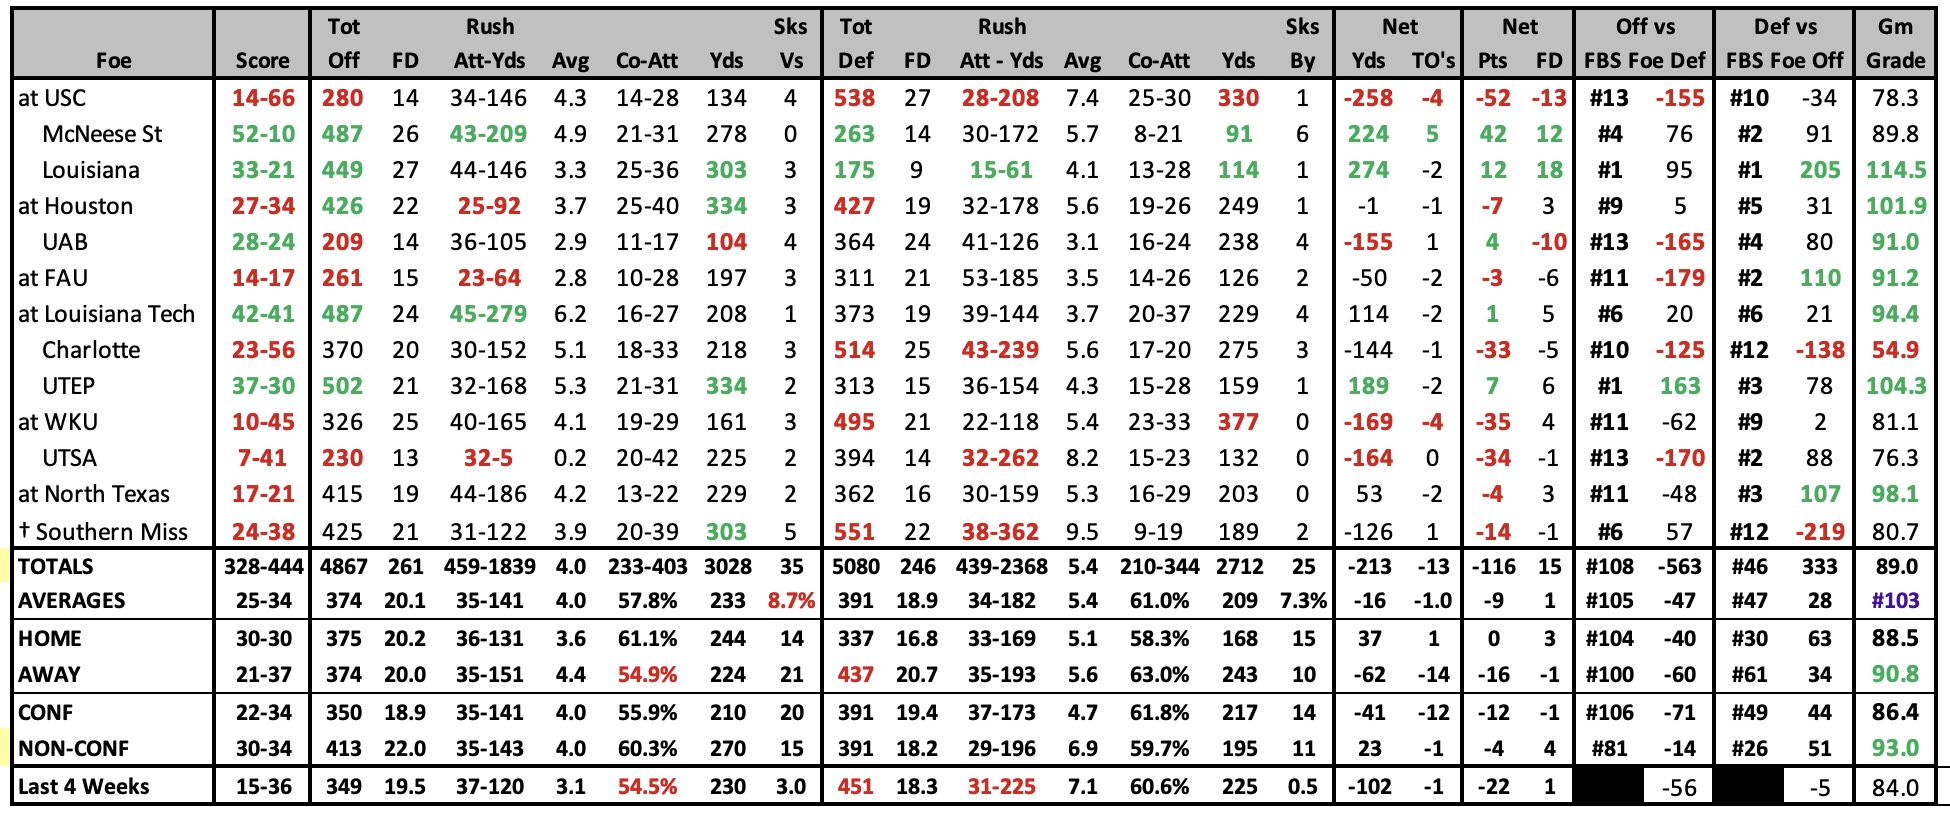
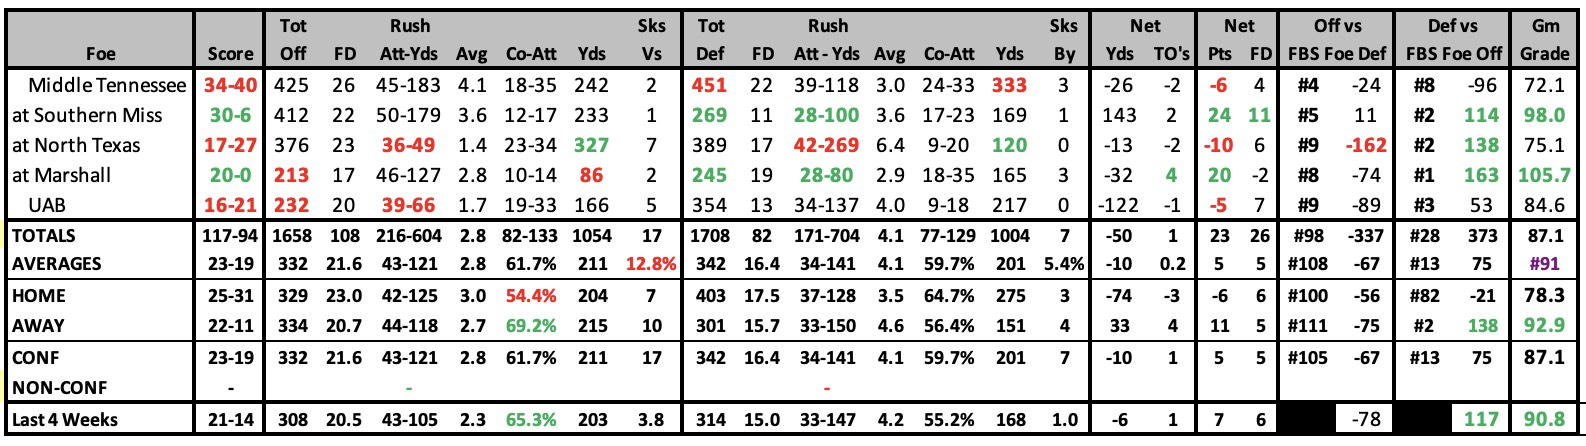
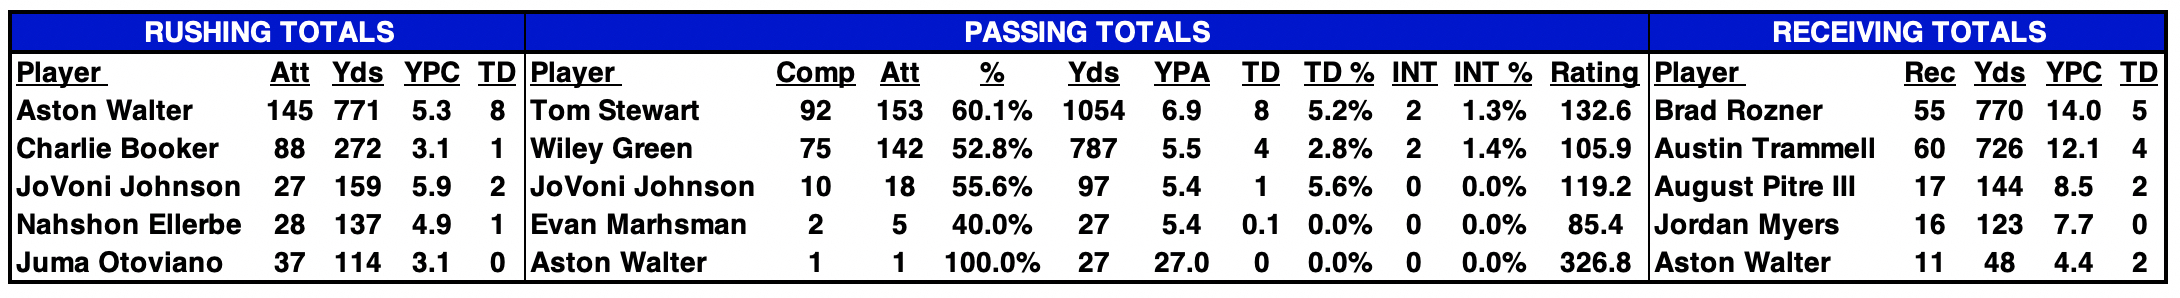
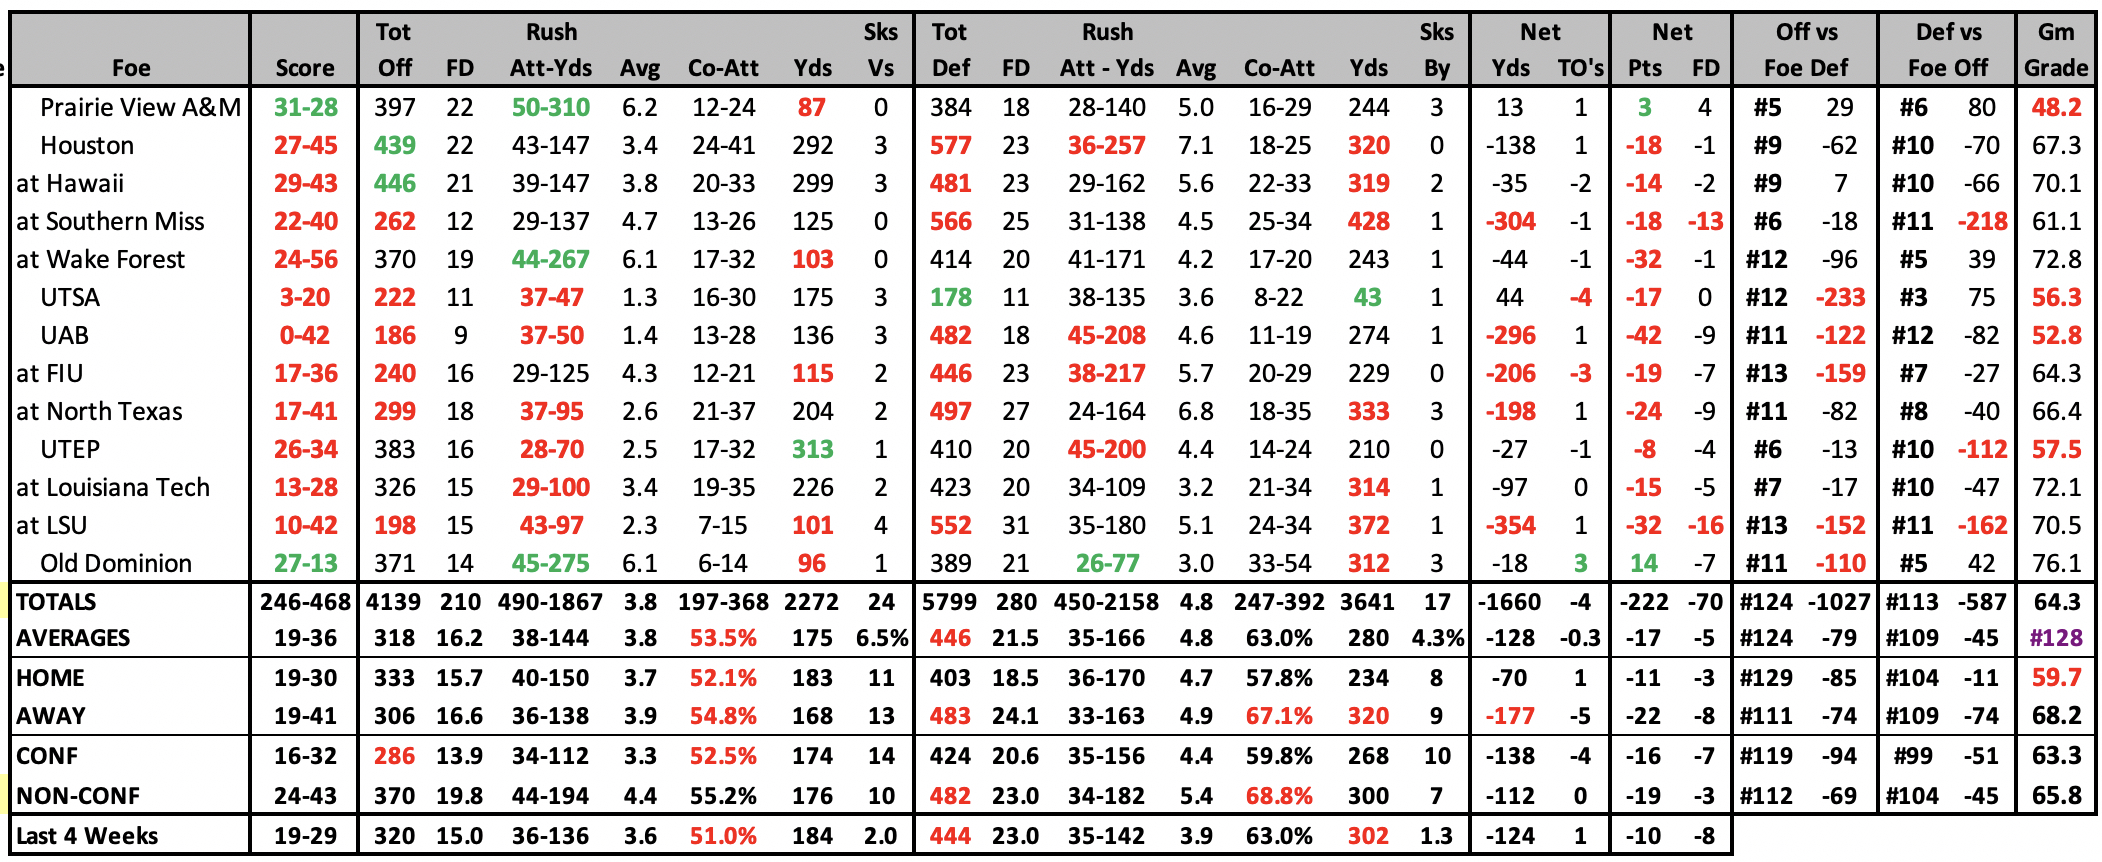
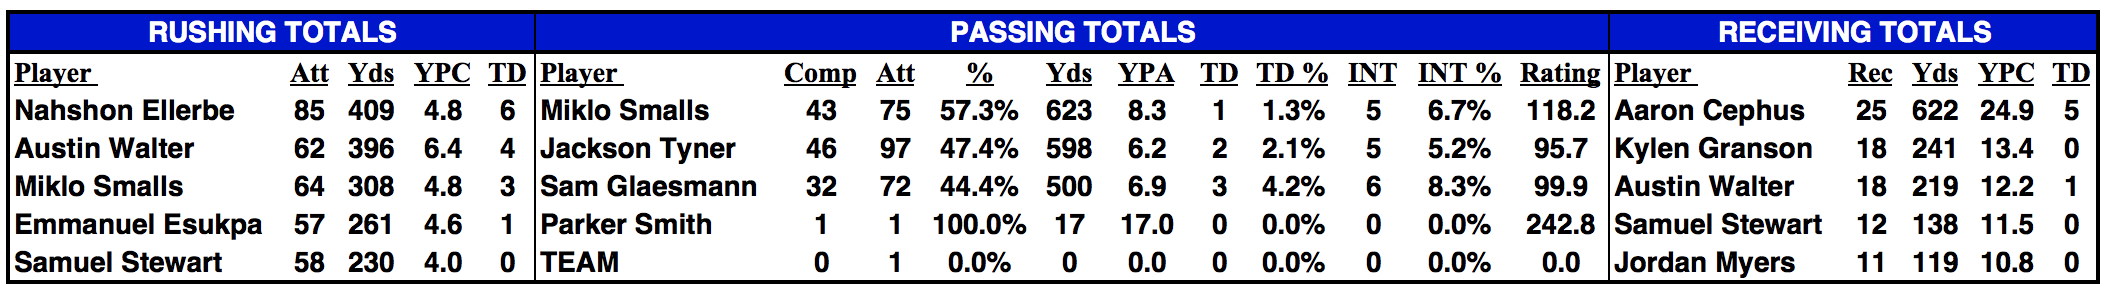
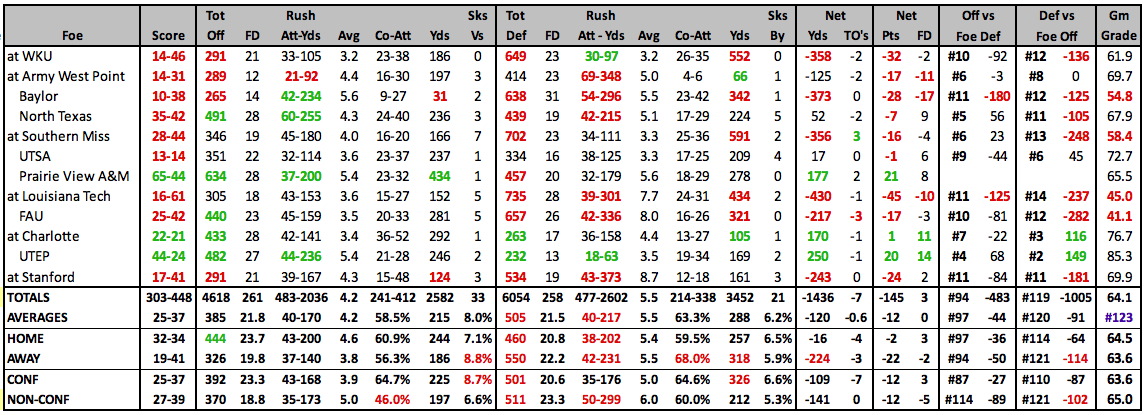
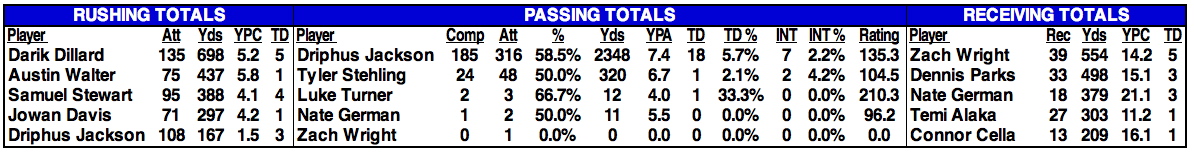
| 2025 GAME BY GAME STATS |
|---|
 |
2025 SCHEDULE |
2024 RESULTS |
||||||||||||||||||||||||||||||||||||||||||||||||||||||||||||||||||||||||||||||||||||||||||||||||||||||||||||||||||||||||||||||||||||||||||||||||||||||||||||||||||||||||||||||||||||||||||||||||||||||
|
|
||||||||||||||||||||||||||||||||||||||||||||||||||||||||||||||||||||||||||||||||||||||||||||||||||||||||||||||||||||||||||||||||||||||||||||||||||||||||||||||||||||||||||||||||||||||||||||||||||||||
|
|---|
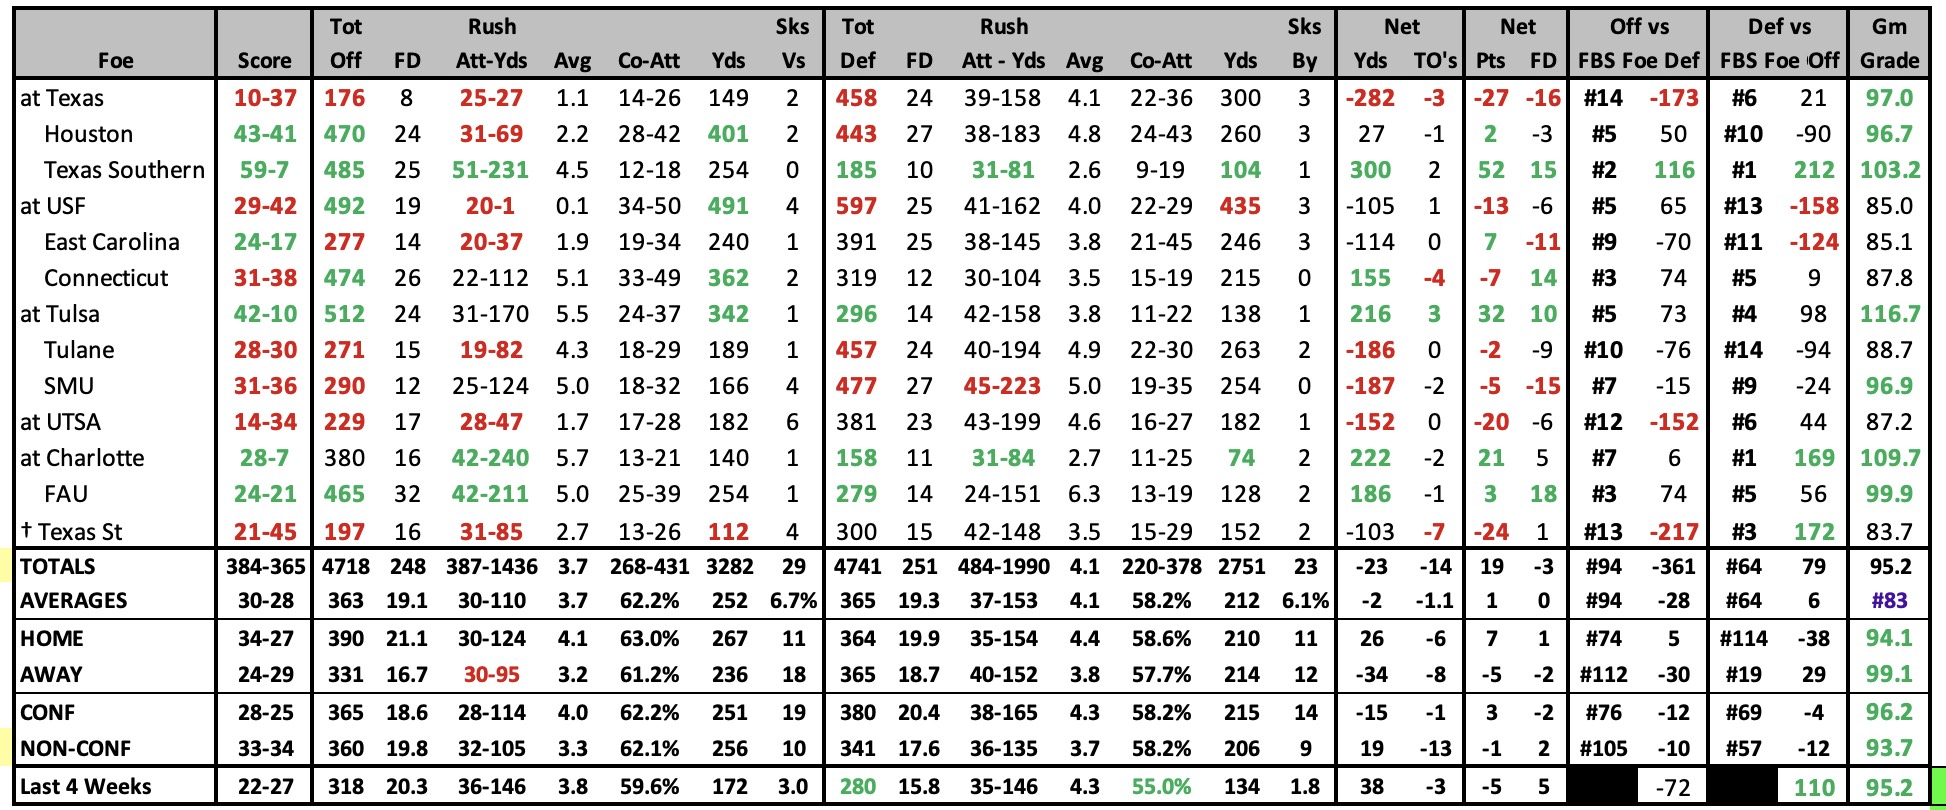
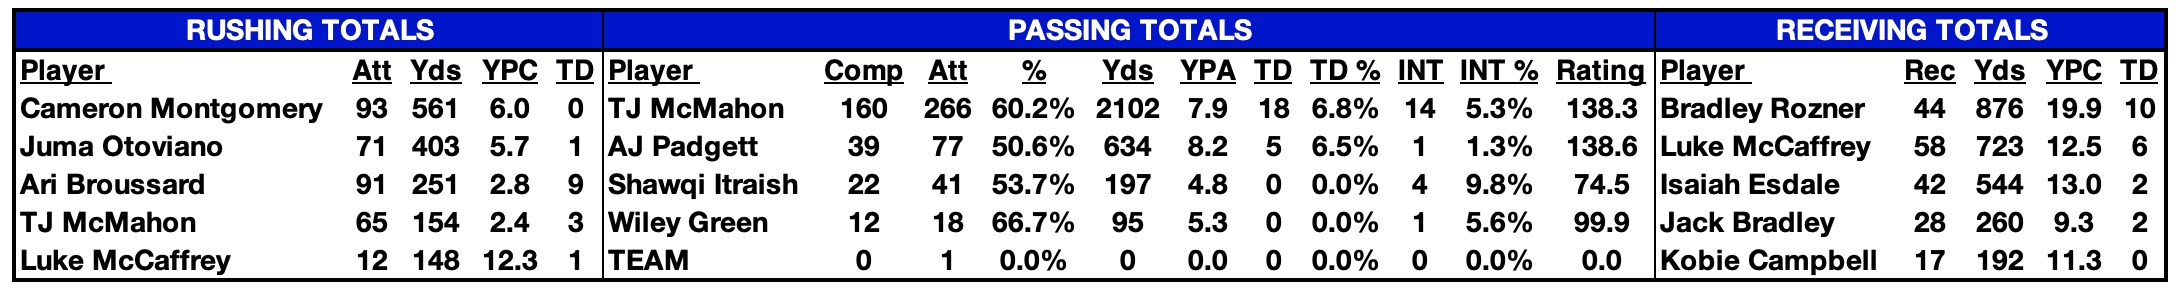
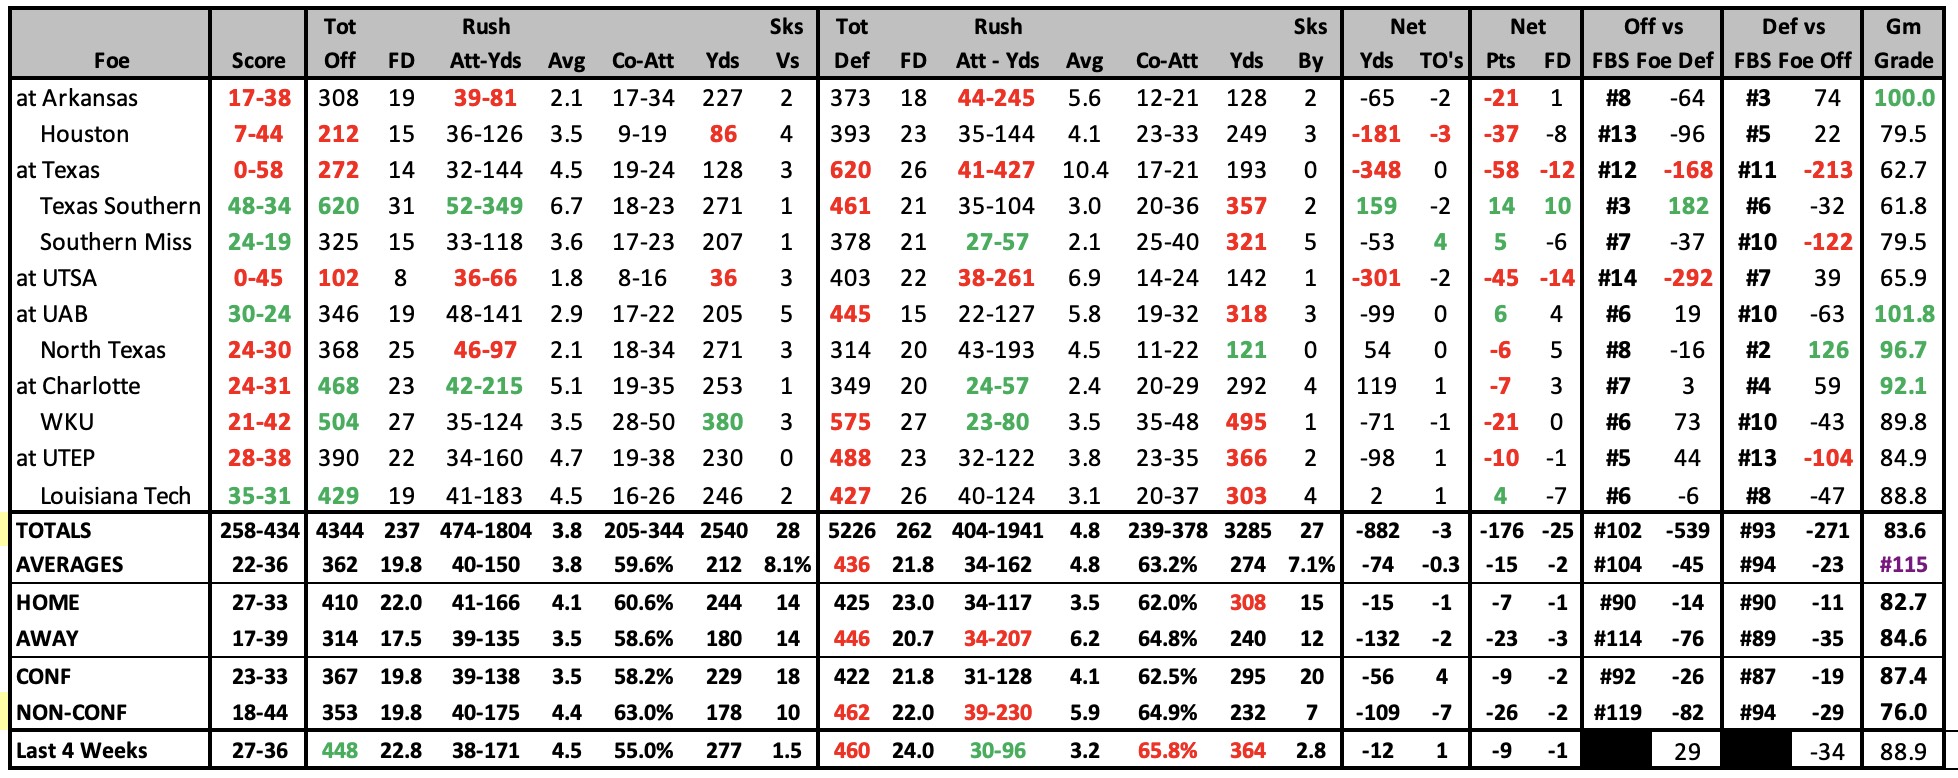
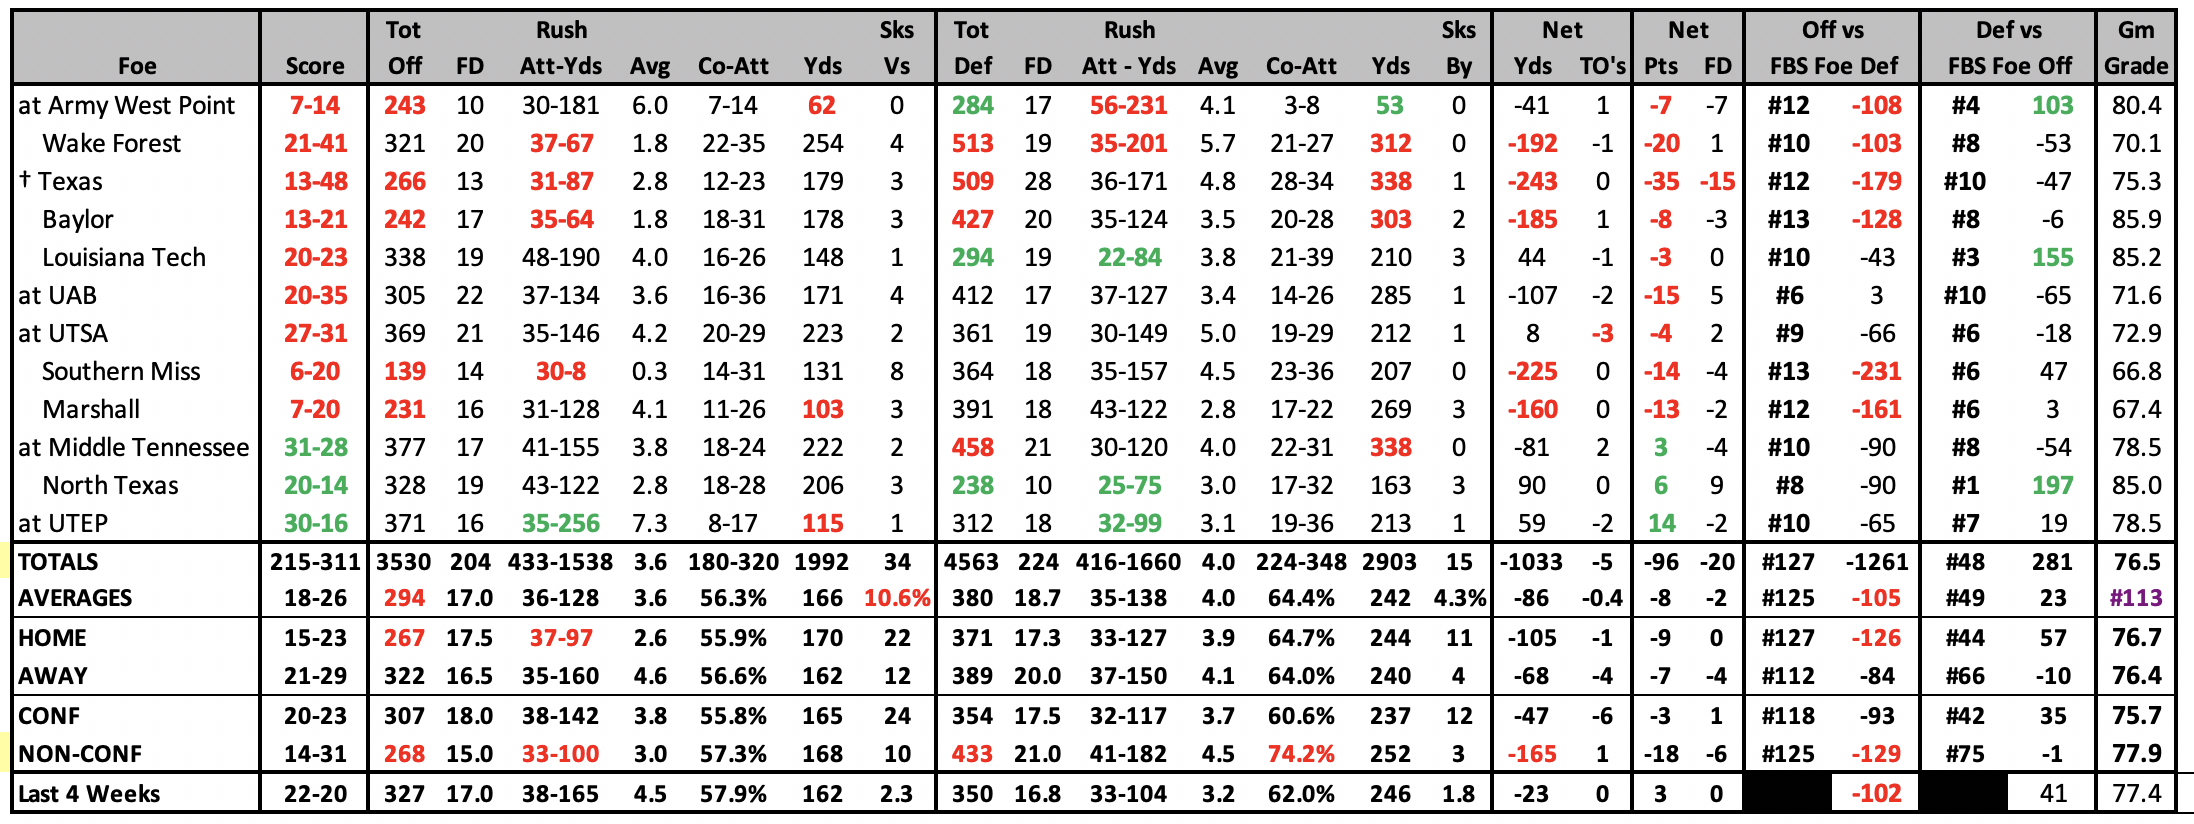
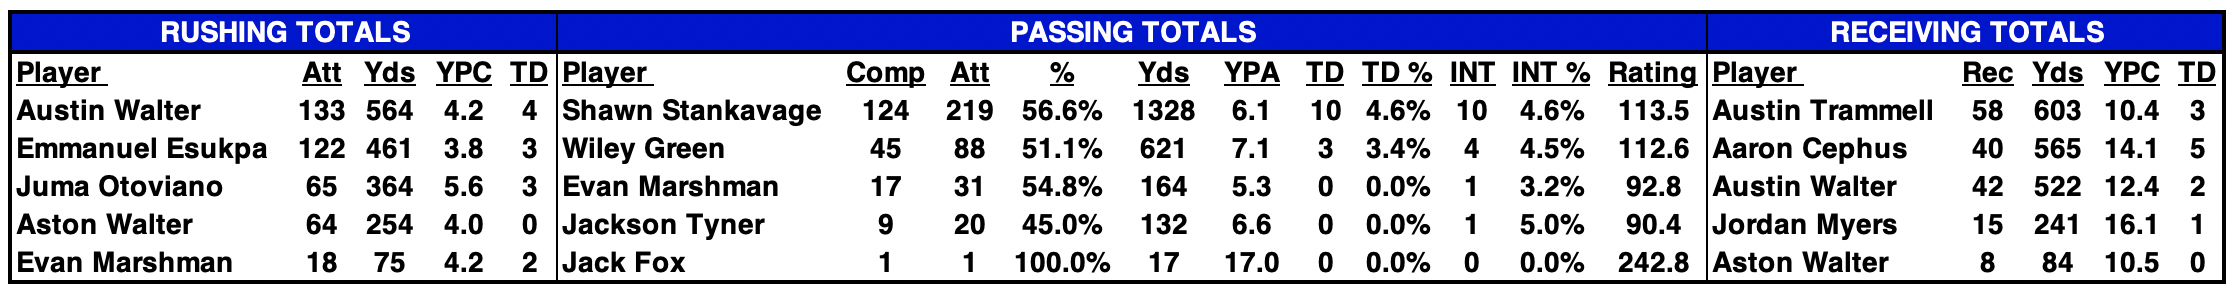
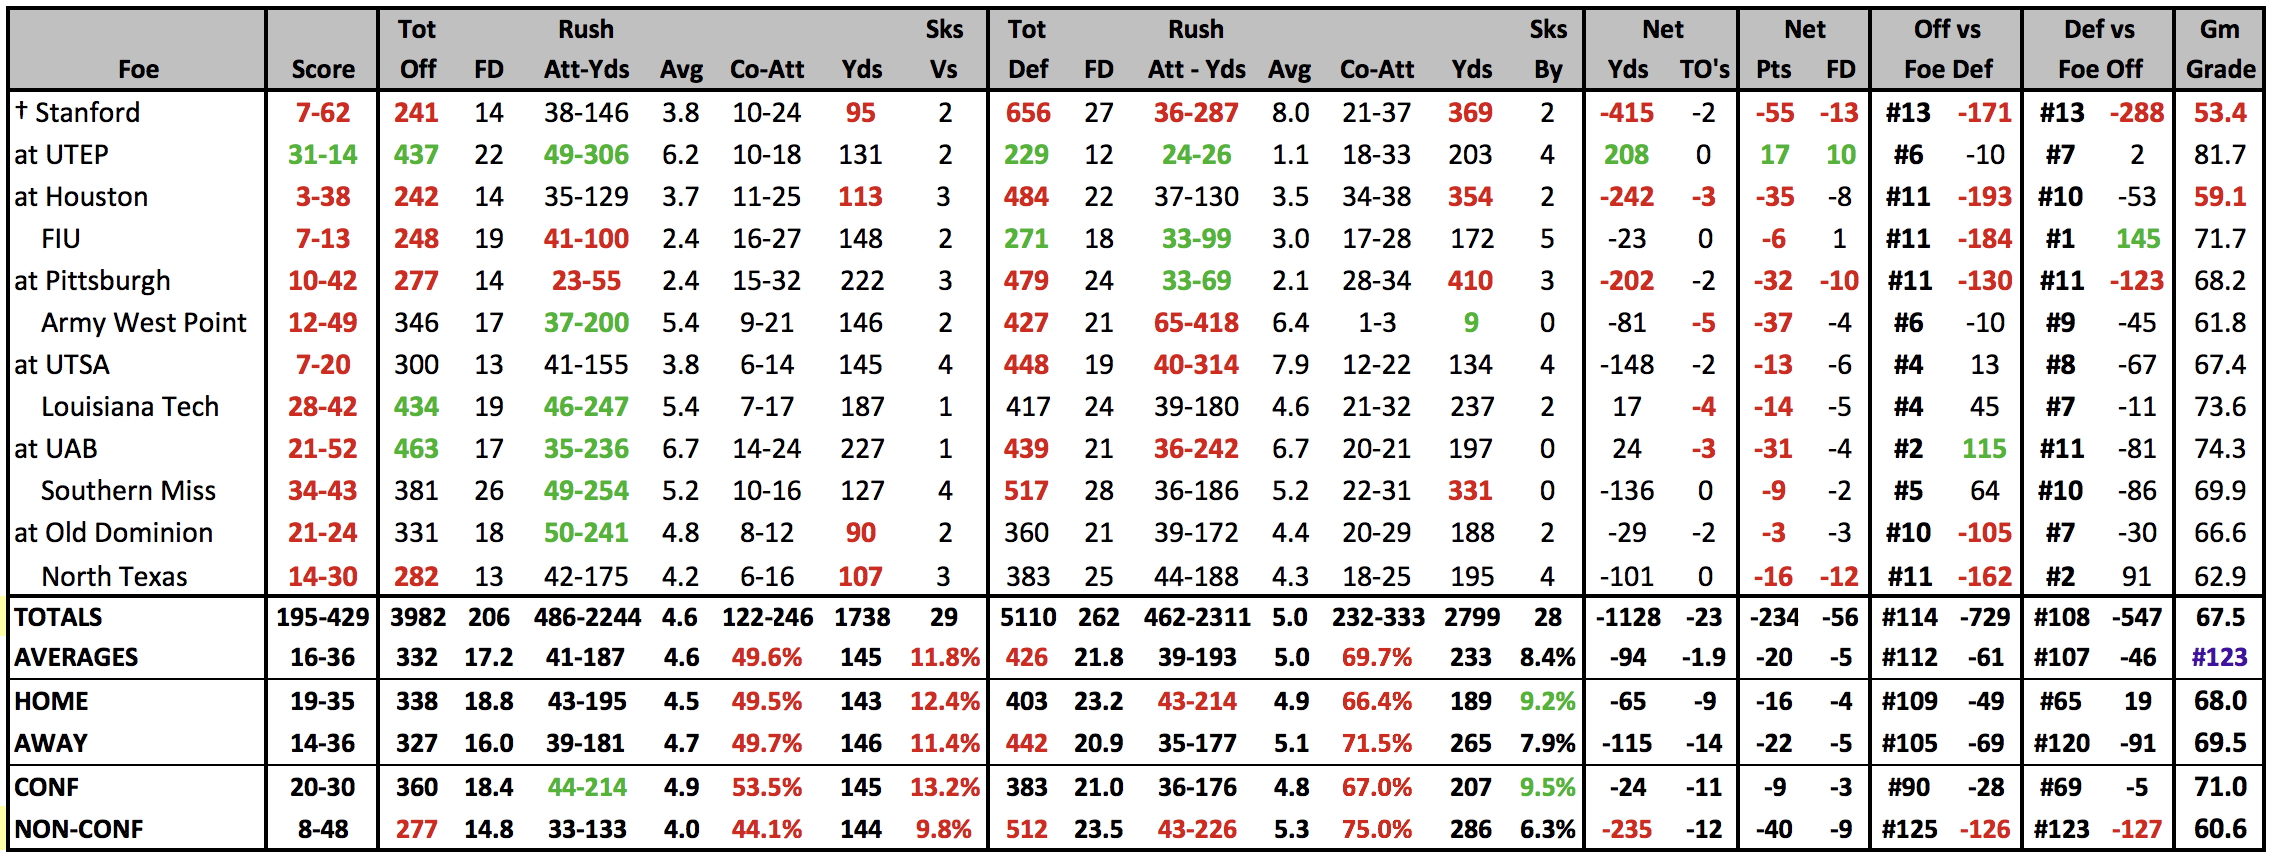
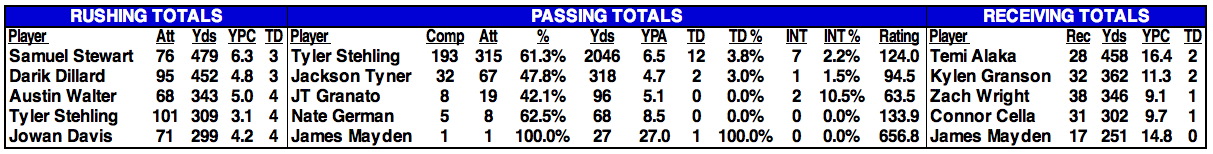
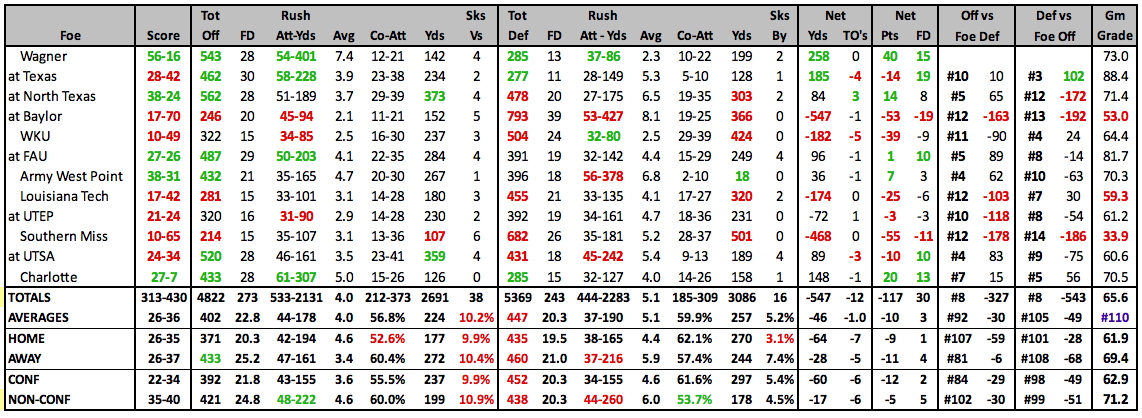
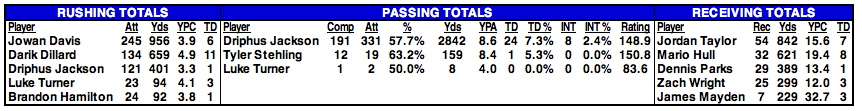
| 2024 GAME BY GAME STATS |
|---|
 |
2024 SCHEDULE |
2023 RESULTS |
||||||||||||||||||||||||||||||||||||||||||||||||||||||||||||||||||||||||||||||||||||||||||||||||||||||||||||||||||||||||||||||||||||||||||||||||||||||||||||||||||||||||||||||||||||||||||||||||
|
|
||||||||||||||||||||||||||||||||||||||||||||||||||||||||||||||||||||||||||||||||||||||||||||||||||||||||||||||||||||||||||||||||||||||||||||||||||||||||||||||||||||||||||||||||||||||||||||||||
|
|---|
| 2023 GAME BY GAME STATS |
|---|
 |
2023 SCHEDULE |
2022 RESULTS |
||||||||||||||||||||||||||||||||||||||||||||||||||||||||||||||||||||||||||||||||||||||||||||||||||||||||||||||||||||||||||||||||||||||||||||||||||||||||||||||||||||||||||||||||||||||||||||||||||||||
|
|
||||||||||||||||||||||||||||||||||||||||||||||||||||||||||||||||||||||||||||||||||||||||||||||||||||||||||||||||||||||||||||||||||||||||||||||||||||||||||||||||||||||||||||||||||||||||||||||||||||||
|
|---|
| 2022 GAME BY GAME STATS |
|---|
 |
2022 SCHEDULE |
2021 RESULTS |
||||||||||||||||||||||||||||||||||||||||||||||||||||||||||||||||||||||||||||||||||||||||||||||||||||||||||||||||||||||||||||||||||||||||||||||||||||||||||||||||||||||||||||||||||||||||||||||||
|
|
||||||||||||||||||||||||||||||||||||||||||||||||||||||||||||||||||||||||||||||||||||||||||||||||||||||||||||||||||||||||||||||||||||||||||||||||||||||||||||||||||||||||||||||||||||||||||||||||
|
|---|
| 2021 GAME BY GAME STATS |
|---|
 |
2021 SCHEDULE |
2020 RESULTS |
||||||||||||||||||||||||||||||||||||||||||||||||||||||||||||||||||||||||||||||||||||||||||||||||||||||||||||||||||||||||||||||||||||||||||||||||||||||||||||||||||||||||||||||||||||
|
|
|
|---|
| 2020 GAME BY GAME STATS |
|---|
 |
2020 SCHEDULE |
2019 RESULTS |
||||||||||||||||||||||||||||||||||||||||||||||||||||||||||||||||||||||||||||||||||||||||||||||||||||||||||||||||||||||||||||||||||||||||||||||||||||||||||||||||||||||||||||||||||||||||||
|
|
| 2019 STATISTICAL LEADERS |
|---|
| 2019 GAME BY GAME STATS |
|---|
 |
2019 SCHEDULE |
2018 RESULTS |
||||||||||||||||||||||||||||||||||||||||||||||||||||||||||||||||||||||||||||||||||||||||||||||||||||||||||||||||||||||||||||||||||||||||||||||||||||||||||||||||||||||||||||||||||||||||||||||||||||||||||||||||
|
|
| 2018 STATISTICAL LEADERS |
|---|
| 2018 GAME BY GAME STATS |
|---|
 |
2018 SCHEDULE |
2017 RESULTS |
||||||||||||||||||||||||||||||||||||||||||||||||||||||||||||||||||||||||||||||||||||||||||||||||||||||||||||||||||||||||||||||||||||||||||||||||||||||||||||||||||||||||||||||||||||||||||||||||||||||||||||||||||||||||||||||||
|
|
||||||||||||||||||||||||||||||||||||||||||||||||||||||||||||||||||||||||||||||||||||||||||||||||||||||||||||||||||||||||||||||||||||||||||||||||||||||||||||||||||||||||||||||||||||||||||||||||||||||||||||||||||||||||||||||||
| 2017 STATISTICAL LEADERS |
|---|
| 2017 GAME BY GAME STATS |
|---|
 |
2017 SCHEDULE |
2016 RESULTS |
|||||||||||||||||||||||||||||||||||||||||||||||||||||||||||||||||||||||||||||||||||||||||||||||||||||||||||||||||||||||||||||||||||||||||||||||||||||||||||||||||||||||||||||||||||||||||||||||||||||||||||||||||||||||||
|
|
|||||||||||||||||||||||||||||||||||||||||||||||||||||||||||||||||||||||||||||||||||||||||||||||||||||||||||||||||||||||||||||||||||||||||||||||||||||||||||||||||||||||||||||||||||||||||||||||||||||||||||||||||||||||||
| 2016 STATISTICAL LEADERS |
|---|
| 2016 GAME BY GAME STATS |
|---|
 |
| 2015 STATISTICAL LEADERS |
|---|
| 2015 GAME BY GAME STATS |
|---|
 |
2015 SCHEDULE |
2014 RESULTS |
||||||||||||||||||||||||||||||||||||||||||||||||||||||||||||||||||||||||||||||||||||||||||||||||||||||||||||||||||||||||||||||||||||||||||||||||||||||||||||||||||||||||||||||||||||||||||||||||||||||||||||||||||||||||||||||||||||||||||||||
|
|
||||||||||||||||||||||||||||||||||||||||||||||||||||||||||||||||||||||||||||||||||||||||||||||||||||||||||||||||||||||||||||||||||||||||||||||||||||||||||||||||||||||||||||||||||||||||||||||||||||||||||||||||||||||||||||||||||||||||||||||
| 2014 STATISTICAL LEADERS |
|---|
| 2014 GAME BY GAME STATS |
|---|
 |
| 2013 STATISTICAL LEADERS |
|---|
| Player | Att | Yds | YPC | TD | Player | Comp | Att | % | Yds | YPA | TD | INT | Rating | Player | Rec | Yds | YPC | TD |
| Charles Ross | 211 | 1280 | 6.1 | 15 | Taylor McHargue | 169 | 325 | 52.0% | 2345 | 7.2 | 17 | 9 | 124.3 | Jordan Taylor | 55 | 848 | 15.4 | 8 |
| Jowan Davis | 95 | 476 | 5.0 | 3 | Luke Turner | 3 | 4 | 75.0% | 100 | 25.0 | 3 | 0 | 532.5 | Dennis Parks | 29 | 508 | 17.5 | 3 |
| Taylor McHargue | 157 | 464 | 3.0 | 5 | Driphus Jackson | 5 | 15 | 33.3% | 50 | 3.3 | 0 | 0 | 61.3 | Turner Petersen | 26 | 348 | 13.4 | 4 |
| 2013 GAME BY GAME STATS |
|---|
 |
2013 RESULTS |
2012 RESULTS |
||||||||||||||||||||||||||||||||||||||||||||||||||||||||||||||||||||||||||||||||||||||||||||||||||||||||||||||||||||||||||||||||||||||||||||||||||||||||||||||||||||||||||||||||||||||||||||||||||||||||||||||||||||||||||||||||||||||||||||||||||||||||||||||||
|
|
||||||||||||||||||||||||||||||||||||||||||||||||||||||||||||||||||||||||||||||||||||||||||||||||||||||||||||||||||||||||||||||||||||||||||||||||||||||||||||||||||||||||||||||||||||||||||||||||||||||||||||||||||||||||||||||||||||||||||||||||||||||||||||||||
| 2012 STATISTICAL LEADERS |
|---|
| Player | Att | Yds | YPC | TD | Player | Comp | Att | % | Yds | YPA | TD | INT | Rating | Player | Rec | Yds | YPC | TD | ||
| Charles Ross | 147 | 800 | 5.4 | 5 | Taylor McHargue | 194 | 325 | 59.7% | 2209 | 6.8 | 12 | 5 | 125.9 | Jordan Taylor | 57 | 826 | 14.5 | 3 | ||
| Taylor McHargue | 164 | 667 | 4.1 | 11 | Driphus Jackson | 37 | 63 | 58.7% | 640 | 10.2 | 6 | 0 | 175.5 | Sam McGuffie | 54 | 603 | 11.2 | 5 | ||
| Turner Petersen | 128 | 591 | 4.6 | 5 | Luke Turner | 1 | 1 | 100.0% | 38 | 38.0 | 1 | 0 | 749.2 | Vance McDonald | 36 | 458 | 12.7 | 2 |
| 2012 Individual Player Stats • 2012 Start Chart/Starters Lost |
|---|
| 2012 GAME BY GAME STATS |
|---|
 |
| 2011 STATISTICAL LEADERS |
|---|
| Player | Att | Yds | YPC | TD | Player | Comp | Att | % | Yds | YPA | TD | INT | Rating | Player | Rec | Yds | YPC | TD | ||
| Tyler Smith | 155 | 860 | 5.5 | 5 | Nick Fanuzzi | 112 | 193 | 58.0% | 1123 | 5.8 | 7 | 2 | 116.8 | Vance McDonald | 43 | 532 | 12.4 | 5 | ||
| Turner Petersen | 102 | 485 | 4.8 | 5 | Taylor McHargue | 100 | 174 | 57.5% | 1072 | 6.2 | 8 | 5 | 118.6 | Luke Wilson | 29 | 313 | 10.8 | 3 | ||
| Sam McGuffie | 38 | 158 | 4.2 | 1 | J Taylor | 2 | 2 | 100.0% | 77 | 38.5 | 0 | 0 | 423.4 | Tyler Smith | 39 | 309 | 7.9 | 1 |
| 2011 Individual Player Stats • 2011 Start Chart/ Starters Lost |
|---|
| 2011 GAME BY GAME STATS |
|---|
2011 RESULTS |
2010 RESULTS |
||||||||||||||||||||||||||||||||||||||||||||||||||||||||||||||||||||||||||||||||||||||||||||||||||||||||||||||||||||||||||||||||||||||||||||||||||||||||||||||||||||||||||||||||||||||
|
|
||||||||||||||||||||||||||||||||||||||||||||||||||||||||||||||||||||||||||||||||||||||||||||||||||||||||||||||||||||||||||||||||||||||||||||||||||||||||||||||||||||||||||||||||||||||
| 2010 STATISTICAL LEADERS |
|---|
| Player | Att | Yds | YPC | TD | Player | Comp | Att | % | Yds | YPA | TD | INT | Rating | Player | Rec | Yds | YPC | TD | ||
| Sam McGuffie | 197 | 883 | 4.48 | 6 | Nick Fanuzzi | 151 | 241 | 62.7% | 1681 | 7.0 | 11 | 9 | 128.8 | Luke Willson | 33 | 425 | 12.9 | 3 | ||
| Jeremy Eddington | 59 | 365 | 6.19 | 10 | Taylor McHargue | 33 | 58 | 56.9% | 491 | 8.5 | 6 | 1 | 158.7 | Vance McDonald | 28 | 396 | 14.1 | 8 | ||
| Tyler Smith | 70 | 279 | 3.99 | 1 | Taylor Cook | 32 | 57 | 56.1% | 409 | 7.2 | 3 | 1 | 130.3 | Sam McGuffie | 39 | 384 | 9.8 | 3 |
| 2010 Individual Player Stats |
|---|
| 2010 GAME BY GAME STATS |
|---|
| 2009 STATISTICAL LEADERS |
|---|
| Player | Att | Yds | YPC | TD | Player | Comp | Att | % | Yds | YPA | TD | INT | Rating | Player | Rec | Yds | YPC | TD | ||
| Charles Ross | 97 | 491 | 5.06 | 11 | Nick Fanuzzi | 162 | 270 | 60.0% | 1598 | 5.9 | 11 | 8 | 117.2 | Toren Dixon | 60 | 660 | 11.0 | 6 | ||
| Tyler Smith | 101 | 428 | 4.24 | 1 | JT Shepherd | 59 | 110 | 53.6% | 506 | 4.6 | 2 | 5 | 89.2 | Patrick Randolph | 39 | 356 | 9.1 | 4 | ||
| Jeramy Goodson | 57 | 223 | 3.91 | 0 | Ryan Lewis | 27 | 70 | 38.6% | 240 | 3.4 | 1 | 4 | 60.7 | Taylor Wardlow | 31 | 347 | 11.2 | 1 |
| 2009 GAME BY GAME STATS |
|---|
2009 RESULTS |
2008 RESULTS |
||||||||||||||||||||||||||||||||||||||||||||||||||||||||||||||||||||||||||||||||||||||||||||||||||||||||||||||||||||||||||||||||||||||||||||||||||||||
|
|
||||||||||||||||||||||||||||||||||||||||||||||||||||||||||||||||||||||||||||||||||||||||||||||||||||||||||||||||||||||||||||||||||||||||||||||||||||||
| 2008 Individual Player Stats • 2007 Individual Player Stats |
|---|