
| TULSA GOLDEN HURRICANE |
|---|
|
STADIUM: H.A. Chapman Stadium PLAYING SURFACE: Revolution Cool Play • CAPACITY: 30,000 STARTERS RETURNING (O/D): 5*/5 LETTERMAN RETURNING: 32 (8,20,4) • LETTERMAN LOST: 32 (20,12,0) |
 |
|
| LOCATION: Tulsa, OK | |
| FOUNDED: 1894 | |
| ENROLLMENT: 2,728 | |
| COLORS: Old Gold, Royal Blue & Crimson |
|
| MASCOT: Captain Cane | |
| CONFERENCE: AAC | |
| HC: Trey Lamb | |
| YEARS WITH TM: 1st | |
| OVERALL RECORD: 0-0 | |
| RECORD WITH TM: 0-0 |
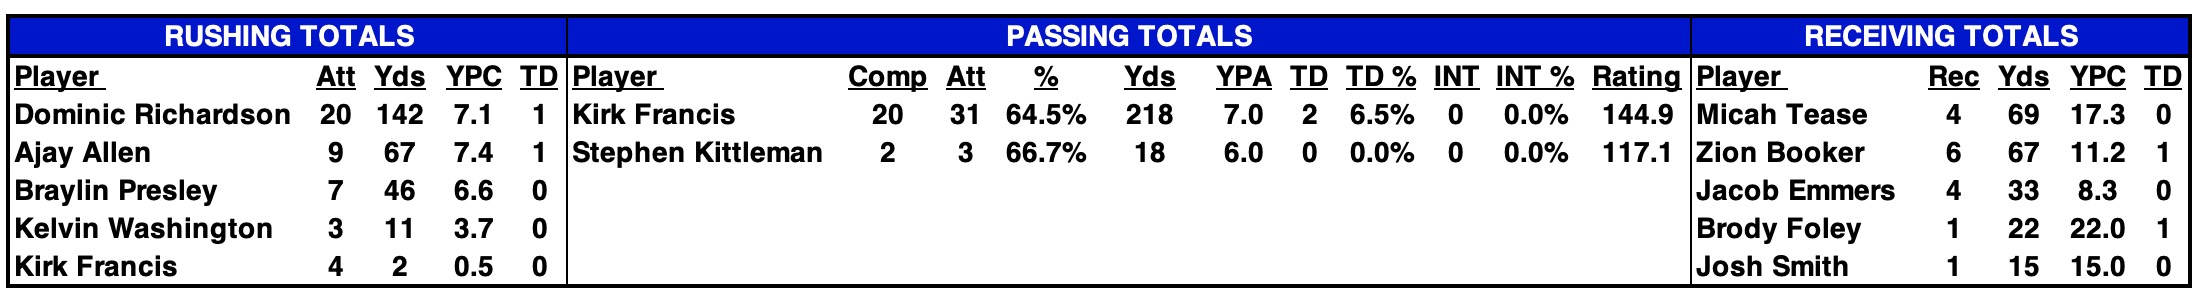
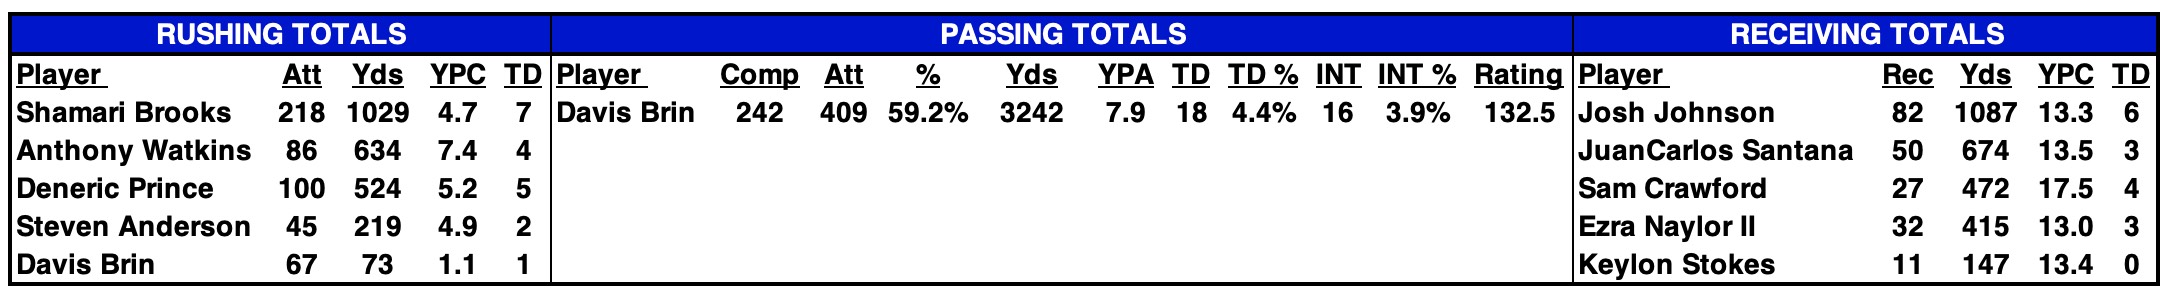
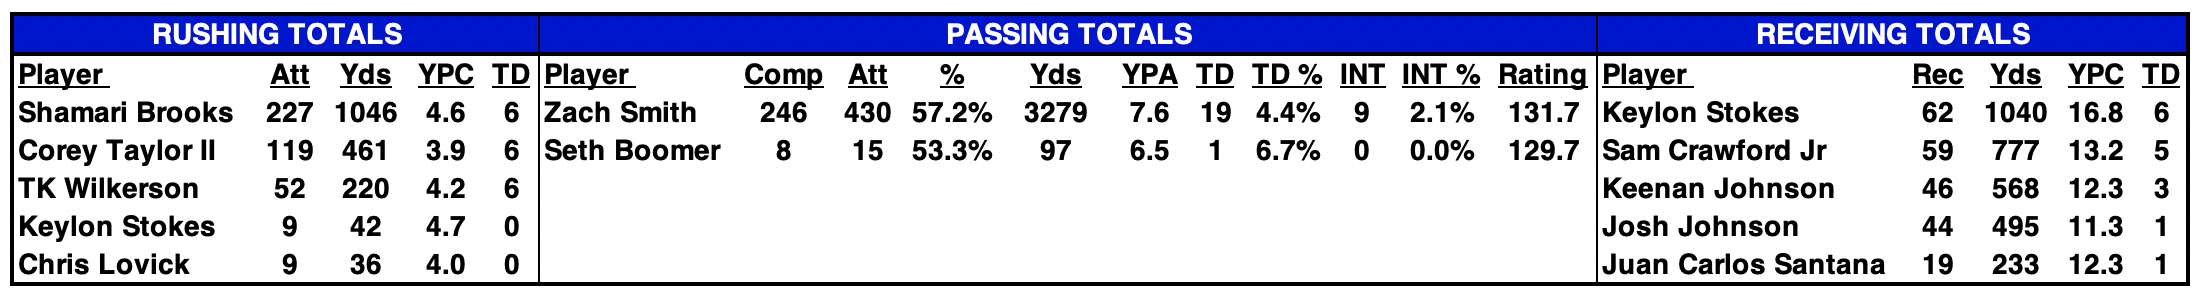
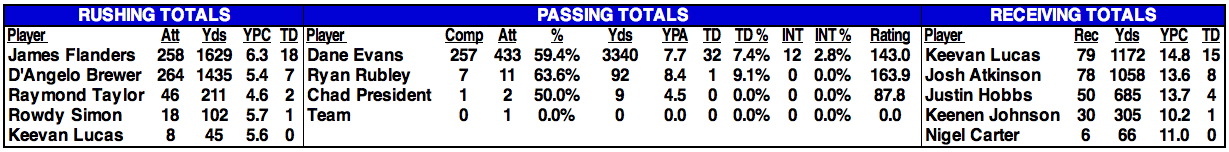
| 2025 STATISTICAL LEADERS |
|---|
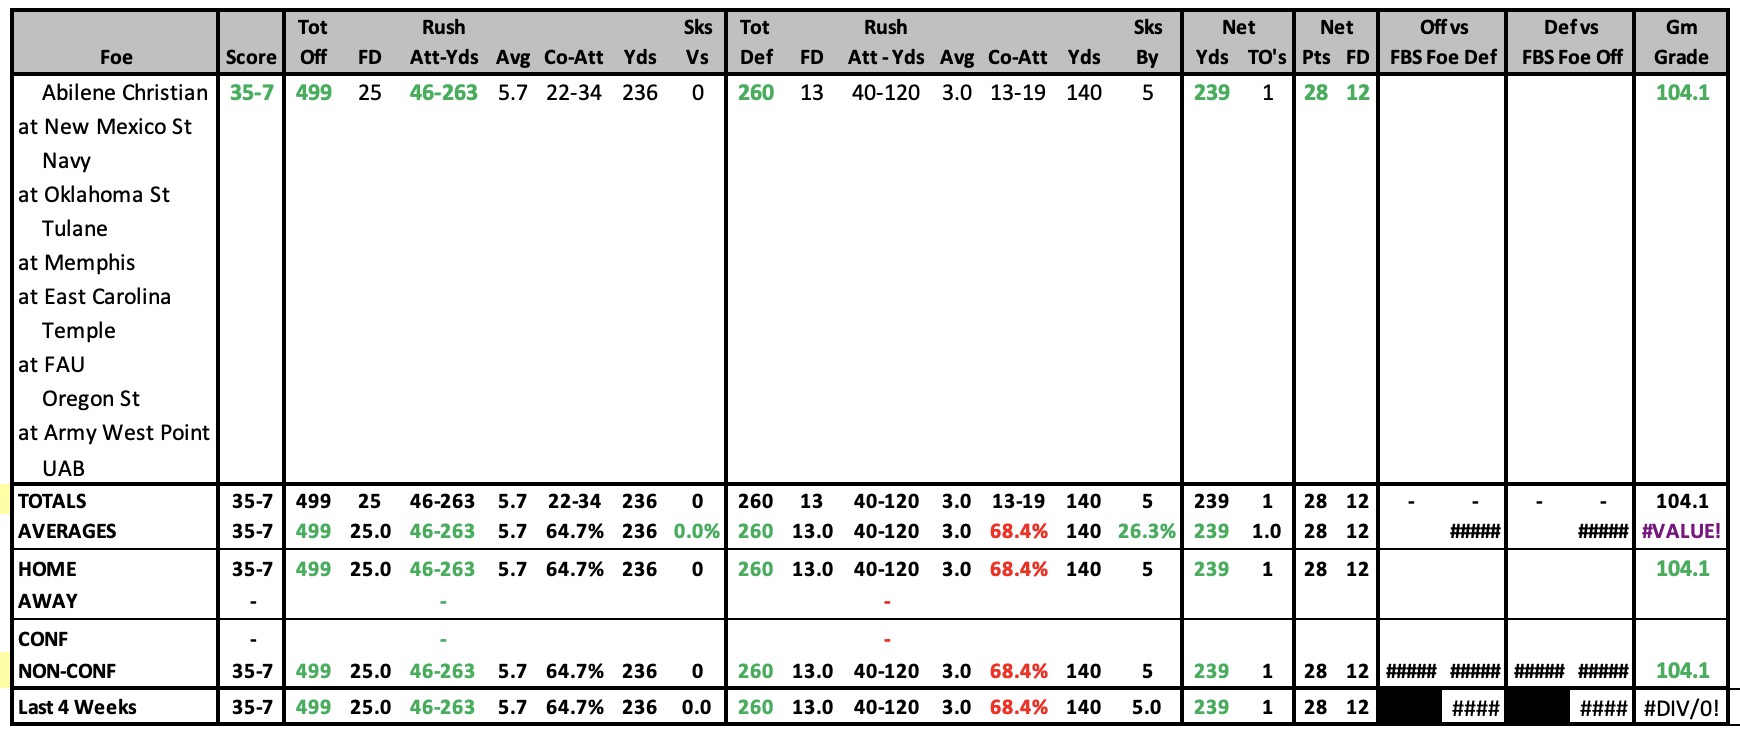
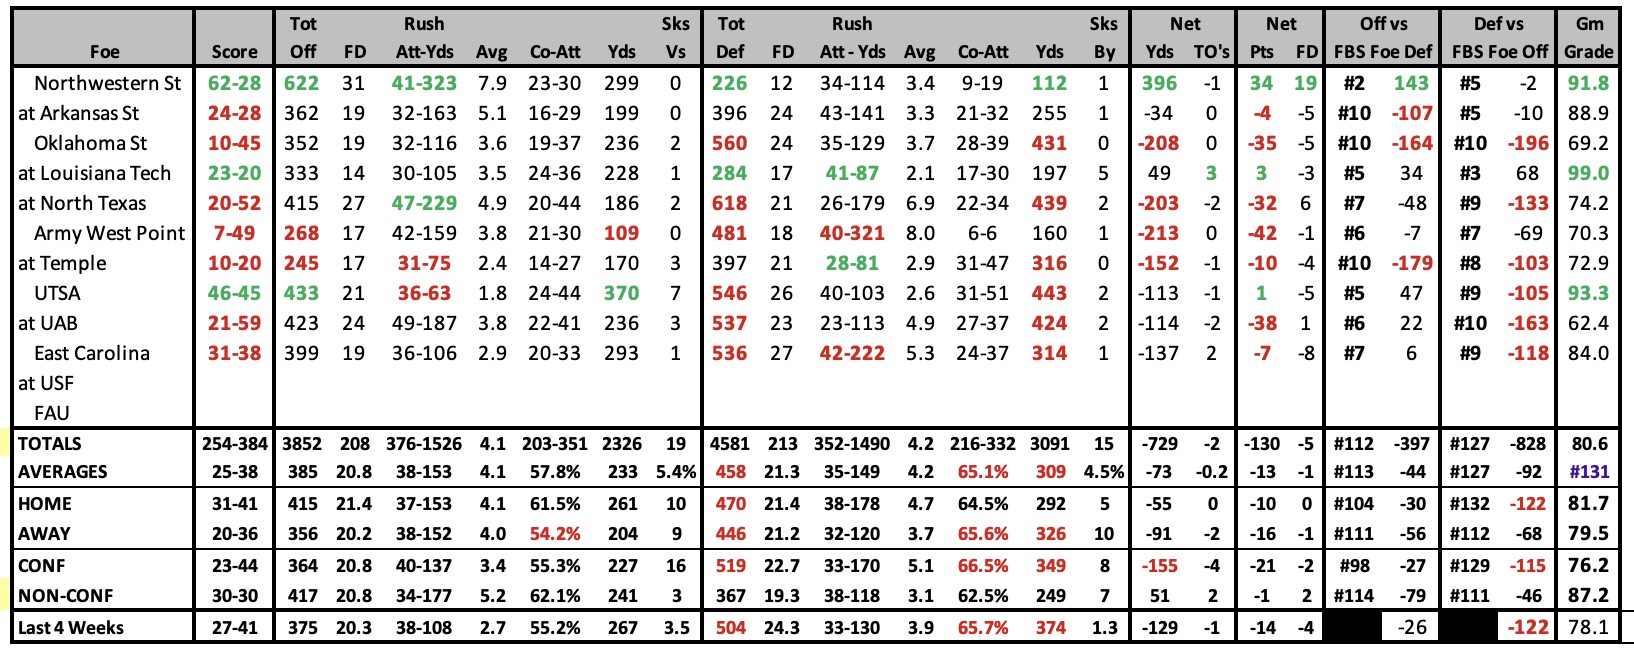
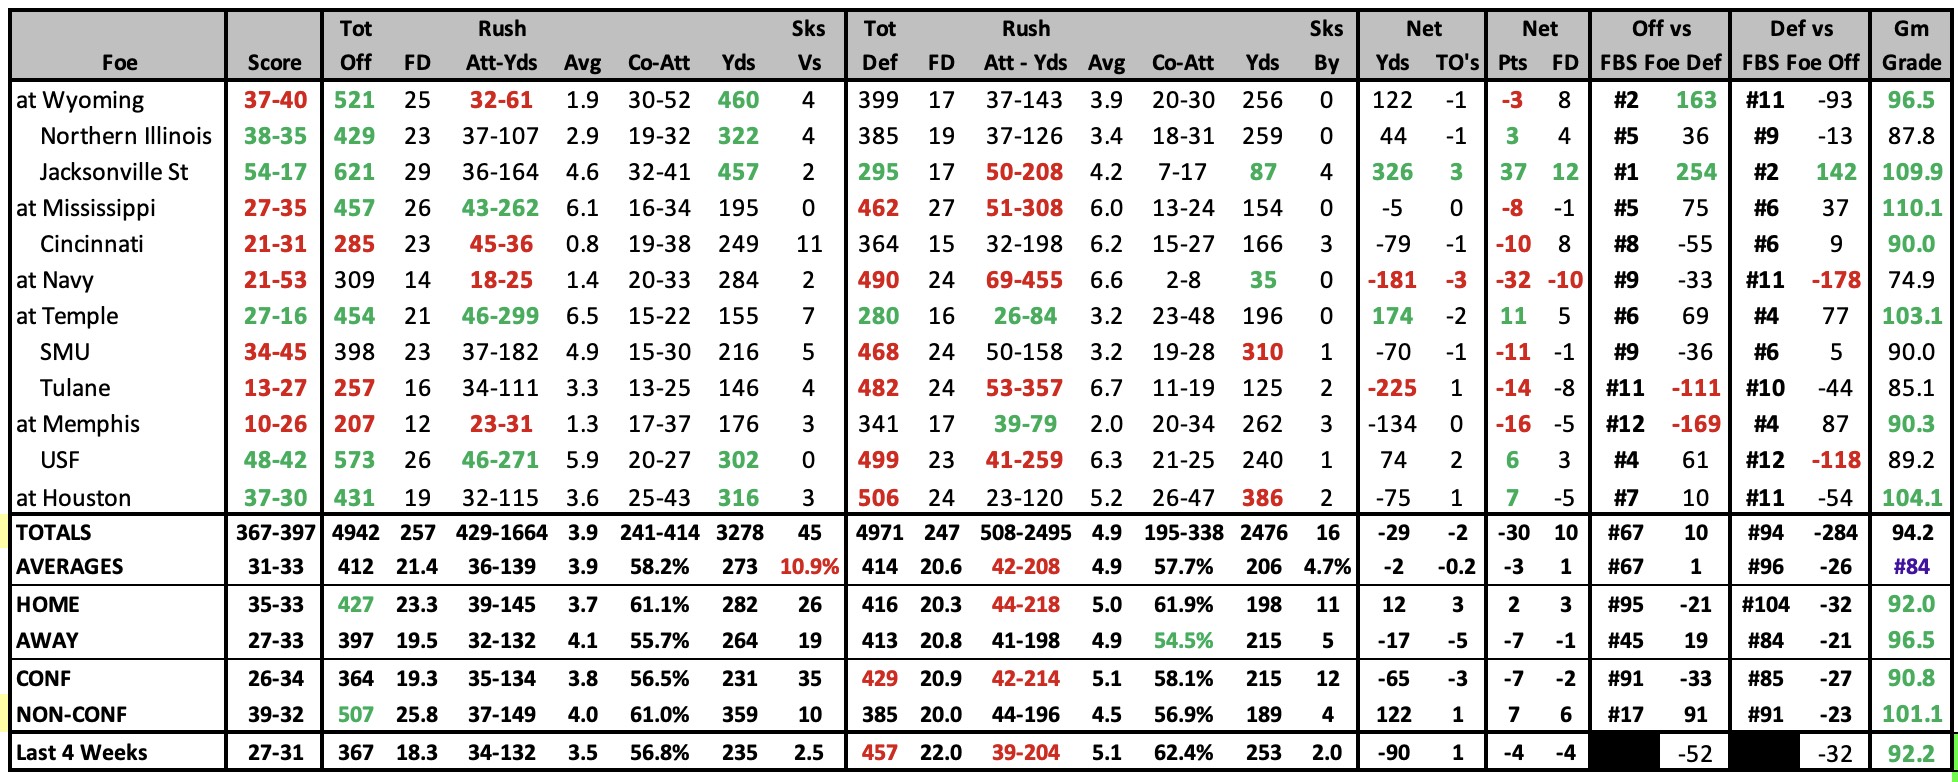
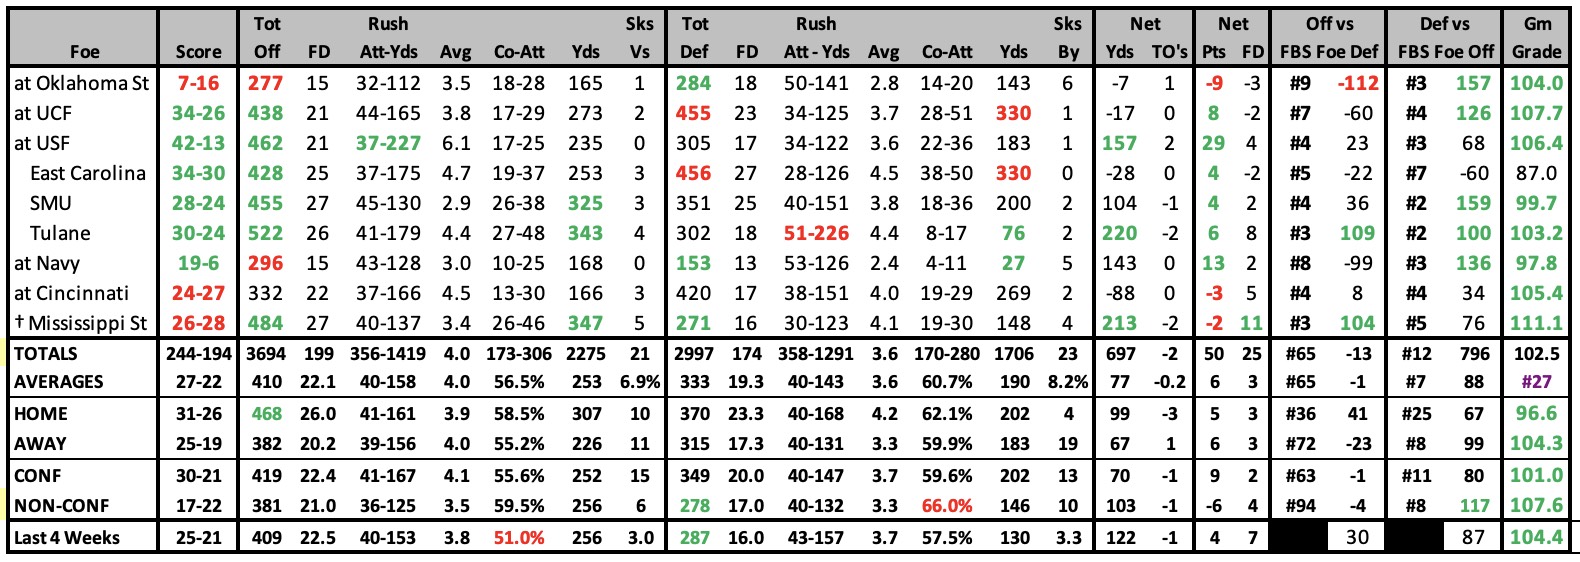
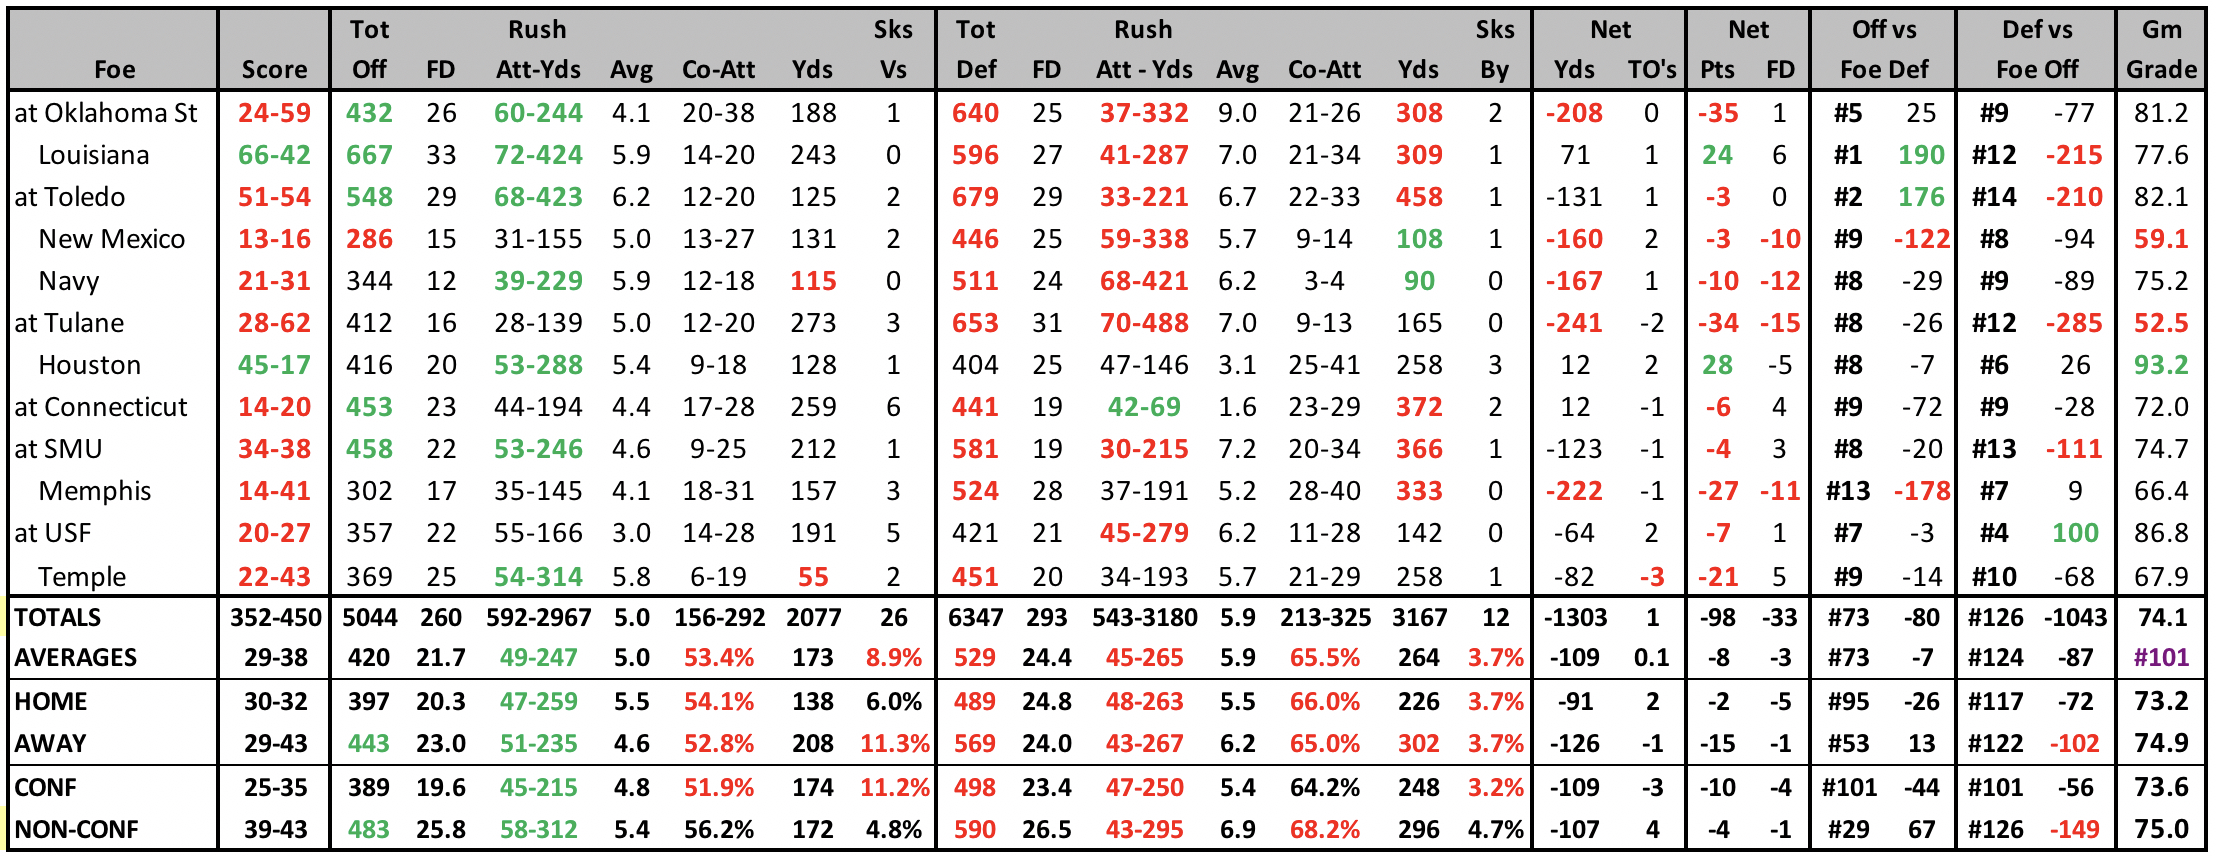
| 2025 GAME BY GAME STATS |
|---|
 |
2025 SCHEDULE |
2024 RESULTS |
||||||||||||||||||||||||||||||||||||||||||||||||||||||||||||||||||||||||||||||||||||||||||||||||||||||||||||||||||||||||||||||||||||||||||||||||||||||||||||||||||||||||||||||||||||||||||||||||
|
|
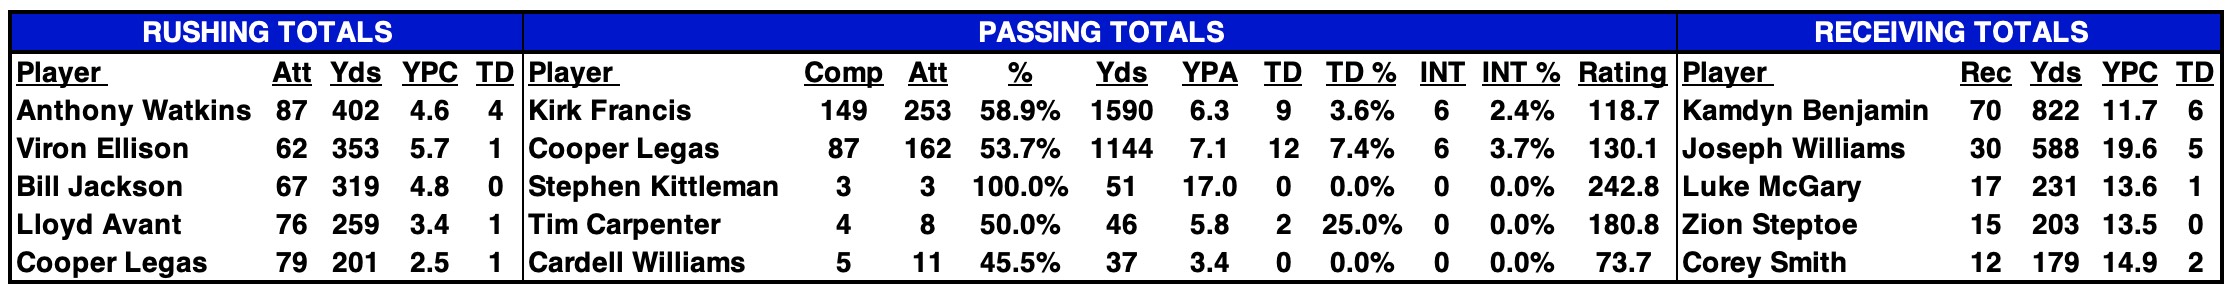
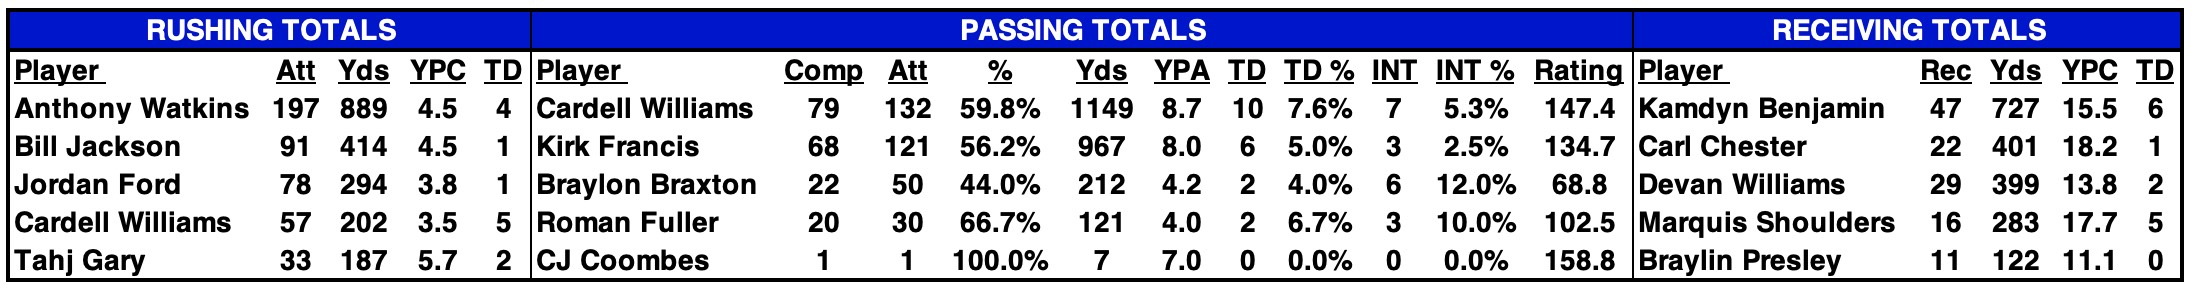
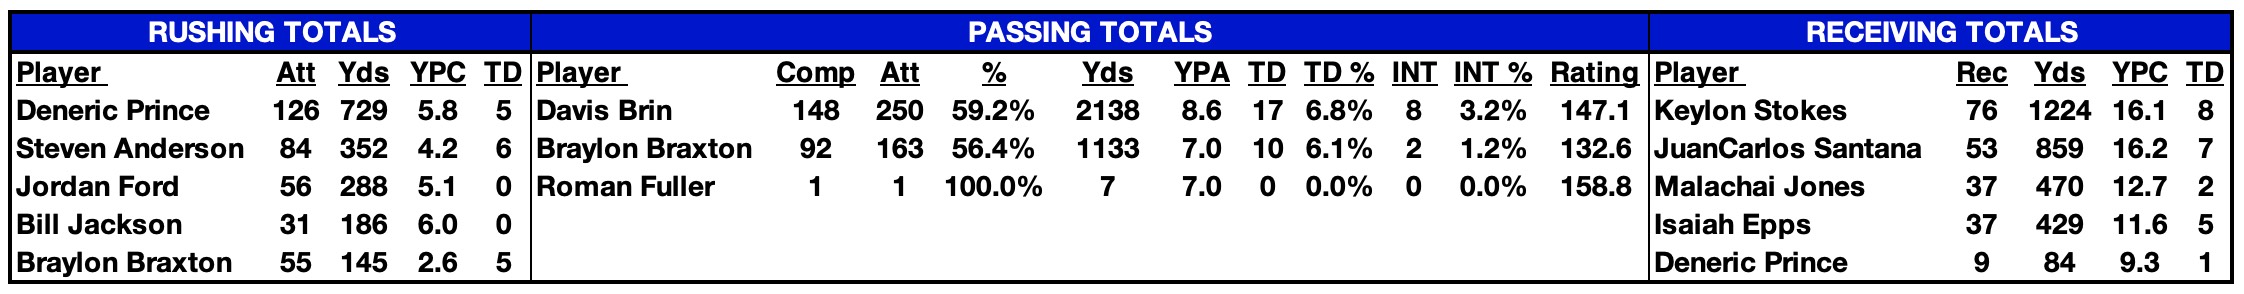
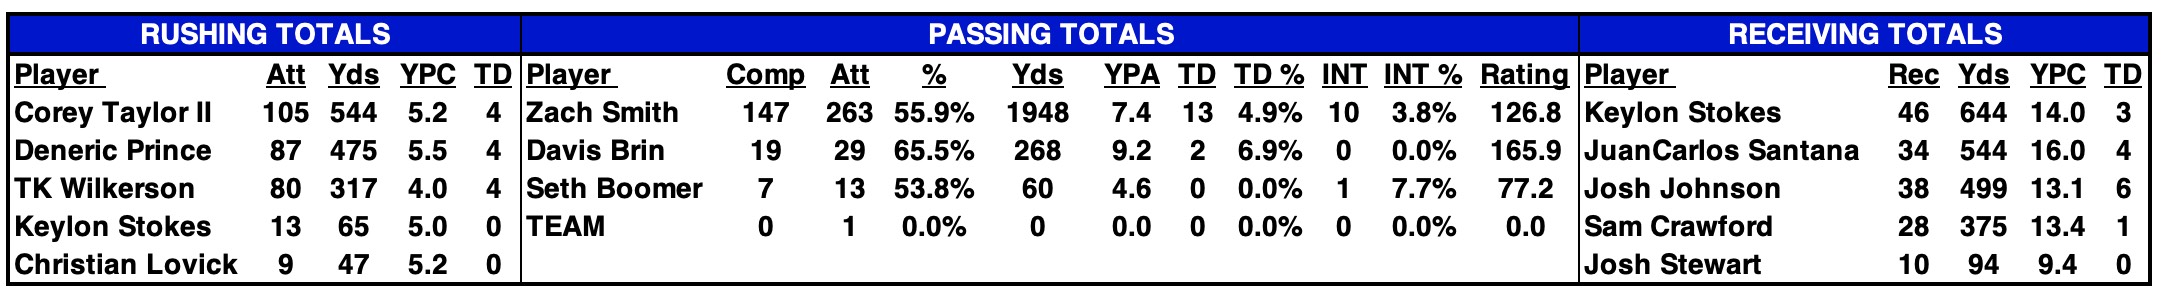
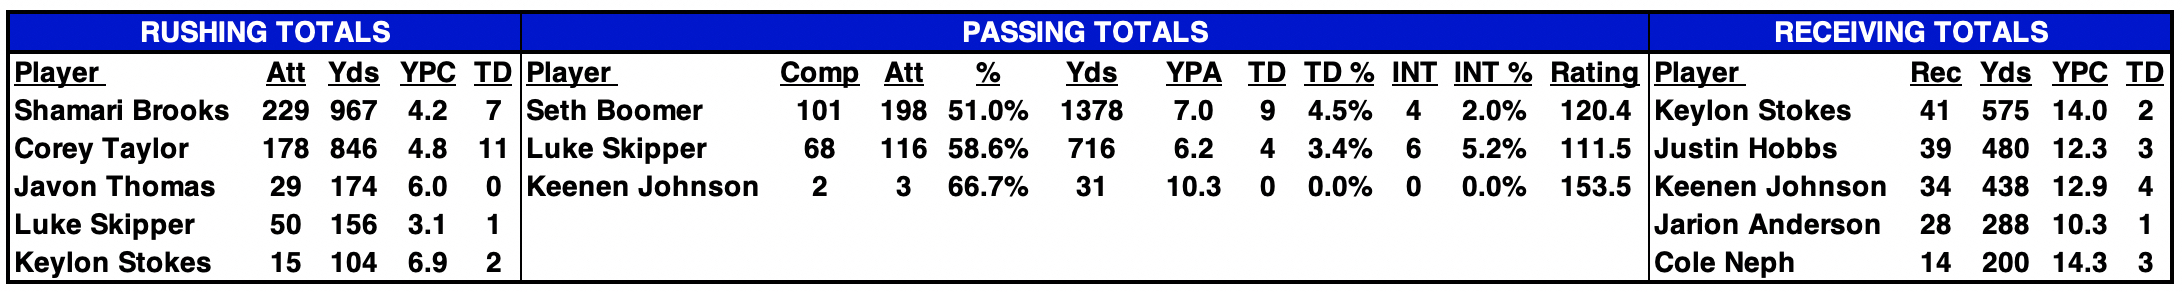
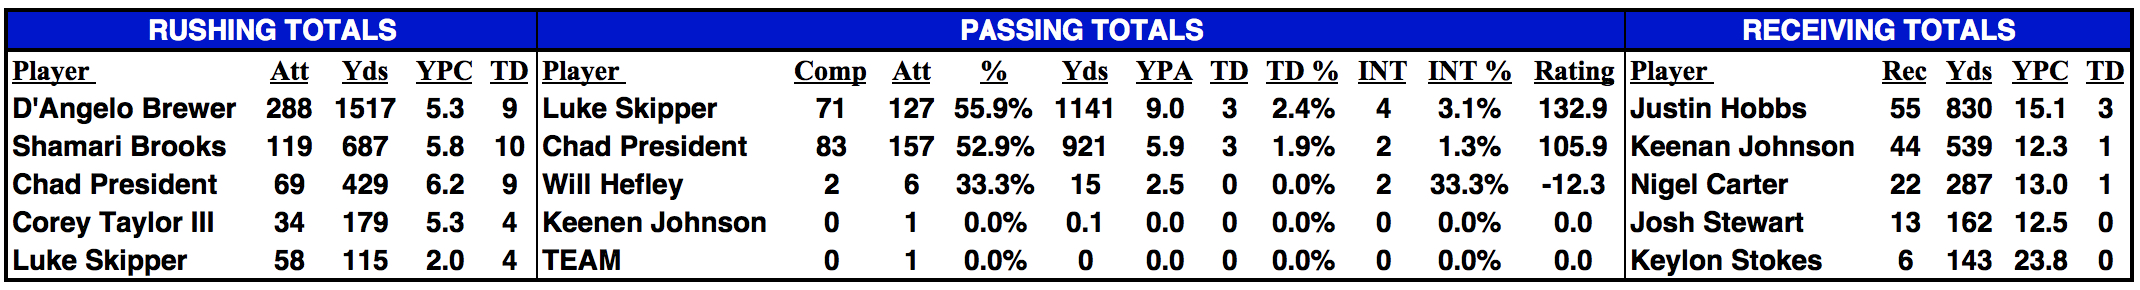
| 2024 STATISTICAL LEADERS |
|---|
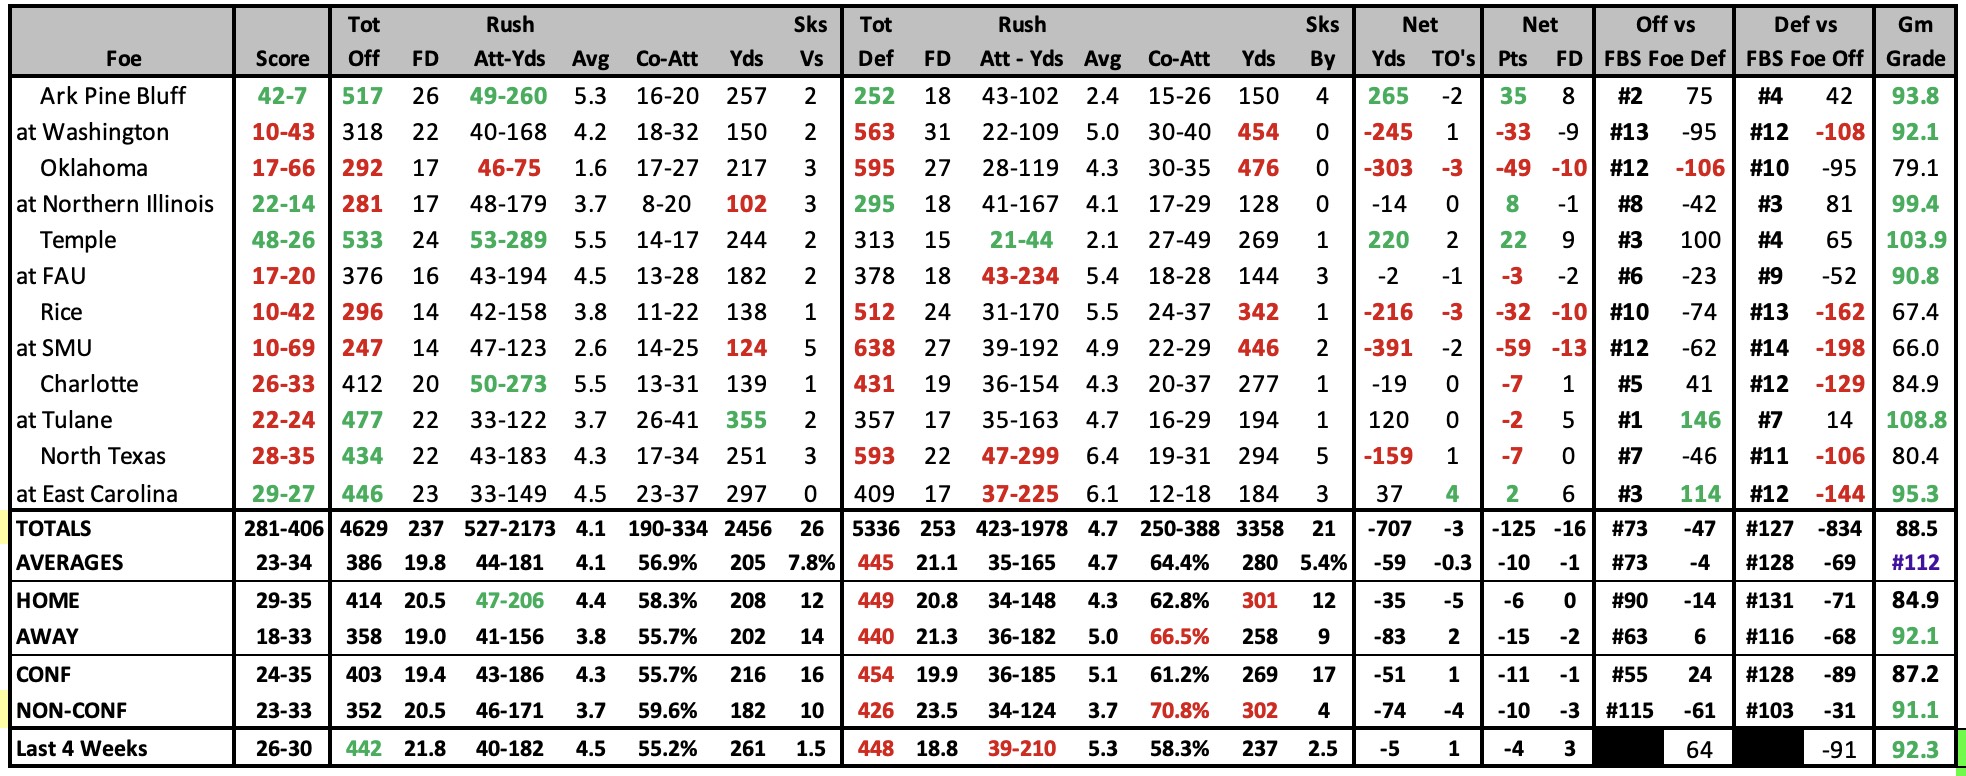
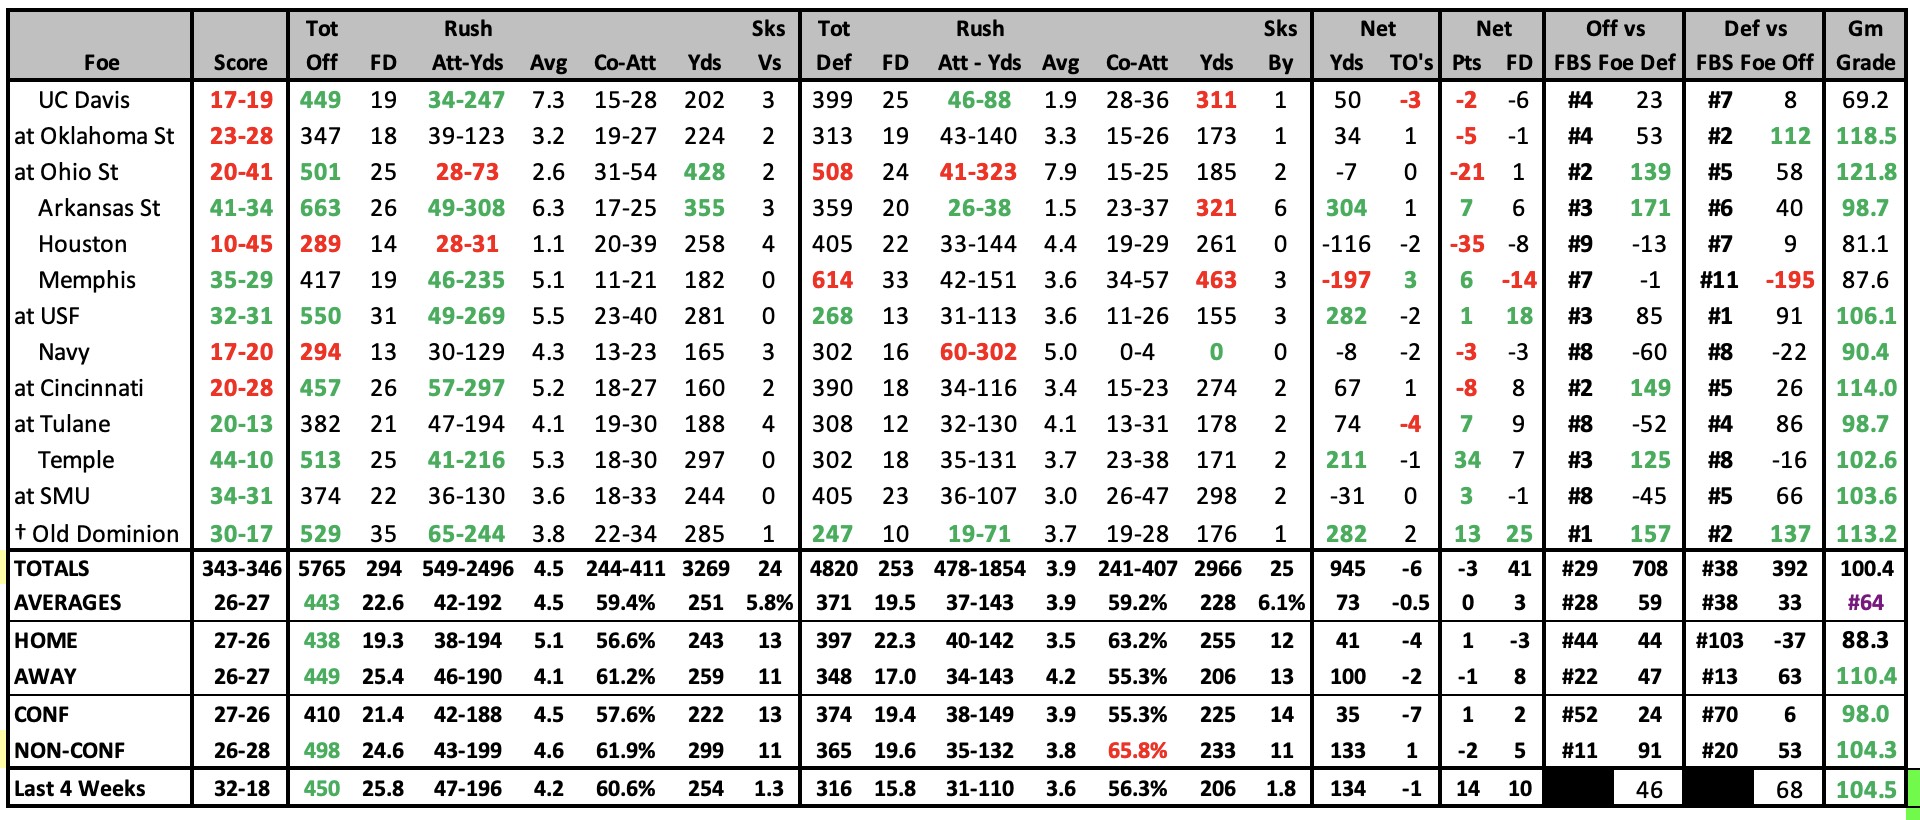
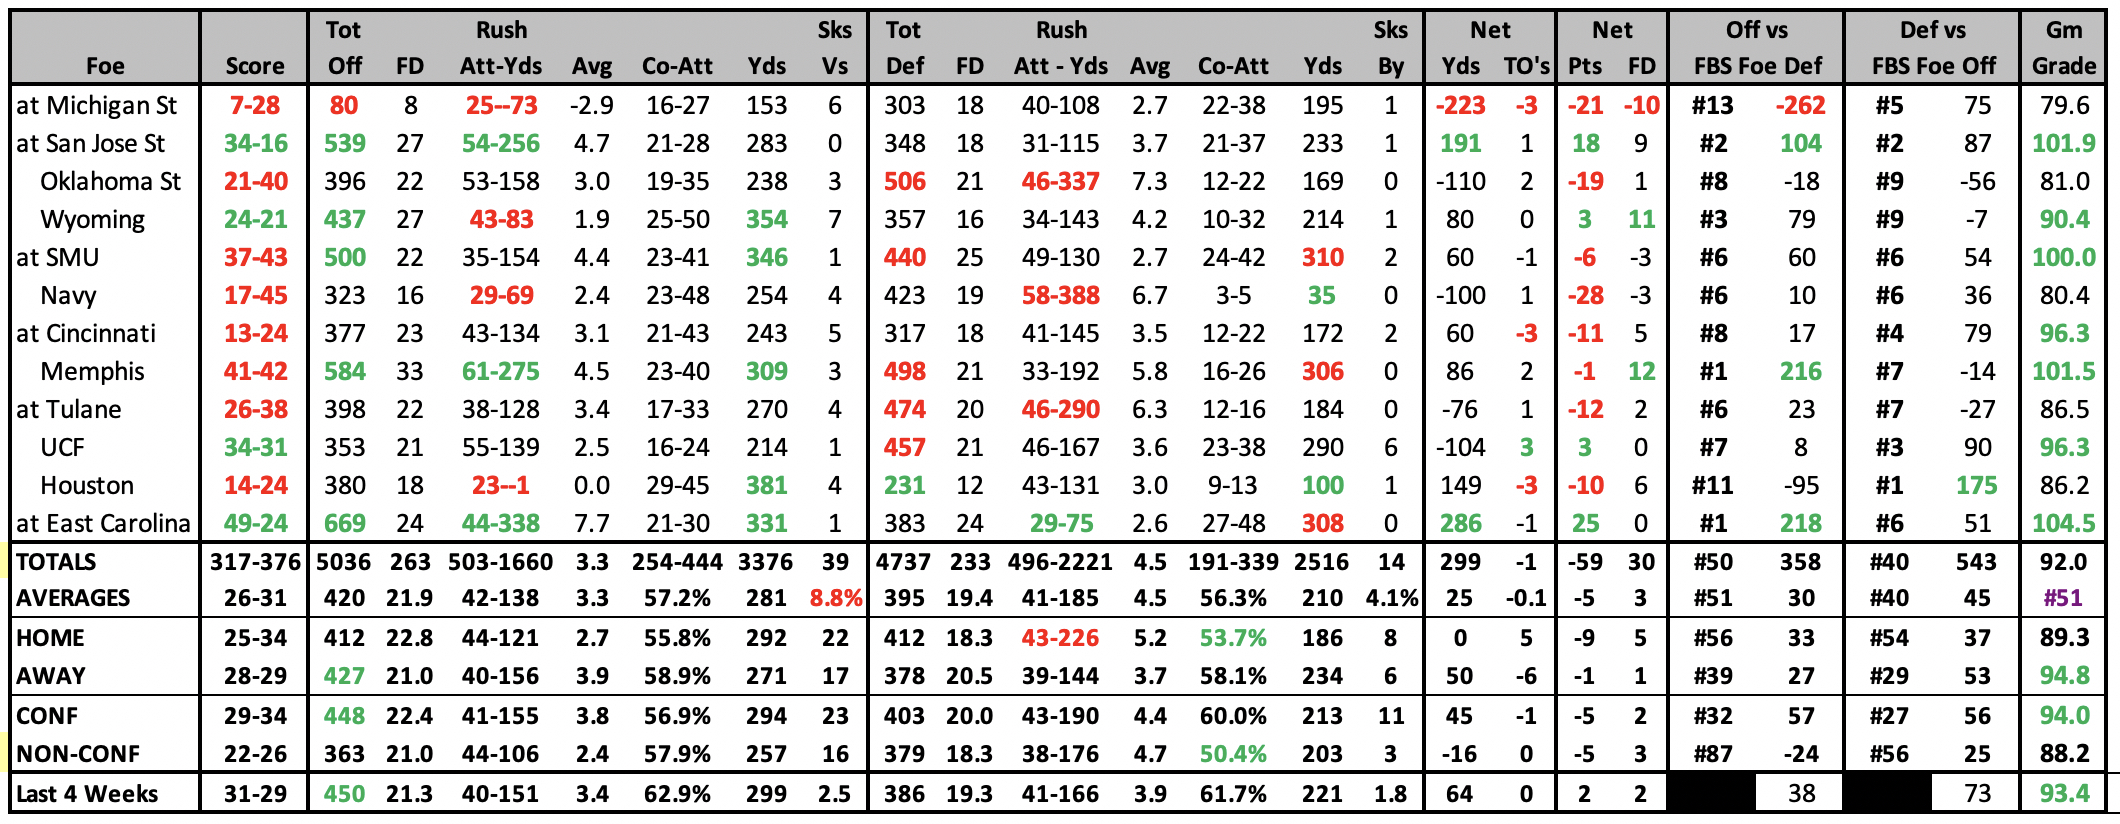
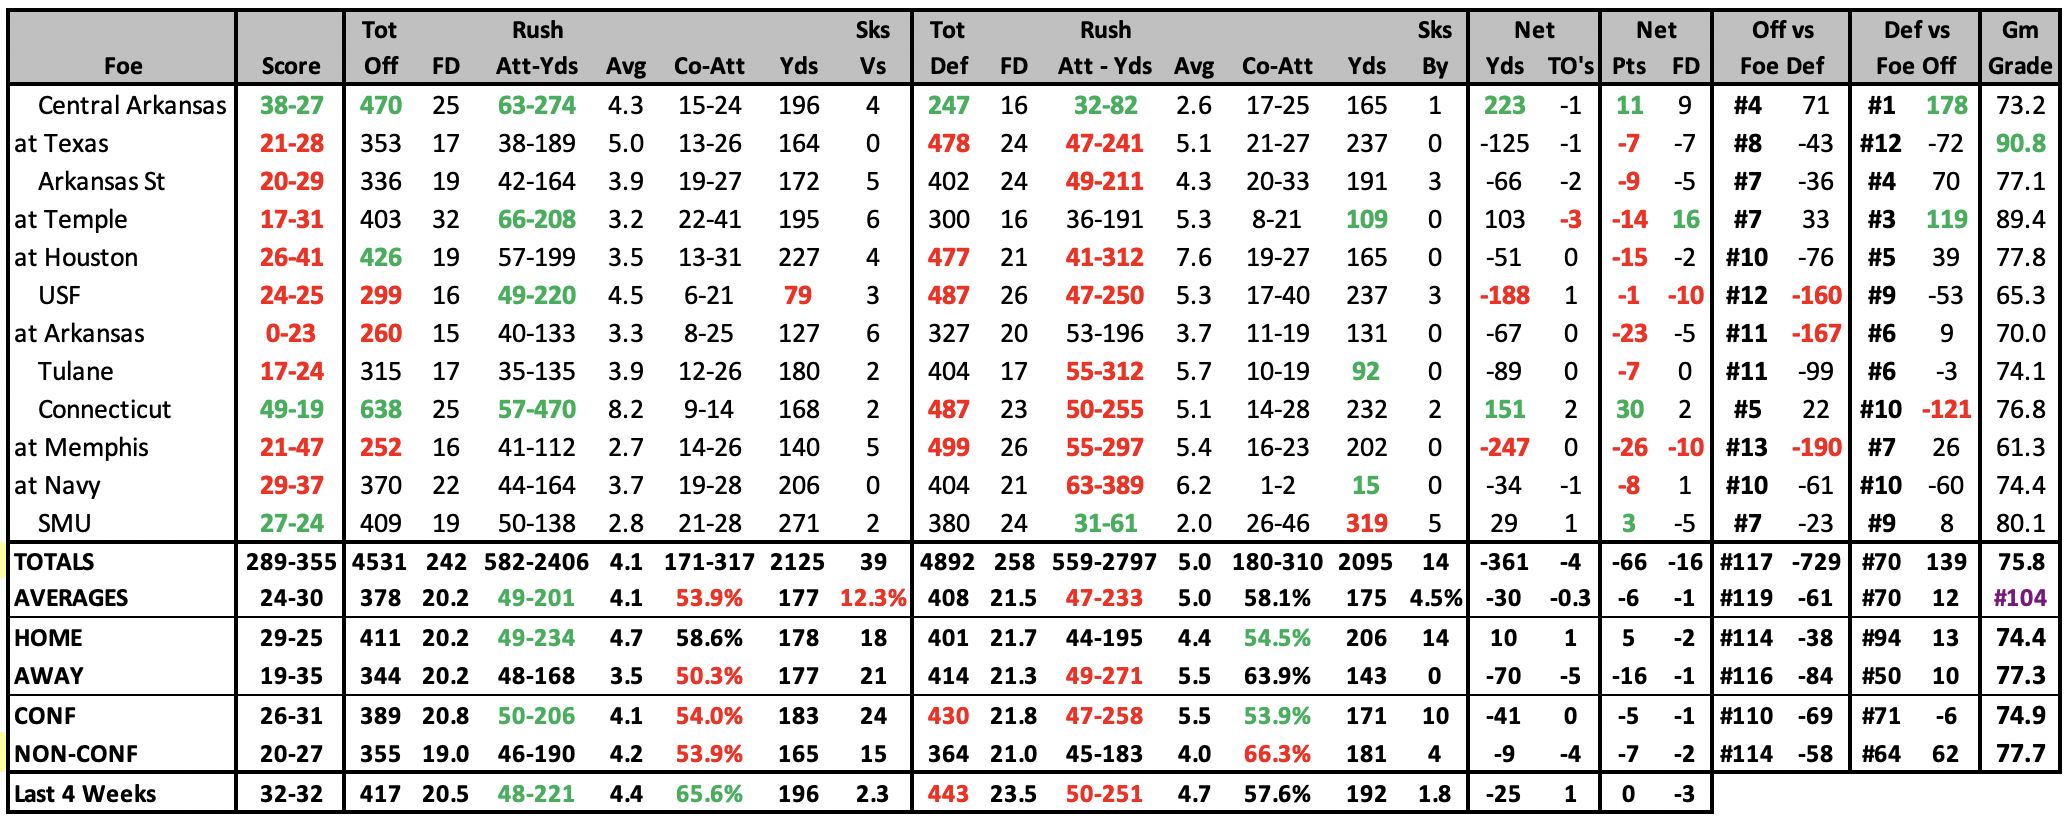
| 2024 GAME BY GAME STATS |
|---|
 |
2024 SCHEDULE |
2023 RESULTS |
||||||||||||||||||||||||||||||||||||||||||||||||||||||||||||||||||||||||||||||||||||||||||||||||||||||||||||||||||||||||||||||||||||||||||||||||||||||||||||||||||||||||||||||||||||||||||||||||
|
|
| 2023 STATISTICAL LEADERS |
|---|
| 2023 GAME BY GAME STATS |
|---|
 |
2023 SCHEDULE |
2022 RESULTS |
||||||||||||||||||||||||||||||||||||||||||||||||||||||||||||||||||||||||||||||||||||||||||||||||||||||||||||||||||||||||||||||||||||||||||||||||||||||||||||||||||||||||||||||||||||||||||||||||
|
|
| 2022 STATISTICAL LEADERS |
|---|
| 2022 GAME BY GAME STATS |
|---|
 |
2022 SCHEDULE |
2021 RESULTS |
||||||||||||||||||||||||||||||||||||||||||||||||||||||||||||||||||||||||||||||||||||||||||||||||||||||||||||||||||||||||||||||||||||||||||||||||||||||||||||||||||||||||||||||||||||||||||||||||
|
|
||||||||||||||||||||||||||||||||||||||||||||||||||||||||||||||||||||||||||||||||||||||||||||||||||||||||||||||||||||||||||||||||||||||||||||||||||||||||||||||||||||||||||||||||||||||||||||||||
| 2021 STATISTICAL LEADERS |
|---|
| 2021 GAME BY GAME STATS |
|---|
 |
2021 SCHEDULE |
2020 RESULTS |
||||||||||||||||||||||||||||||||||||||||||||||||||||||||||||||||||||||||||||||||||||||||||||||||||||||||||||||||||||||||||||||||||||||||||||||||||||||||||||||||||||||||||||||||||||||||||||||||||||||||||||||||||
|
|
||||||||||||||||||||||||||||||||||||||||||||||||||||||||||||||||||||||||||||||||||||||||||||||||||||||||||||||||||||||||||||||||||||||||||||||||||||||||||||||||||||||||||||||||||||||||||||||||||||||||||||||||||
| 2020 STATISTICAL LEADERS |
|---|
| 2020 GAME BY GAME STATS |
|---|
 |
2020 SCHEDULE |
2019 RESULTS |
||||||||||||||||||||||||||||||||||||||||||||||||||||||||||||||||||||||||||||||||||||||||||||||||||||||||||||||||||||||||||||||||||||||||||||||||||||||||||||||||||||||||||||||||||||||||||||||||||||||||||||||||||
|
|
||||||||||||||||||||||||||||||||||||||||||||||||||||||||||||||||||||||||||||||||||||||||||||||||||||||||||||||||||||||||||||||||||||||||||||||||||||||||||||||||||||||||||||||||||||||||||||||||||||||||||||||||||
| 2019 STATISTICAL LEADERS |
|---|
| 2019 GAME BY GAME STATS |
|---|
 |
2019 SCHEDULE |
2018 RESULTS |
|||||||||||||||||||||||||||||||||||||||||||||||||||||||||||||||||||||||||||||||||||||||||||||||||||||||||||||||||||||||||||||||||||||||||||||||||||||||||||||||||||||||||||||||||||||||||||||||||||||||||
|
|
| 2018 STATISTICAL LEADERS |
|---|
| 2018 GAME BY GAME STATS |
|---|
 |
2018 SCHEDULE |
2017 RESULTS |
||||||||||||||||||||||||||||||||||||||||||||||||||||||||||||||||||||||||||||||||||||||||||||||||||||||||||||||||||||||||||||||||||||||||||||||||||||||||||||||||||||||||||||||||||||||||||||||||||||||||||||||||||
|
|
||||||||||||||||||||||||||||||||||||||||||||||||||||||||||||||||||||||||||||||||||||||||||||||||||||||||||||||||||||||||||||||||||||||||||||||||||||||||||||||||||||||||||||||||||||||||||||||||||||||||||||||||||
| 2017 STATISTICAL LEADERS |
|---|
| 2017 GAME BY GAME STATS |
|---|
 |
2017 SCHEDULE |
2016 RESULTS |
||||||||||||||||||||||||||||||||||||||||||||||||||||||||||||||||||||||||||||||||||||||||||||||||||||||||||||||||||||||||||||||||||||||||||||||||||||||||||||||||||||||||||||||||||||||||||||||||||||||||||||||||||||||||||||||||
|
|
||||||||||||||||||||||||||||||||||||||||||||||||||||||||||||||||||||||||||||||||||||||||||||||||||||||||||||||||||||||||||||||||||||||||||||||||||||||||||||||||||||||||||||||||||||||||||||||||||||||||||||||||||||||||||||||||
| 2016 STATISTICAL LEADERS |
|---|
| 2016 GAME BY GAME STATS |
|---|
 |
| 2015 STATISTICAL LEADERS |
|---|
| 2015 GAME BY GAME STATS |
|---|
 |
2015 SCHEDULE |
2014 RESULTS |
|||||||||||||||||||||||||||||||||||||||||||||||||||||||||||||||||||||||||||||||||||||||||||||||||||||||||||||||||||||||||||||||||||||||||||||||||||||||||||||||||||||||||||||||||||||||||||||||||||||||||||||||||||||||||||||||||||||||
|
|
|||||||||||||||||||||||||||||||||||||||||||||||||||||||||||||||||||||||||||||||||||||||||||||||||||||||||||||||||||||||||||||||||||||||||||||||||||||||||||||||||||||||||||||||||||||||||||||||||||||||||||||||||||||||||||||||||||||||
| 2014 STATISTICAL LEADERS |
|---|
| 2014 GAME BY GAME STATS |
|---|
 |
| 2013 STATISTICAL LEADERS |
|---|
| Player | Att | Yds | YPC | TD | Player | Comp | Att | % | Yds | YPA | TD | INT | Rating | Player | Rec | Yds | YPC | TD |
| Trey Watts | 268 | 1329 | 5.0 | 11 | Cody Green | 117 | 211 | 55.5% | 1339 | 6.3 | 7 | 8 | 112.1 | Jordan James | 39 | 471 | 12.1 | 2 |
| Ja'Terian Douglas | 113 | 379 | 3.4 | 2 | Dane Evans | 84 | 195 | 43.1% | 898 | 4.6 | 4 | 10 | 78.3 | Keevan Lucas | 32 | 442 | 13.8 | 1 |
| Keevan Lucas | 12 | 73 | 6.1 | 0 | Joseph Calcagni | 9 | 19 | 47.4% | 60 | 3.2 | 1 | 0 | 91.3 | Trey Watts | 46 | 395 | 8.6 | 1 |
| 2013 GAME BY GAME STATS |
|---|
 |
2013 RESULTS |
2012 RESULTS |
||||||||||||||||||||||||||||||||||||||||||||||||||||||||||||||||||||||||||||||||||||||||||||||||||||||||||||||||||||||||||||||||||||||||||||||||||||||||||||||||||||||||||||||||||||||||||||||||||||||||||||||||||||||||||||||||||||||||||||||||||||||||||||||||||||||||||||||||
|
|
||||||||||||||||||||||||||||||||||||||||||||||||||||||||||||||||||||||||||||||||||||||||||||||||||||||||||||||||||||||||||||||||||||||||||||||||||||||||||||||||||||||||||||||||||||||||||||||||||||||||||||||||||||||||||||||||||||||||||||||||||||||||||||||||||||||||||||||||
| 2012 STATISTICAL LEADERS |
|---|
| Player | Att | Yds | YPC | TD | Player | Comp | Att | % | Yds | YPA | TD | INT | Rating | Player | Rec | Yds | YPC | TD | ||
| Trey Watts | 186 | 1108 | 6.0 | 3 | Cody Green | 228 | 419 | 54.4% | 2592 | 6.2 | 17 | 11 | 114.5 | Keyarris Garrett | 67 | 845 | 12.6 | 9 | ||
| Ja'Terian Douglas | 137 | 936 | 6.8 | 7 | Kalen Henderson | 16 | 46 | 34.8% | 294 | 6.4 | 1 | 2 | 86.9 | Jordan James | 41 | 568 | 13.9 | 2 | ||
| Alex Singleton | 202 | 800 | 4.0 | 24 | Joseph Calcagni | 3 | 4 | 75.0% | 48 | 12.0 | 0 | 0 | 175.8 | Thomas Roberson | 29 | 489 | 16.9 | 4 |
| 2012 Individual Player Stats • 2012 Start Chart/ Starters Lost |
|---|
| 2012 GAME BY GAME STATS |
|---|
 |
| 2011 STATISTICAL LEADERS |
|---|
| Player | Att | Yds | YPC | TD | Player | Comp | Att | % | Yds | YPA | TD | INT | Rating | Player | Rec | Yds | YPC | TD | ||
| Ja'Terian Douglas | 114 | 900 | 7.9 | 4 | GJ Kinne | 245 | 388 | 63.1% | 3072 | 7.9 | 28 | 12 | 147.3 | Willie Carter | 61 | 868 | 14.2 | 7 | ||
| Trey Watts | 157 | 880 | 5.6 | 3 | Kalen Henderson | 8 | 29 | 27.6% | 122 | 4.2 | 3 | 4 | 69.5 | Bryan Burnham | 54 | 849 | 15.7 | 9 | ||
| GJ Kinne | 125 | 404 | 3.2 | 3 | Clay Sears | 1 | 1 | 100.0% | 21 | 21.0 | 0 | 0 | 276.4 | Clay Sears | 37 | 469 | 12.7 | 7 |
| 2011 Individual Player Stats • 2011 Start Chart/ Starters Lost |
|---|
| 2011 GAME BY GAME STATS |
|---|
2011 RESULTS |
2010 RESULTS |
|||||||||||||||||||||||||||||||||||||||||||||||||||||||||||||||||||||||||||||||||||||||||||||||||||||||||||||||||||||||||||||||||||||||||||||||||||||||||||||||||||||||||||||||
|
|
|||||||||||||||||||||||||||||||||||||||||||||||||||||||||||||||||||||||||||||||||||||||||||||||||||||||||||||||||||||||||||||||||||||||||||||||||||||||||||||||||||||||||||||||
| 2010 STATISTICAL LEADERS |
|---|
| Player | Att | Yds | YPC | TD | Player | Comp | Att | % | Yds | YPA | TD | INT | Rating | Player | Rec | Yds | YPC | TD | ||
| GJ Kinne | 158 | 561 | 3.55 | 7 | GJ Kinne | 275 | 460 | 59.8% | 3650 | 7.9 | 31 | 11 | 143.9 | Damaris Johnson | 57 | 872 | 15.3 | 4 | ||
| Damaris Johnson | 55 | 560 | 10.18 | 7 | Shavodrick Beaver | 4 | 6 | 66.7% | 62 | 10.3 | 0 | 1 | 120.1 | Charles Clay | 43 | 526 | 12.2 | 7 | ||
| Alex Singleton | 87 | 399 | 4.59 | 11 | Genesis Cole | 1 | 2 | 50.0% | 41 | 20.5 | 1 | 0 | 387.2 | Trae Johnson | 30 | 498 | 16.6 | 3 |
| 2010 Individual Player Stats |
|---|
| 2010 GAME BY GAME STATS |
|---|
| 2009 STATISTICAL LEADERS |
|---|
| Player | Att | Yds | YPC | TD | Player | Comp | Att | % | Yds | YPA | TD | INT | Rating | Player | Rec | Yds | YPC | TD | ||
| GJ Kinne | 151 | 393 | 2.60 | 4 | GJ Kinne | 210 | 345 | 60.9% | 2732 | 7.9 | 22 | 10 | 142.6 | Damaris Johnson | 78 | 1131 | 14.5 | 3 | ||
| Jamad Williams | 101 | 389 | 3.85 | 1 | Jacob Bower | 15 | 36 | 41.7% | 289 | 8.0 | 2 | 0 | 127.4 | Charles Clay | 39 | 530 | 13.6 | 5 | ||
| Charles Clay | 63 | 236 | 3.75 | 7 | AJ Whitmore | 2 | 3 | 66.7% | 85 | 28.3 | 1 | 0 | 414.7 | Slick Shelley | 29 | 511 | 17.6 | 4 |
| 2009 Individual Player Stats |
|---|
| 2009 GAME BY GAME STATS |
|---|
2009 RESULTS |
2008 RESULTS |
||||||||||||||||||||||||||||||||||||||||||||||||||||||||||||||||||||||||||||||||||||||||||||||||||||||||||||||||||||||||||||||||||||||||||||||||||||||||||||||||
|
|
||||||||||||||||||||||||||||||||||||||||||||||||||||||||||||||||||||||||||||||||||||||||||||||||||||||||||||||||||||||||||||||||||||||||||||||||||||||||||||||||
| 2008 Individual Player Stats • 2007 Individual Player Stats |
|---|