
UAB BLAZERS |
|
STADIUM: Protective Stadium PLAYING SURFACE: SureTurf • CAPACITY: 47,100 STARTERS RETURNING (O/D): 4*/4 LETTERMAN RETURNING: 28 (12,13,3) • LETTERMAN LOST: 38 (19,18,1) |
 |
|
| LOCATION: Birmingham, AL | |
| FOUNDED: 1969 | |
| ENROLLMENT: 13,547 | |
| COLORS: Forest Green & Old Gold |
|
| MASCOT: Blaze the Dragon | |
| CONFERENCE: AAC | |
HEAD COACH: Alex Mortensen |
|
| YEARS WITH TM: 1st | |
| OVERALL RECORD: 0-0 | |
| RECORD WITH TM: 0-0 |
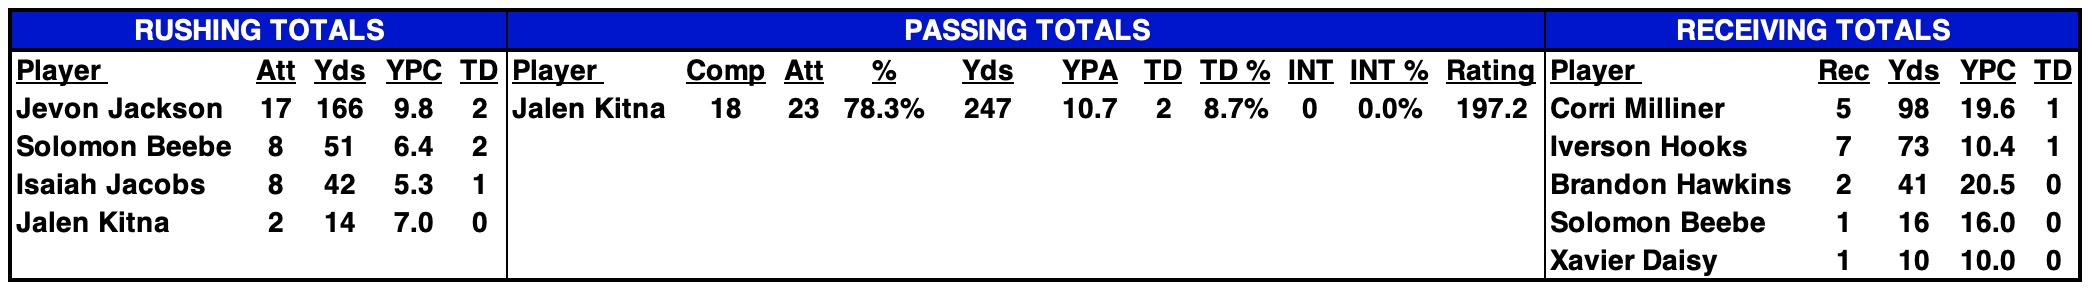
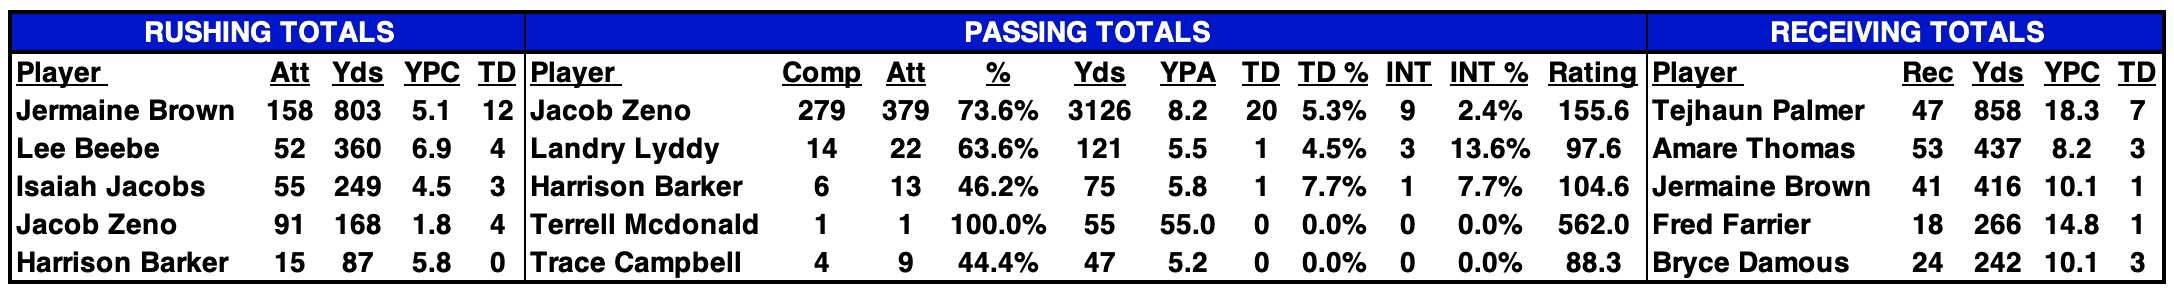
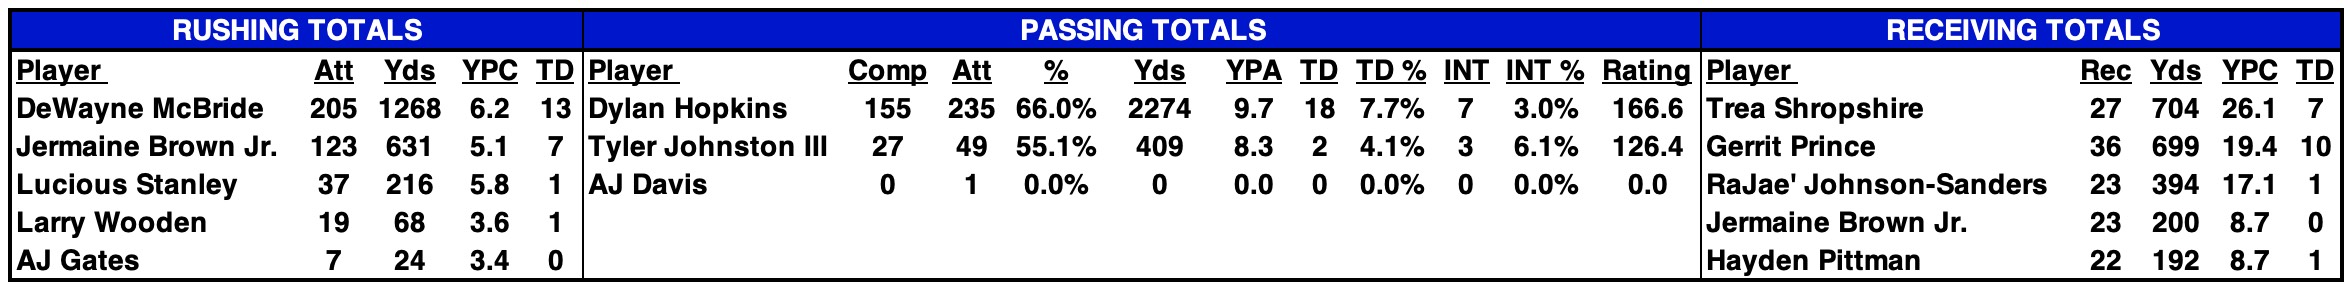
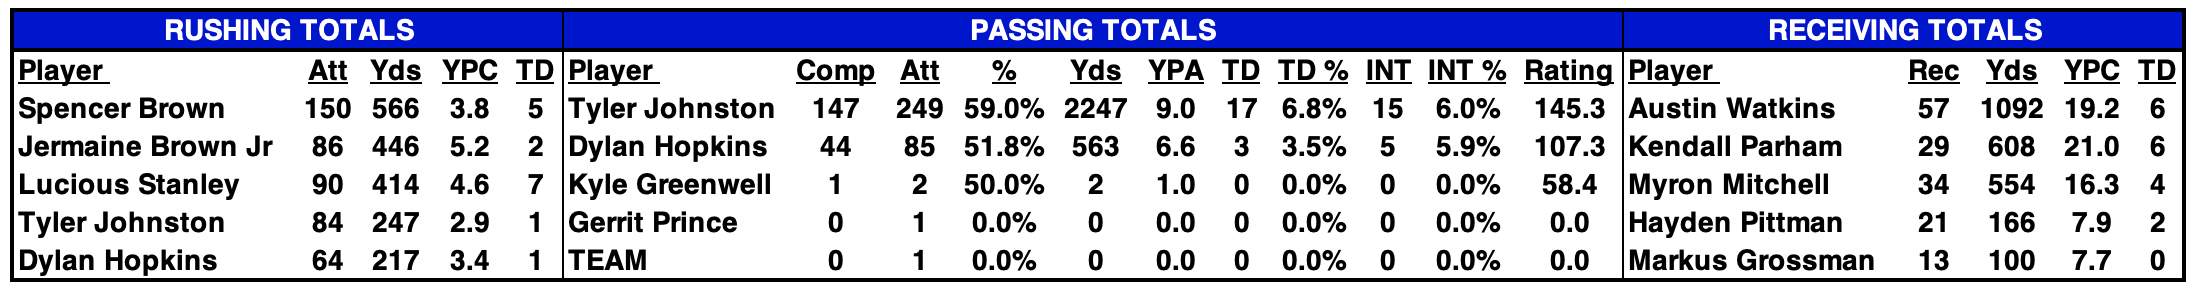
2025 STATISTICAL LEADERS |
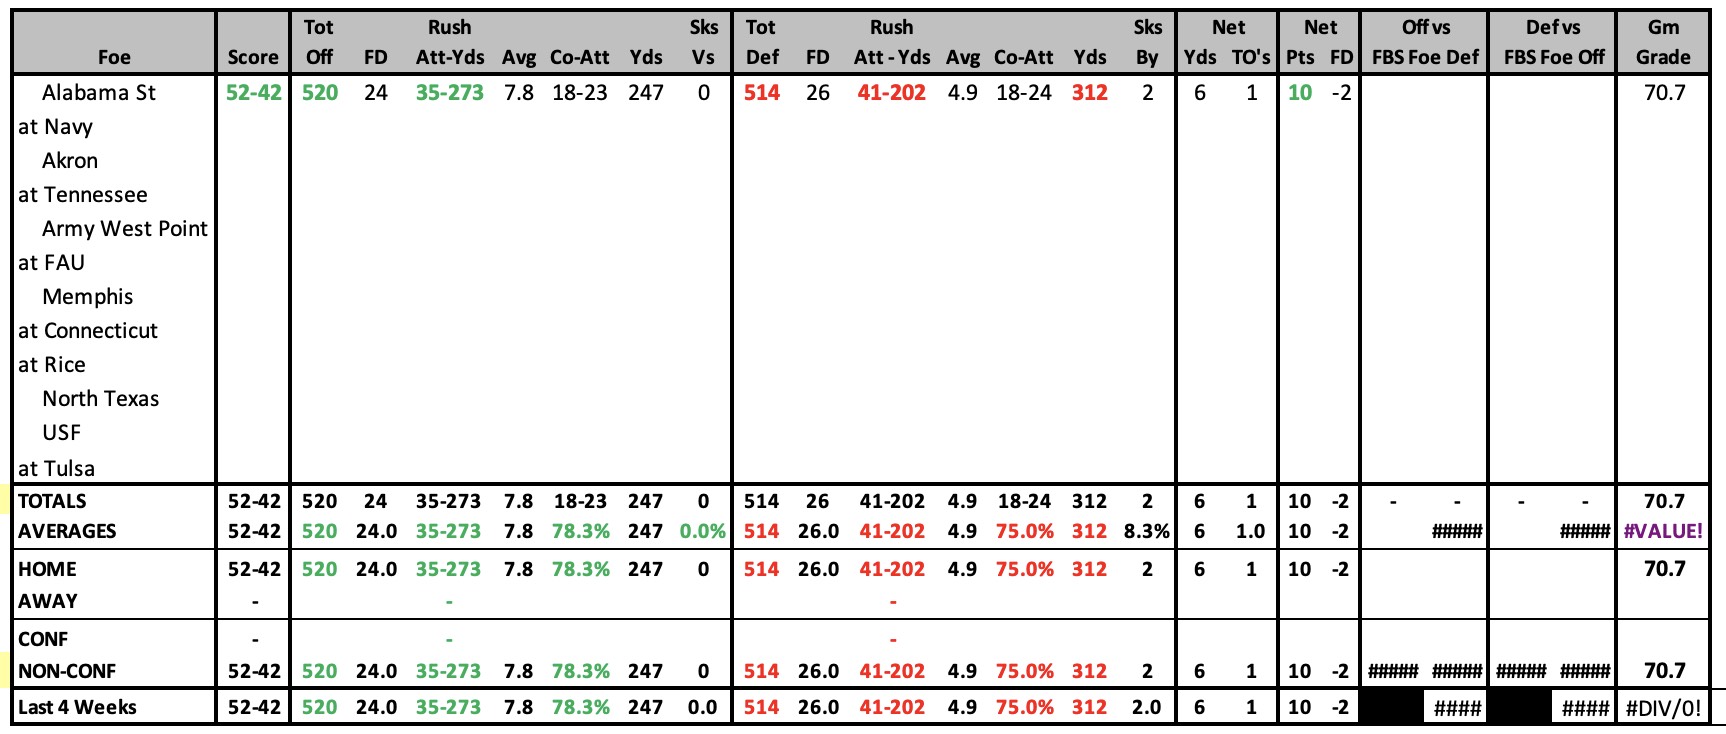
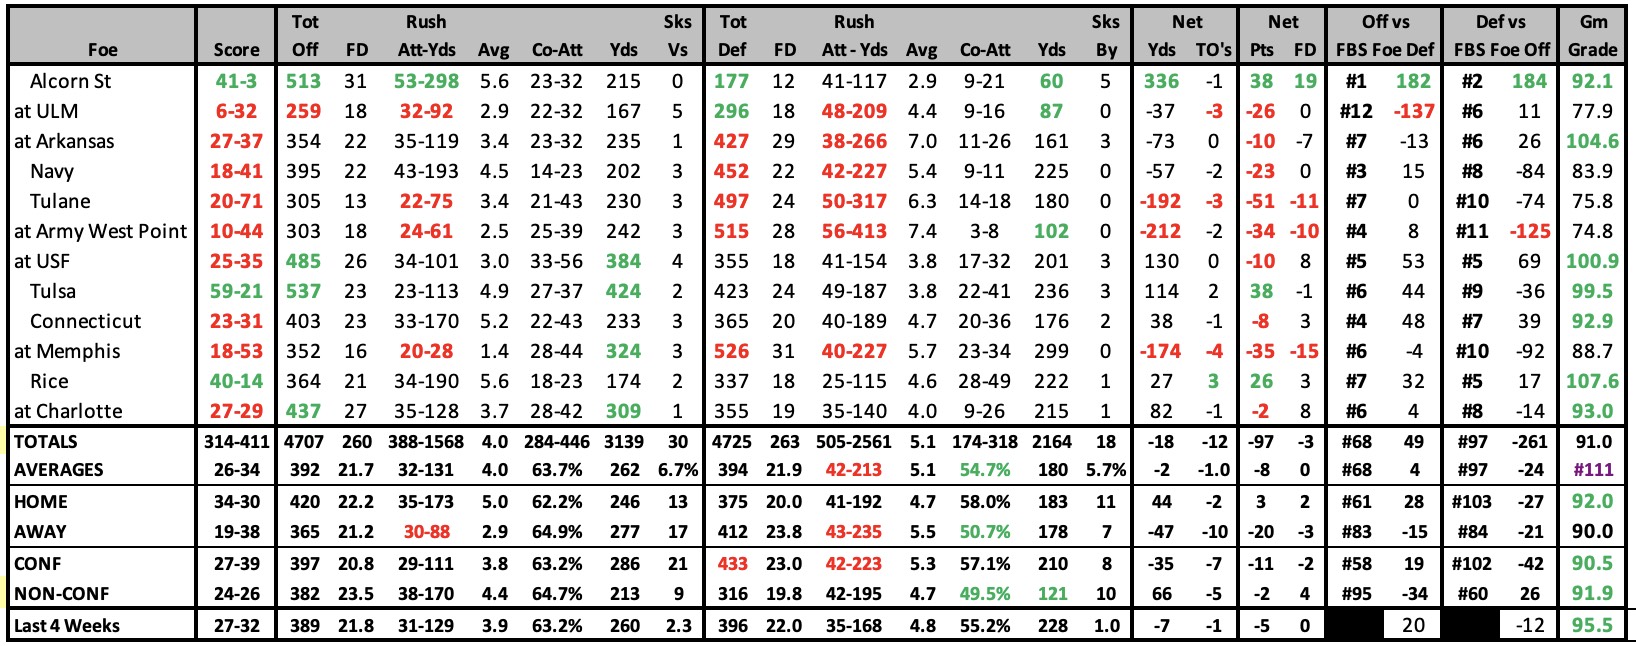
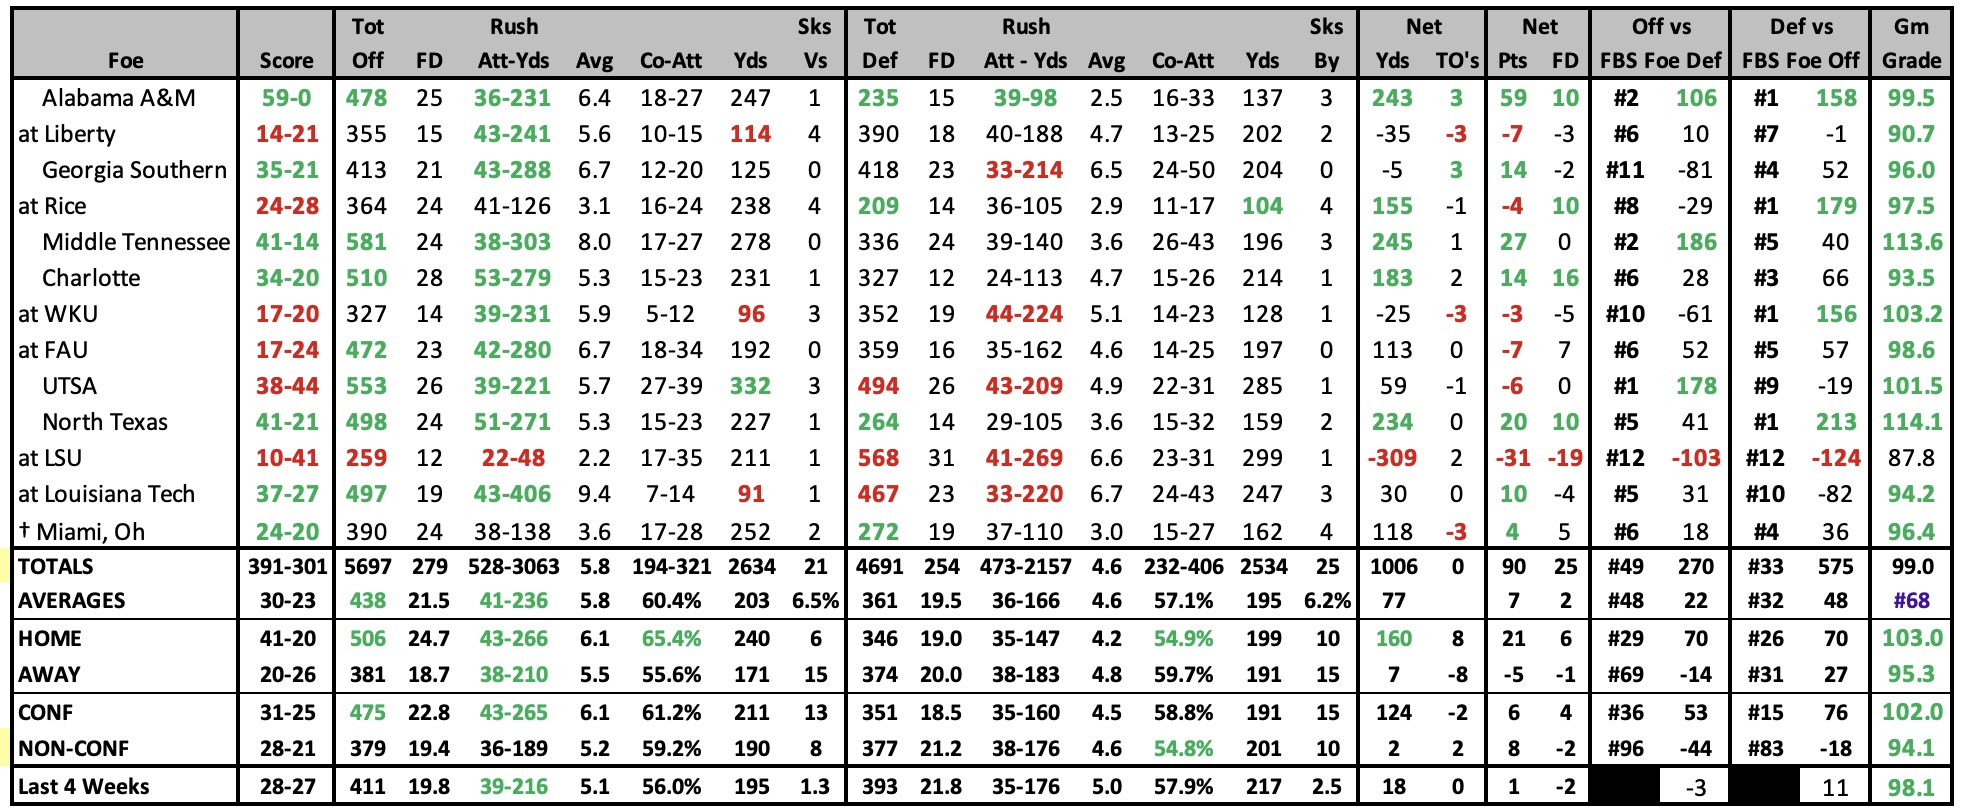
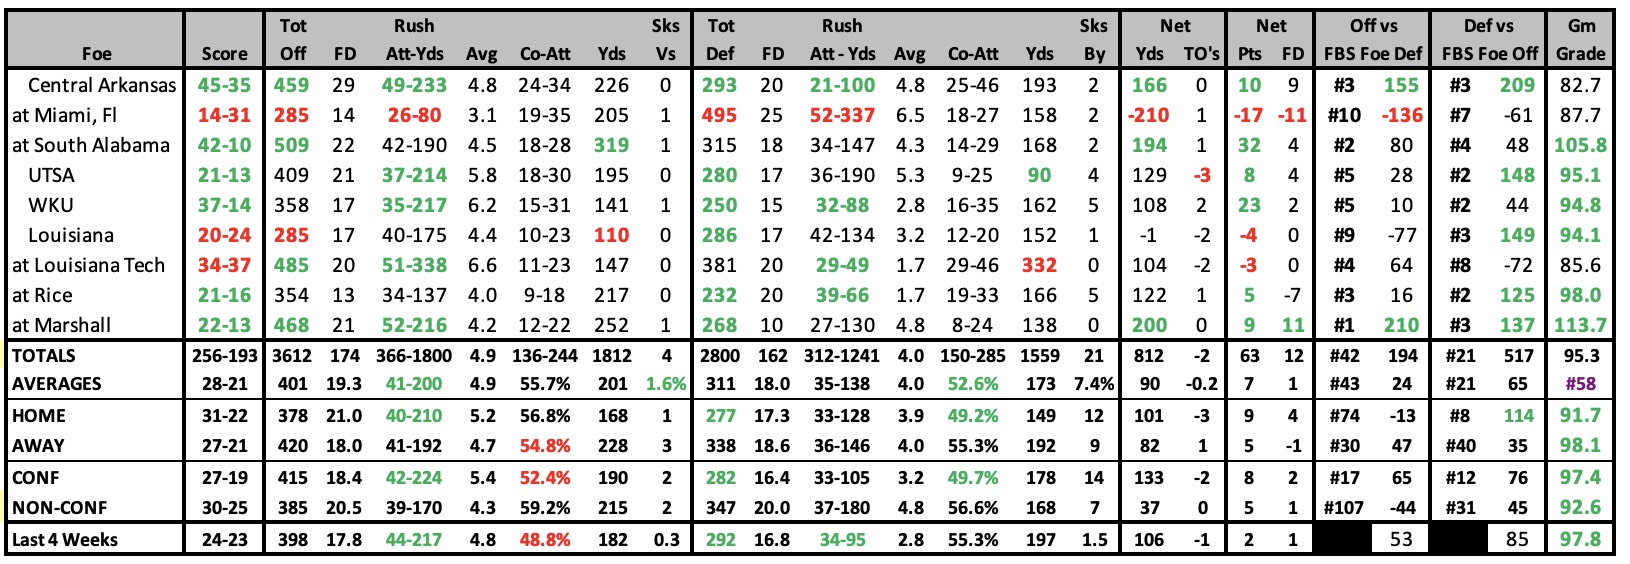
2025 GAME BY GAME STATS |
 |
2025 SCHEDULE |
2024 RESULTS |
||||||||||||||||||||||||||||||||||||||||||||||||||||||||||||||||||||||||||||||||||||||||||||||||||||||||||||||||||||||||||||||||||||||||||||||||||||||||||||||||||||||||||||||||||||||||||||||||
|
|
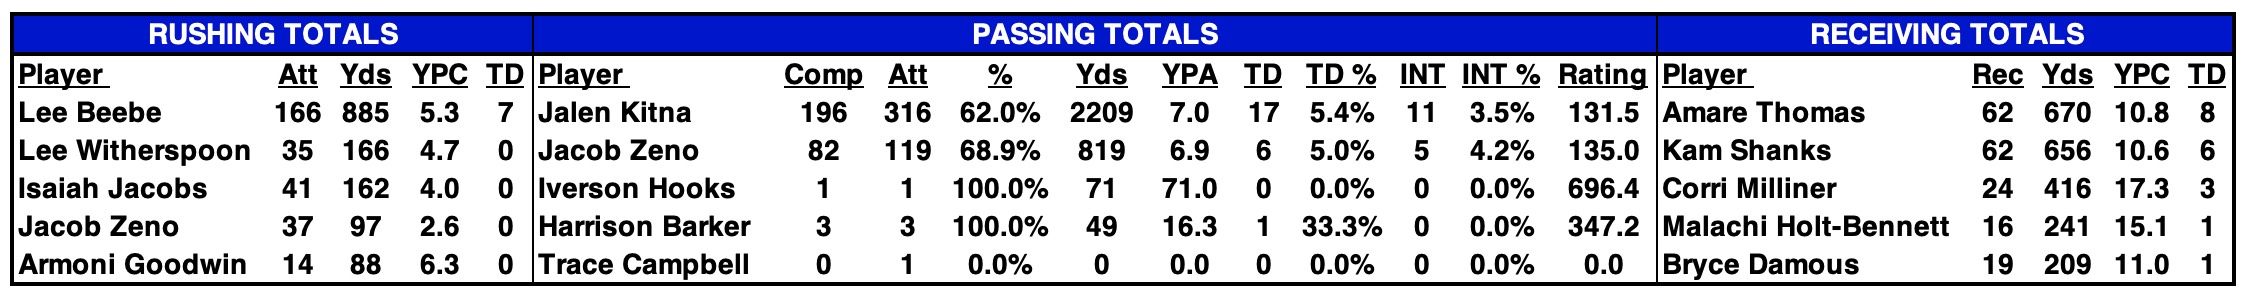
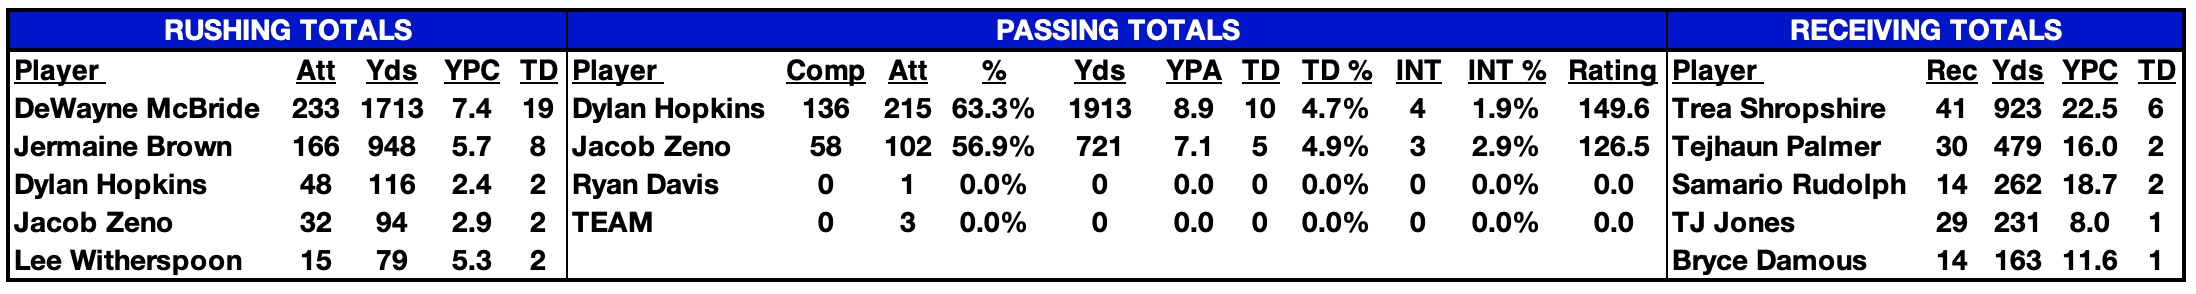
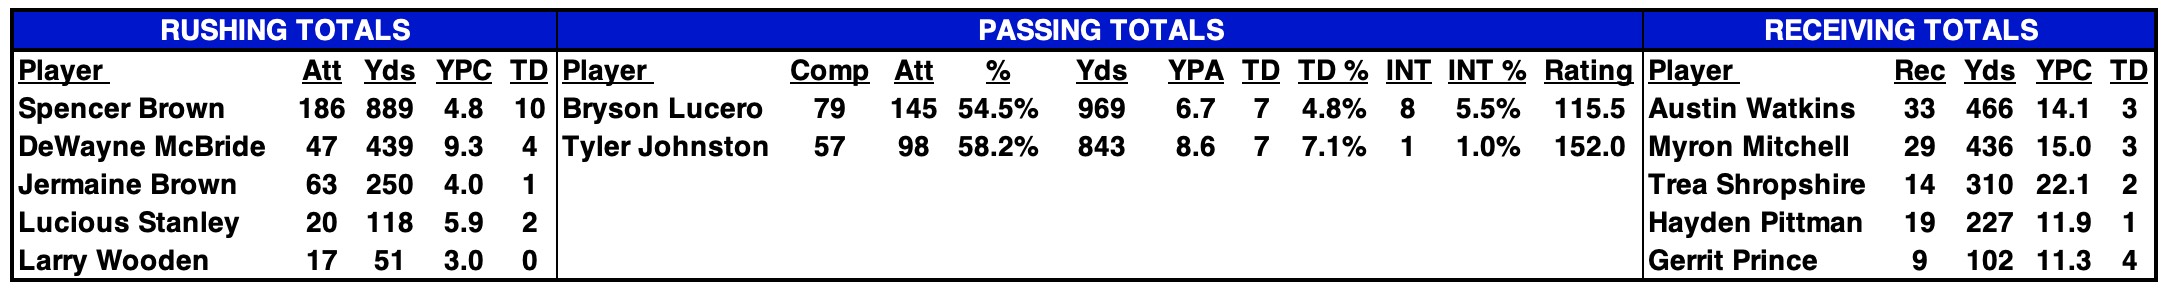
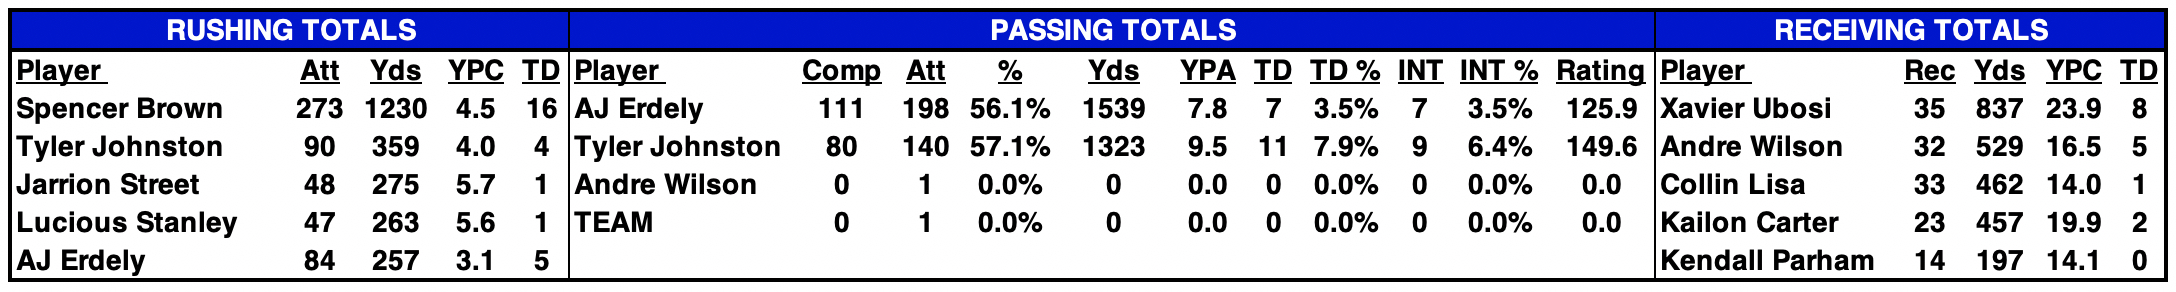
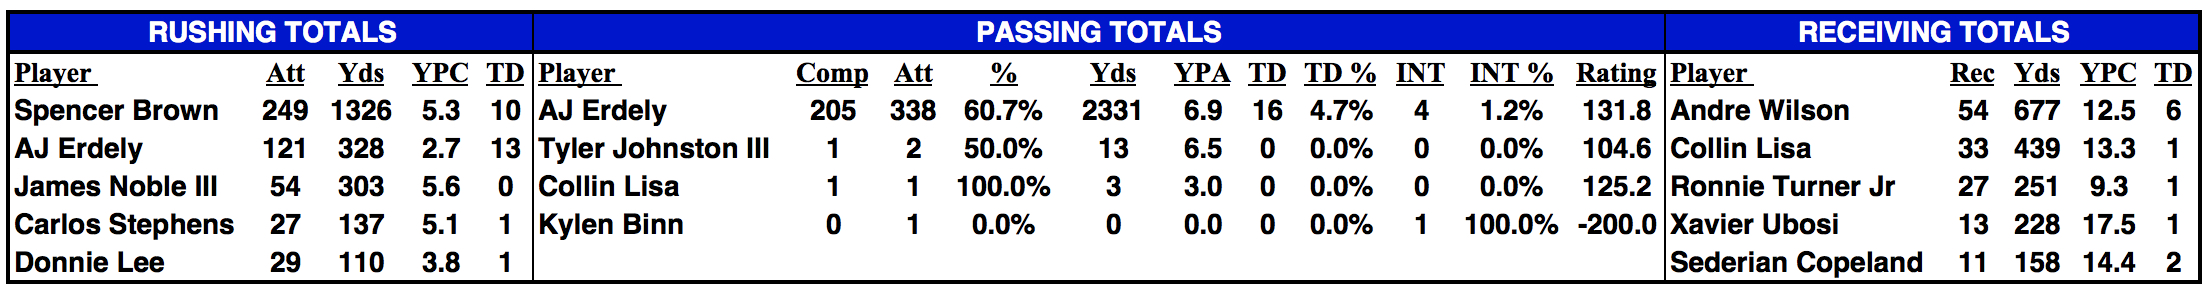
2024 STATISTICAL LEADERS |
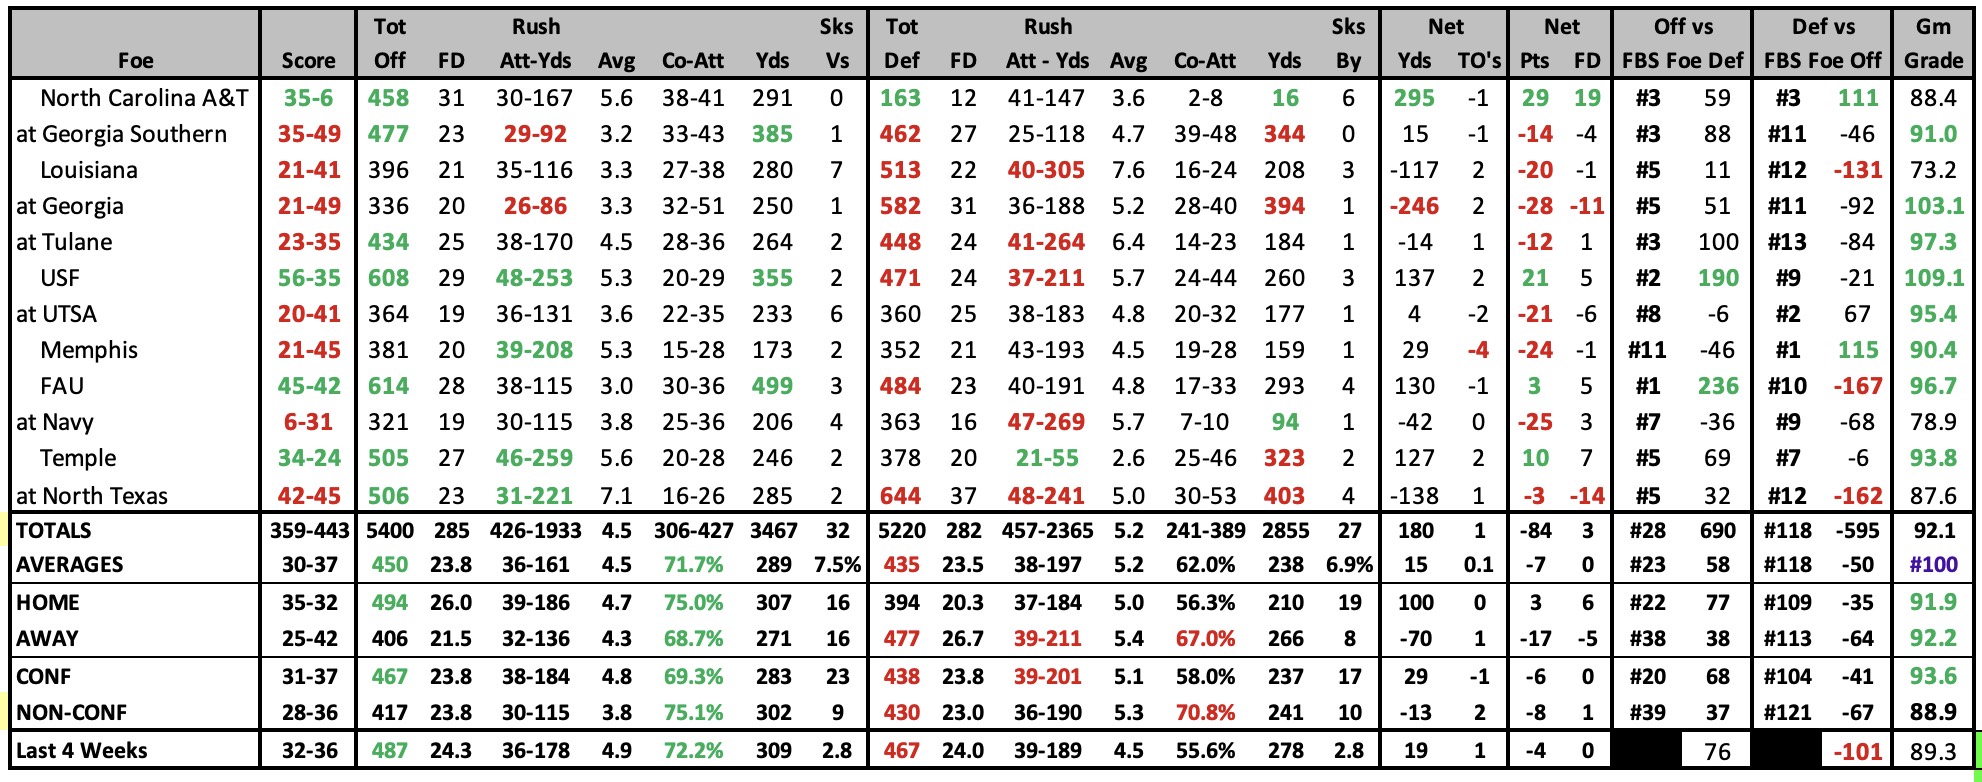
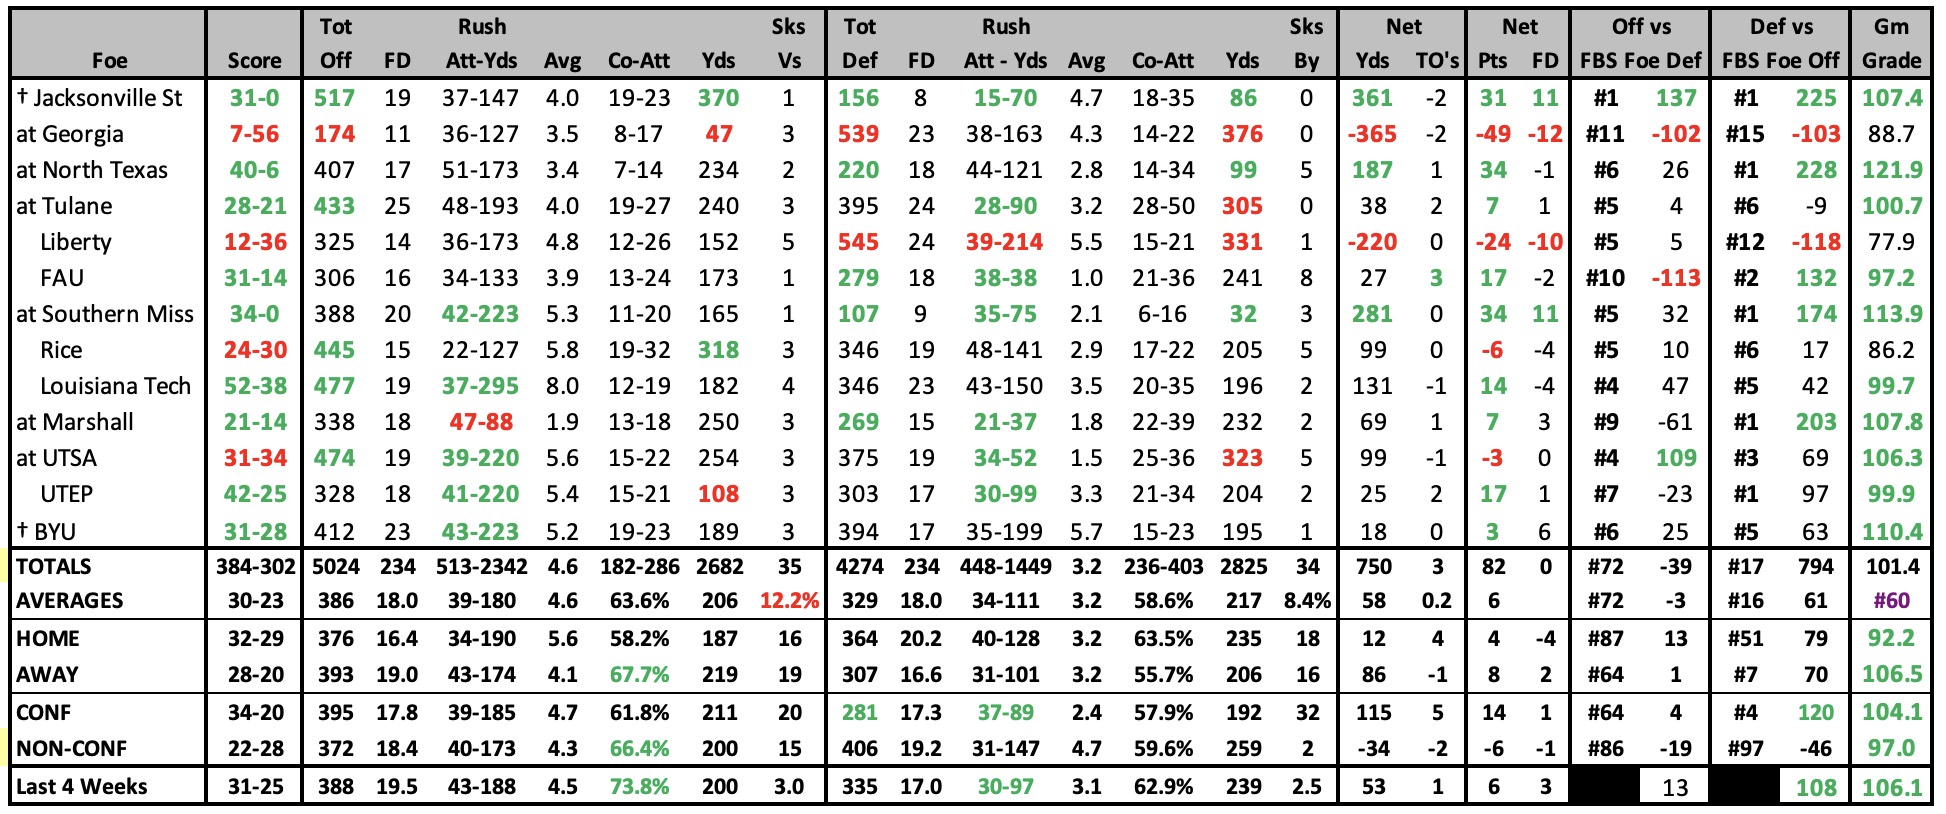
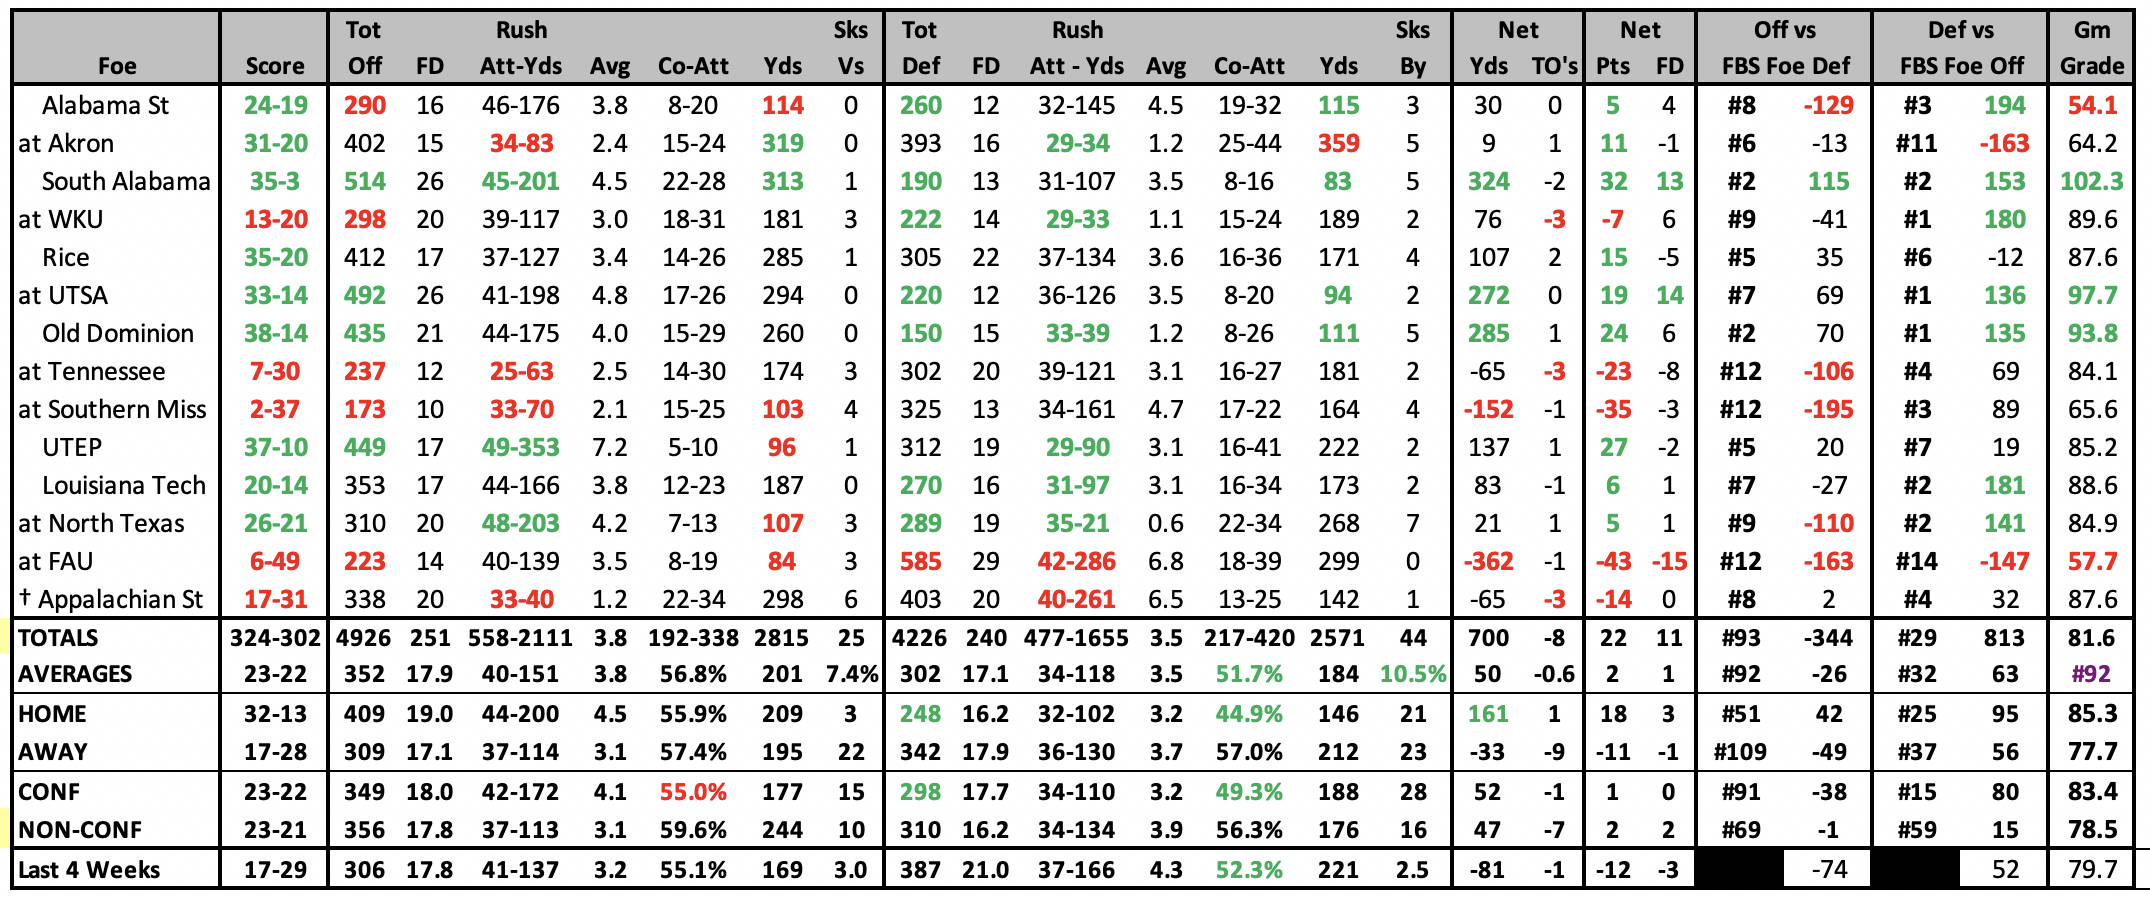
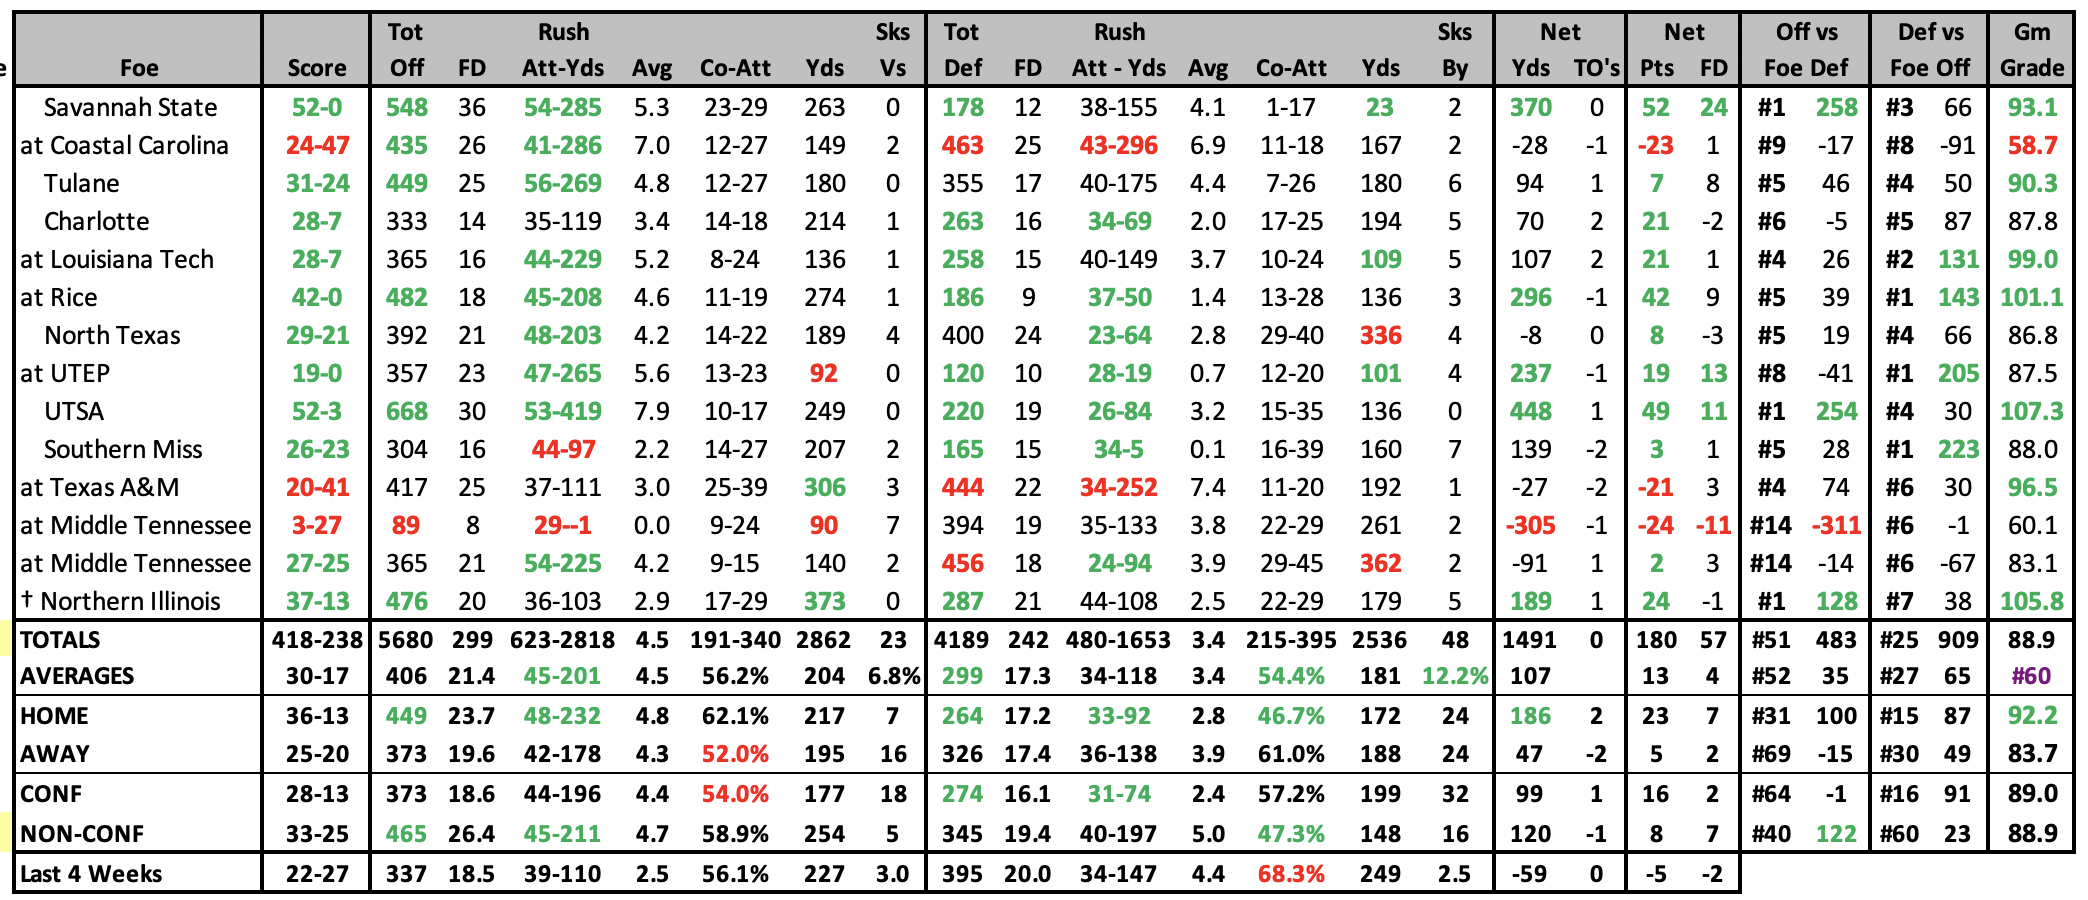
2024 GAME BY GAME STATS |
 |
2024 SCHEDULE |
2023 RESULTS |
||||||||||||||||||||||||||||||||||||||||||||||||||||||||||||||||||||||||||||||||||||||||||||||||||||||||||||||||||||||||||||||||||||||||||||||||||||||||||||||||||||||||||||||||||||||||||||||||
|
|
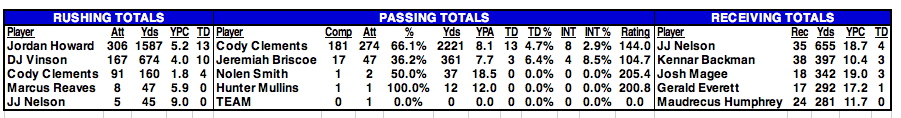
2023 STATISTICAL LEADERS |
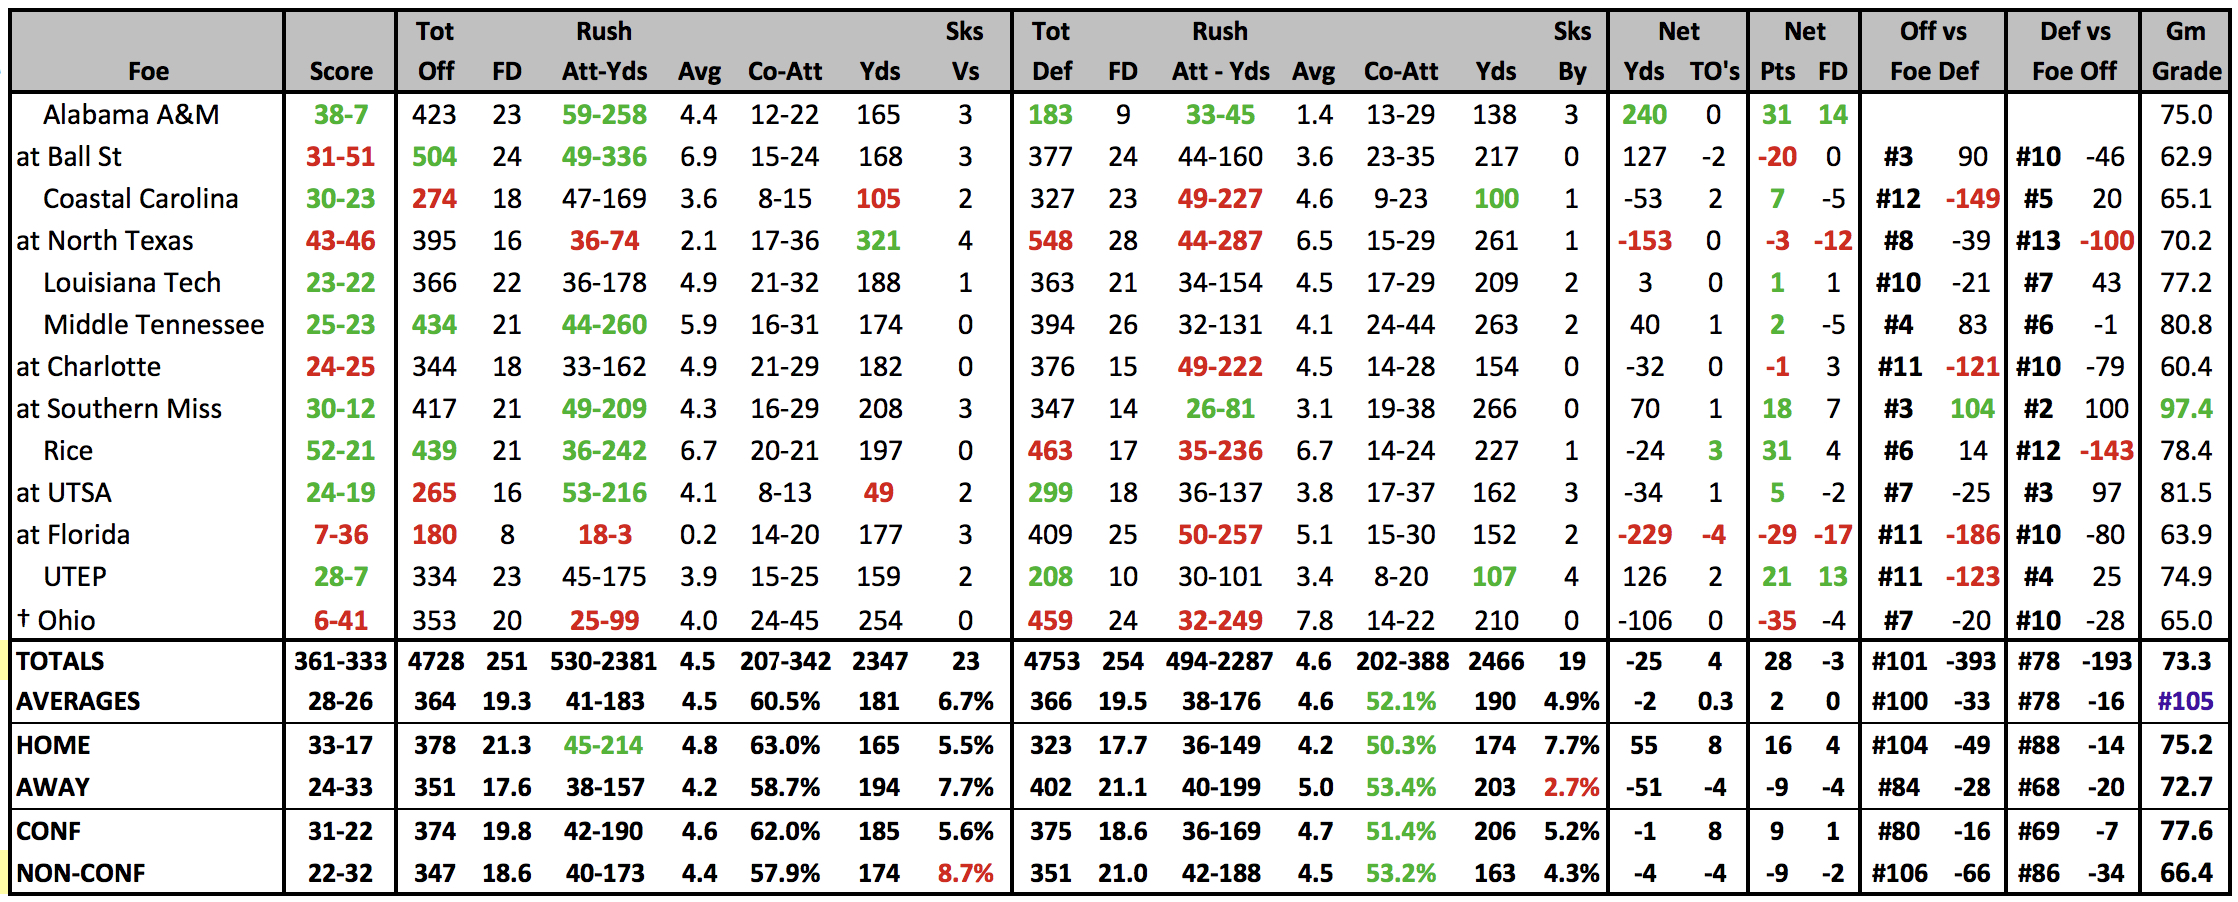
2023 GAME BY GAME STATS |
 |
2023 SCHEDULE |
2022 RESULTS |
||||||||||||||||||||||||||||||||||||||||||||||||||||||||||||||||||||||||||||||||||||||||||||||||||||||||||||||||||||||||||||||||||||||||||||||||||||||||||||||||||||||||||||||||||||||||||||||||||||||
|
|
||||||||||||||||||||||||||||||||||||||||||||||||||||||||||||||||||||||||||||||||||||||||||||||||||||||||||||||||||||||||||||||||||||||||||||||||||||||||||||||||||||||||||||||||||||||||||||||||||||||
2022 STATISTICAL LEADERS |
2022 GAME BY GAME STATS |
 |
2022 SCHEDULE |
2021 RESULTS |
||||||||||||||||||||||||||||||||||||||||||||||||||||||||||||||||||||||||||||||||||||||||||||||||||||||||||||||||||||||||||||||||||||||||||||||||||||||||||||||||||||||||||||||||||||||||||||||||||||||
|
|
||||||||||||||||||||||||||||||||||||||||||||||||||||||||||||||||||||||||||||||||||||||||||||||||||||||||||||||||||||||||||||||||||||||||||||||||||||||||||||||||||||||||||||||||||||||||||||||||||||||
2021 STATISTICAL LEADERS |
2021 GAME BY GAME STATS |
 |
2021 SCHEDULE |
2020 RESULTS |
||||||||||||||||||||||||||||||||||||||||||||||||||||||||||||||||||||||||||||||||||||||||||||||||||||||||||||||||||||||||||||||||||||||||||||||||||||||||||||||||||||||||||||||||||||||||||||||||||||||||||||
|
|
||||||||||||||||||||||||||||||||||||||||||||||||||||||||||||||||||||||||||||||||||||||||||||||||||||||||||||||||||||||||||||||||||||||||||||||||||||||||||||||||||||||||||||||||||||||||||||||||||||||||||||
2020 STATISTICAL LEADERS |
2020 GAME BY GAME STATS |
 |
2020 SCHEDULE |
2019 RESULTS |
||||||||||||||||||||||||||||||||||||||||||||||||||||||||||||||||||||||||||||||||||||||||||||||||||||||||||||||||||||||||||||||||||||||||||||||||||||||||||||||||||||||||||||||||||||||||||||||||||||||||||||||||||||||||||||||
|
|
||||||||||||||||||||||||||||||||||||||||||||||||||||||||||||||||||||||||||||||||||||||||||||||||||||||||||||||||||||||||||||||||||||||||||||||||||||||||||||||||||||||||||||||||||||||||||||||||||||||||||||||||||||||||||||||
2019 STATISTICAL LEADERS |
2019 GAME BY GAME STATS |
 |
2019 SCHEDULE |
2018 RESULTS |
||||||||||||||||||||||||||||||||||||||||||||||||||||||||||||||||||||||||||||||||||||||||||||||||||||||||||||||||||||||||||||||||||||||||||||||||||||||||||||||||||||||||||||||||||||||||||||||||||||||||||||||||||||||||||||||||||||||||||||||||
|
|
||||||||||||||||||||||||||||||||||||||||||||||||||||||||||||||||||||||||||||||||||||||||||||||||||||||||||||||||||||||||||||||||||||||||||||||||||||||||||||||||||||||||||||||||||||||||||||||||||||||||||||||||||||||||||||||||||||||||||||||||
2018 STATISTICAL LEADERS |
2018 GAME BY GAME STATS |
 |
2018 SCHEDULE |
2017 RESULTS |
||||||||||||||||||||||||||||||||||||||||||||||||||||||||||||||||||||||||||||||||||||||||||||||||||||||||||||||||||||||||||||||||||||||||||||||||||||||||||||||||||||||||||||||||||||||||||||||||||||||||||||||||||||||||||||||||||||||||||||||
|
|
||||||||||||||||||||||||||||||||||||||||||||||||||||||||||||||||||||||||||||||||||||||||||||||||||||||||||||||||||||||||||||||||||||||||||||||||||||||||||||||||||||||||||||||||||||||||||||||||||||||||||||||||||||||||||||||||||||||||||||||
2017 STATISTICAL LEADERS |
2017 GAME BY GAME STATS |
 |
2017 SCHEDULE |
2014 RESULTS |
|||||||||||||||||||||||||||||||||||||||||||||||||||||||||||||||||||||||||||||||||||||||||||||||||||||||||||||||||||||||||||||||||||||||||||||||||||||||||||||||||||||||||||||||||||||||||||||||||||||||||||||||||||||||||||||||||||||||
|
|
|||||||||||||||||||||||||||||||||||||||||||||||||||||||||||||||||||||||||||||||||||||||||||||||||||||||||||||||||||||||||||||||||||||||||||||||||||||||||||||||||||||||||||||||||||||||||||||||||||||||||||||||||||||||||||||||||||||||
2014 STATISTICAL LEADERS |
2014 GAME BY GAME STATS |
 |
2014 SCHEDULE |
2013 RESULTS |
||||||||||||||||||||||||||||||||||||||||||||||||||||||||||||||||||||||||||||||||||||||||||||||||||||||||||||||||||||||||||||||||||||||||||||||||||||||||||||||||||||||||||||||||||||||||||||||||||||||||||||||||||||||||||||||||||||||||||||||
|
|
||||||||||||||||||||||||||||||||||||||||||||||||||||||||||||||||||||||||||||||||||||||||||||||||||||||||||||||||||||||||||||||||||||||||||||||||||||||||||||||||||||||||||||||||||||||||||||||||||||||||||||||||||||||||||||||||||||||||||||||
2013 STATISTICAL LEADERS |
| Player | Att | Yds | YPC | TD | Player | Comp | Att | % | Yds | YPA | TD | INT | Rating | Player | Rec | Yds | YPC | TD |
| Darrin Reaves | 202 | 934 | 4.6 | 12 | Jonathan Perry | 92 | 174 | 52.9% | 1379 | 7.9 | 10 | 6 | 131.5 | Jamarcus Nelson | 42 | 846 | 20.1 | 8 |
| Jordan Howard | 145 | 881 | 6.1 | 2 | Austin Brown | 93 | 178 | 52.2% | 1199 | 6.7 | 9 | 3 | 122.1 | Jamari Staples | 31 | 458 | 14.8 | 4 |
| Jonathan Perry | 61 | 285 | 4.7 | 2 | Team | 0 | 1 | 0.0% | 0 | 0.0 | 0 | 0 | 0.0 | Kennard Backman | 28 | 302 | 10.8 | 2 |
2013 GAME BY GAME STATS |
 |
2012 RESULTS |
2011 RESULTS |
||||||||||||||||||||||||||||||||||||||||||||||||||||||||||||||||||||||||||||||||||||||||||||||||||||||||||||||||||||||||||||||||||||||||||||||||||||||||||||||||||||||||||||||||||||||||||||||||||||||||||||||||||||||||||||||||||||||||||||||||||
|
|
||||||||||||||||||||||||||||||||||||||||||||||||||||||||||||||||||||||||||||||||||||||||||||||||||||||||||||||||||||||||||||||||||||||||||||||||||||||||||||||||||||||||||||||||||||||||||||||||||||||||||||||||||||||||||||||||||||||||||||||||||
2012 STATISTICAL LEADERS |
| Player | Att | Yds | YPC | TD | Player | Comp | Att | % | Yds | YPA | TD | INT | Rating | Player | Rec | Yds | YPC | TD | ||
| Darrin Reaves | 215 | 1037 | 4.8 | 13 | Austin Brown | 205 | 355 | 57.7% | 2673 | 7.5 | 15 | 12 | 128.2 | Jacki Williams | 52 | 799 | 15.4 | 1 | ||
| Bashr Coles | 39 | 262 | 6.7 | 1 | Jonathon Perry | 74 | 122 | 60.7% | 1033 | 8.5 | 6 | 1 | 146.4 | Nick Adams | 45 | 656 | 14.6 | 2 | ||
| Greg Franklin | 36 | 180 | 5.0 | 2 | Team | 0 | 1 | 0.0% | 0 | 0.0 | 0 | 0 | 0.0 | Patrick Hearn | 42 | 628 | 15.0 | 3 |
| 2012 Individual Player Stats • 2012 Start Chart/Starters Lost |
|---|
2012 GAME BY GAME STATS |
 |
2011 STATISTICAL LEADERS |
| Player | Att | Yds | YPC | TD | Player | Comp | Att | % | Yds | YPA | TD | INT | Rating | Player | Rec | Yds | YPC | TD | ||
| Greg Franklin | 84 | 430 | 5.1 | 2 | Johnathan Perry | 174 | 300 | 58.0% | 2042 | 6.8 | 10 | 8 | 120.8 | Jackie Williams | 58 | 607 | 10.5 | 0 | ||
| Darrin Reaves | 79 | 372 | 4.7 | 2 | Bryan Ellis | 67 | 127 | 52.8% | 743 | 5.9 | 2 | 5 | 99.2 | Nick Adams | 29 | 390 | 13.4 | 1 | ||
| Jonathan Perry | 93 | 290 | 3.1 | 3 | Joe Bento | 5 | 13 | 38.5% | 30 | 2.3 | 0 | 2 | 27.1 | Patrick Hearn | 31 | 364 | 11.7 | 2 |
| 2011 Individual Player Stats • 2011 Start Chart/ Starters Lost |
|---|
2011 GAME BY GAME STATS |
2010 RESULTS |
||||||||||||||||||||||||||||||||||||||||||||||||||||||||||||||||||
|
||||||||||||||||||||||||||||||||||||||||||||||||||||||||||||||||||
2010 STATISTICAL LEADERS |
| Player | Att | Yds | YPC | TD | Player | Comp | Att | % | Yds | YPA | TD | INT | Rating | Player | Rec | Yds | YPC | TD | ||
| Pat Shed | 157 | 847 | 5.39 | 3 | Bryan Ellis | 230 | 410 | 56.1% | 2937 | 7.2 | 25 | 12 | 130.5 | Frantrell Forrest | 38 | 555 | 14.6 | 4 | ||
| David Isabelle | 73 | 396 | 5.42 | 4 | David Isabelle | 23 | 50 | 46.0% | 264 | 5.3 | 3 | 2 | 102.2 | Patrick Hearn | 35 | 536 | 15.3 | 4 | ||
| Daniel Borne | 76 | 321 | 4.22 | 4 | Mike Jones | 0 | 1 | 0.0% | 0 | 0.0 | 0 | 0 | 0.0 | Mike Jones | 38 | 531 | 14.0 | 7 |
| 2010 Individual Player Stats |
|---|
2010 GAME BY GAME STATS |
2009 STATISTICAL LEADERS |
| Player | Att | Yds | YPC | TD | Player | Comp | Att | % | Yds | YPA | TD | INT | Rating | Player | Rec | Yds | YPC | TD | ||
| Joe Webb | 226 | 1424 | 6.30 | 11 | Joe Webb | 162 | 271 | 59.8% | 2299 | 8.5 | 21 | 8 | 150.7 | Frantrell Forrest | 34 | 558 | 16.4 | 9 | ||
| David Isabelle | 32 | 288 | 9.00 | 1 | David Isabelle | 6 | 11 | 54.5% | 39 | 3.5 | 1 | 0 | 114.3 | Jeffery Anderson | 26 | 398 | 15.3 | 5 | ||
| R Slaughter | 44 | 250 | 5.68 | 1 | Bryan Ellis | 1 | 4 | 25.0% | 14 | 3.5 | 0 | 0 | 54.4 | Mark Ferrell | 23 | 320 | 13.9 | 1 |
| 2009 Individual Player Stats |
|---|
2009 GAME BY GAME STATS |
2009 RESULTS |
2008 RESULTS |
|||||||||||||||||||||||||||||||||||||||||||||||||||||||||||||||||||||||||||||||||||||||||||||||||||||||||||||||||||||||||||||||||||||||||||||||||
|
|
|||||||||||||||||||||||||||||||||||||||||||||||||||||||||||||||||||||||||||||||||||||||||||||||||||||||||||||||||||||||||||||||||||||||||||||||||
| 2008 Individual Player Stats • 2007 Individual Player Stats |
|---|