
FLORIDA INTERNATIONAL PANTHERS |
|
STADIUM: Riccardo Silva Stadium PLAYING SURFACE: FieldTurf Revolution 360 CAPACITY: 20,000 STARTERS RETURNING (O/D): 3*/3 LETTERMAN RETURNING: 29 (16,13,0) • LETTERMAN LOST: 31 (15,13,3) |
|
 |
||
| LOCATION: Miami, FL | ||
| FOUNDED: 1965 | ||
| ENROLLMENT: 48,439 | ||
| COLORS: Blue & Gold | ||
| MASCOT: Roary the Panther | ||
| CONFERENCE: CUSA | ||
| Head Coach: Willie Simmons | ||
| Yrs with Tm: 1st | ||
| Overall Record: 0-0 | ||
| Record with Tm: 0-0 | ||
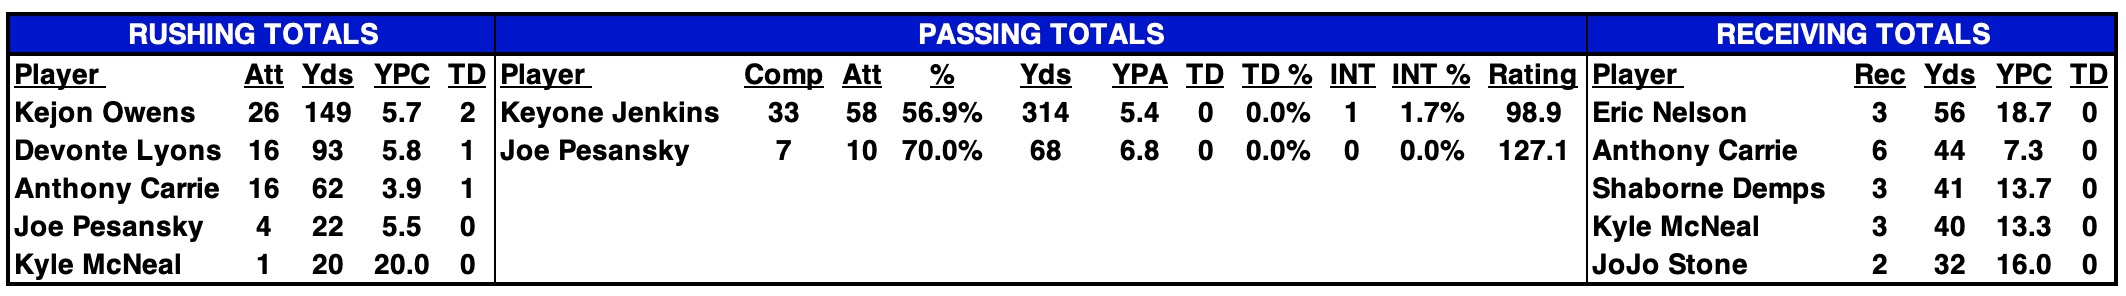
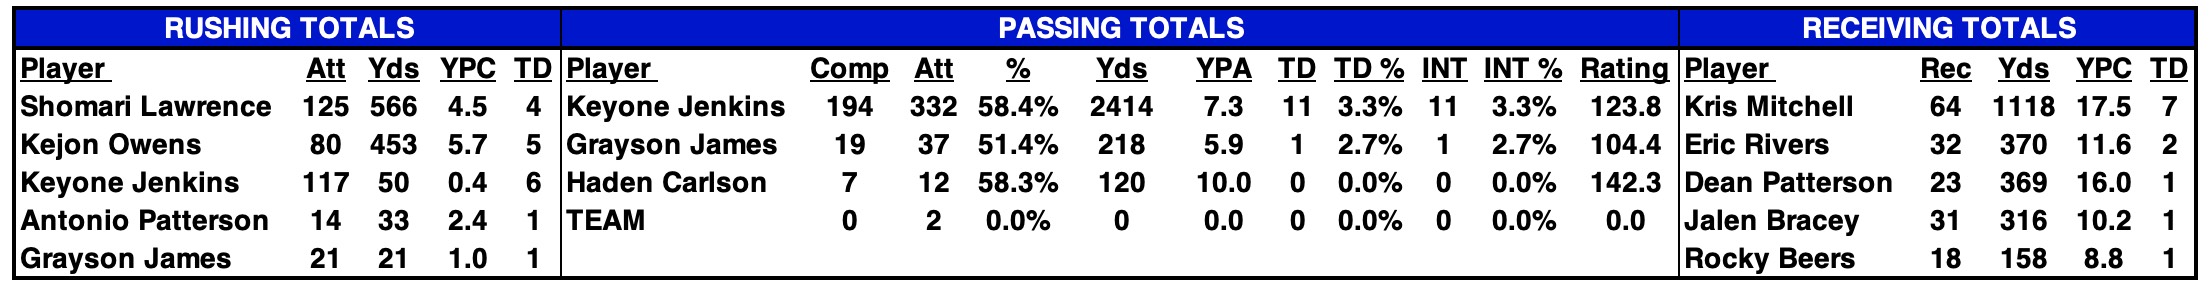
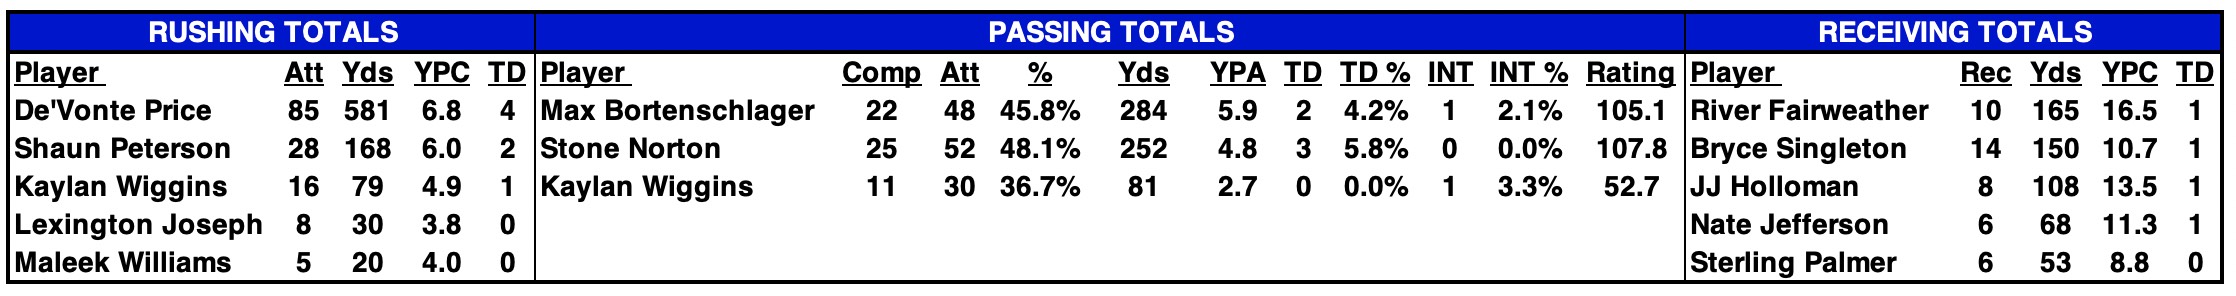
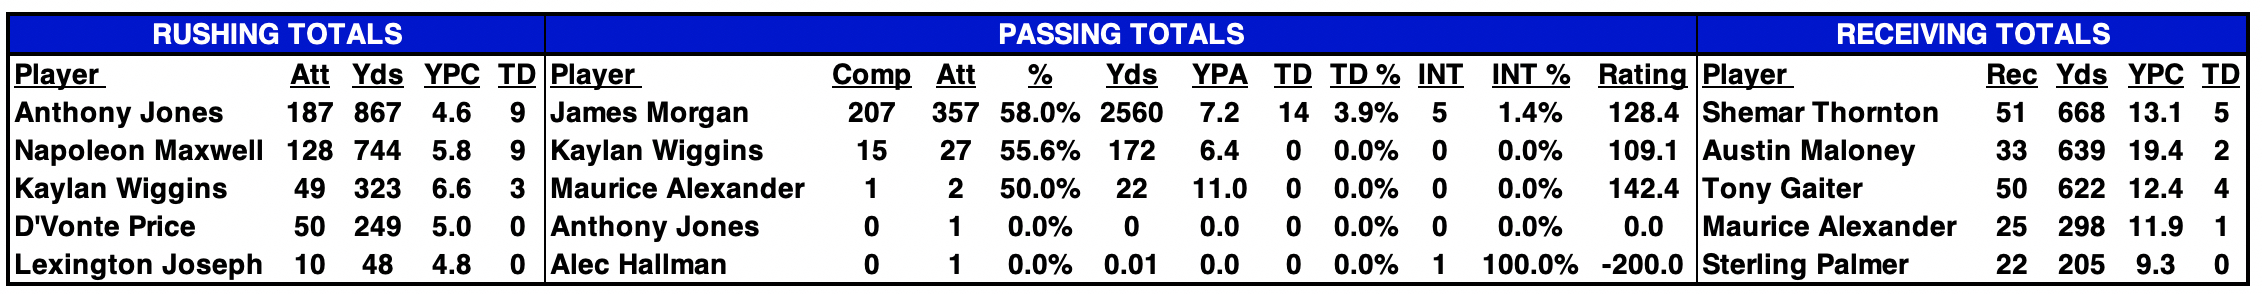
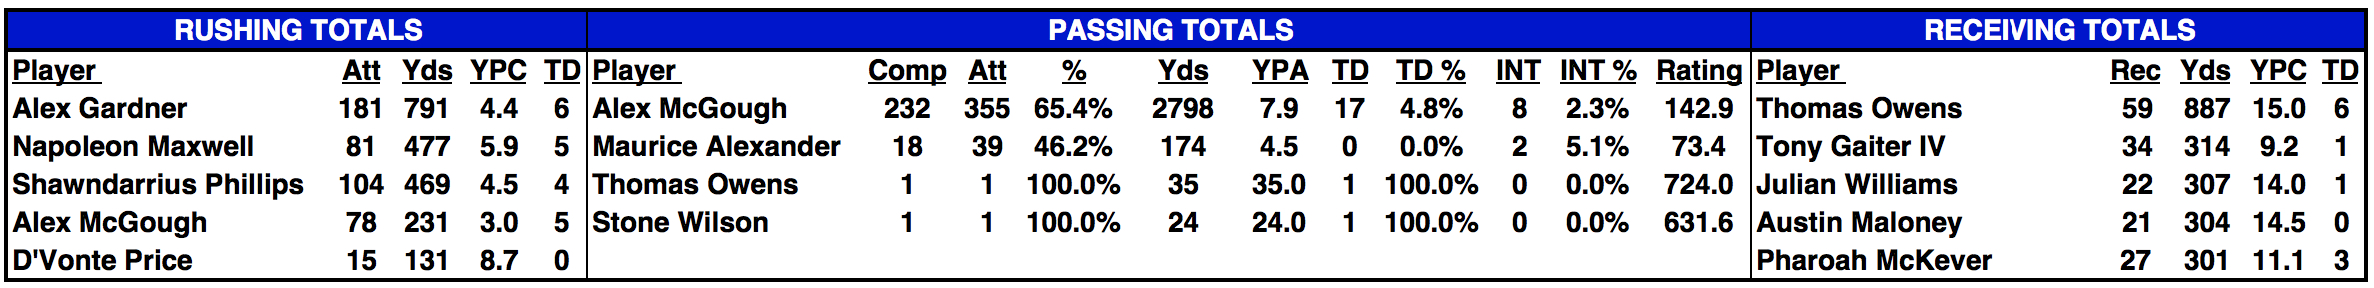
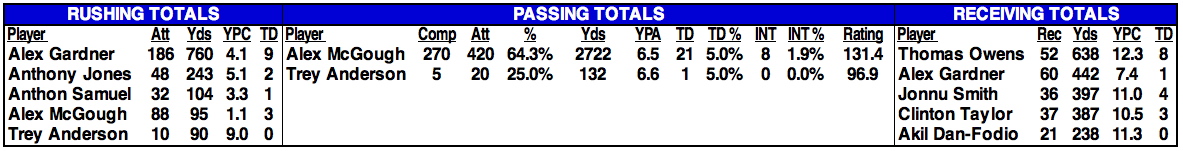
2025 STATISTICAL LEADERS |
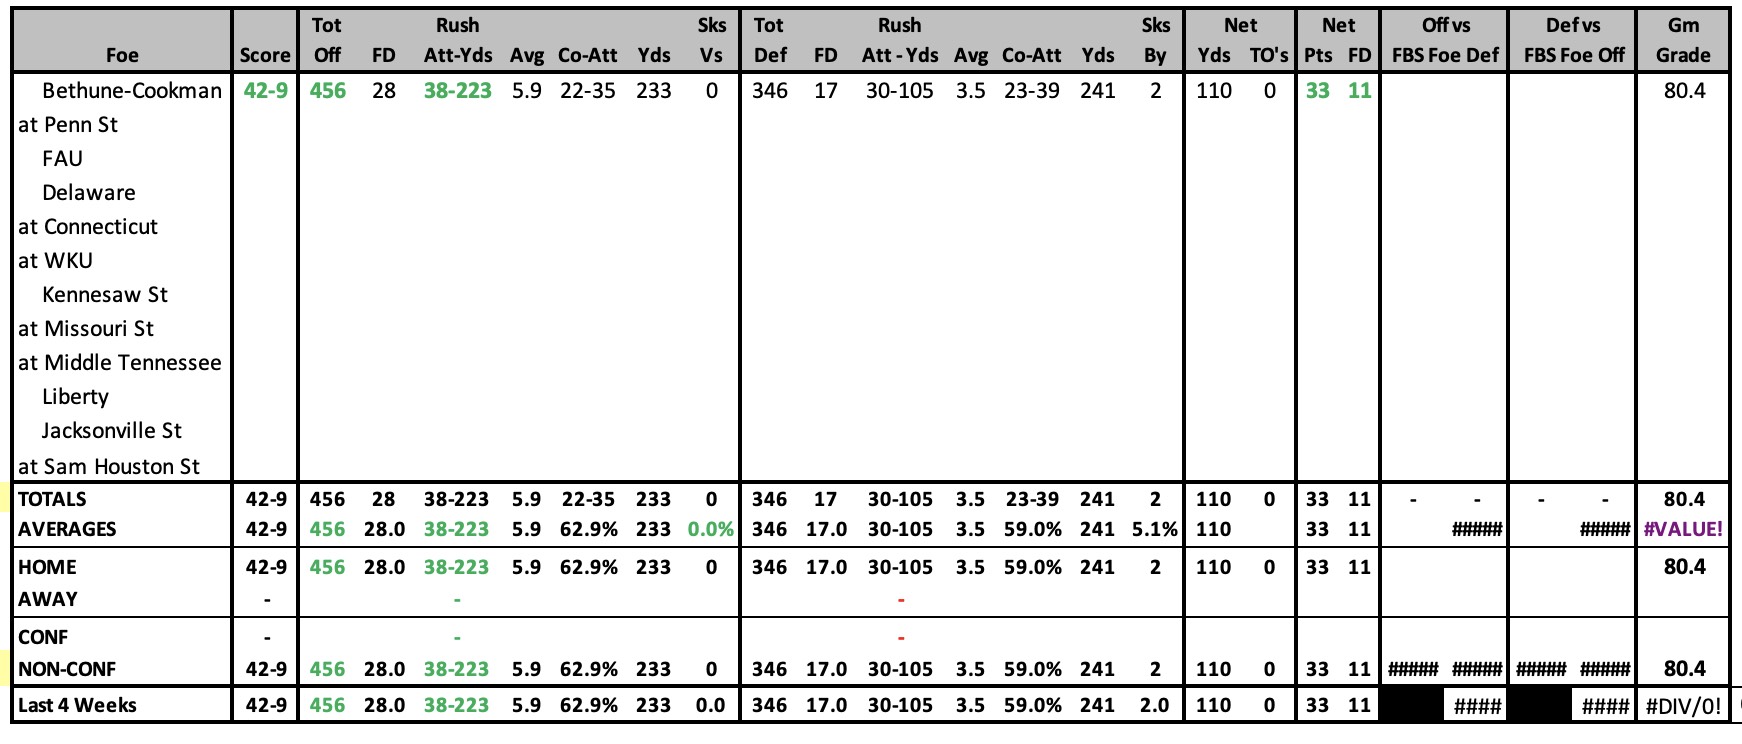
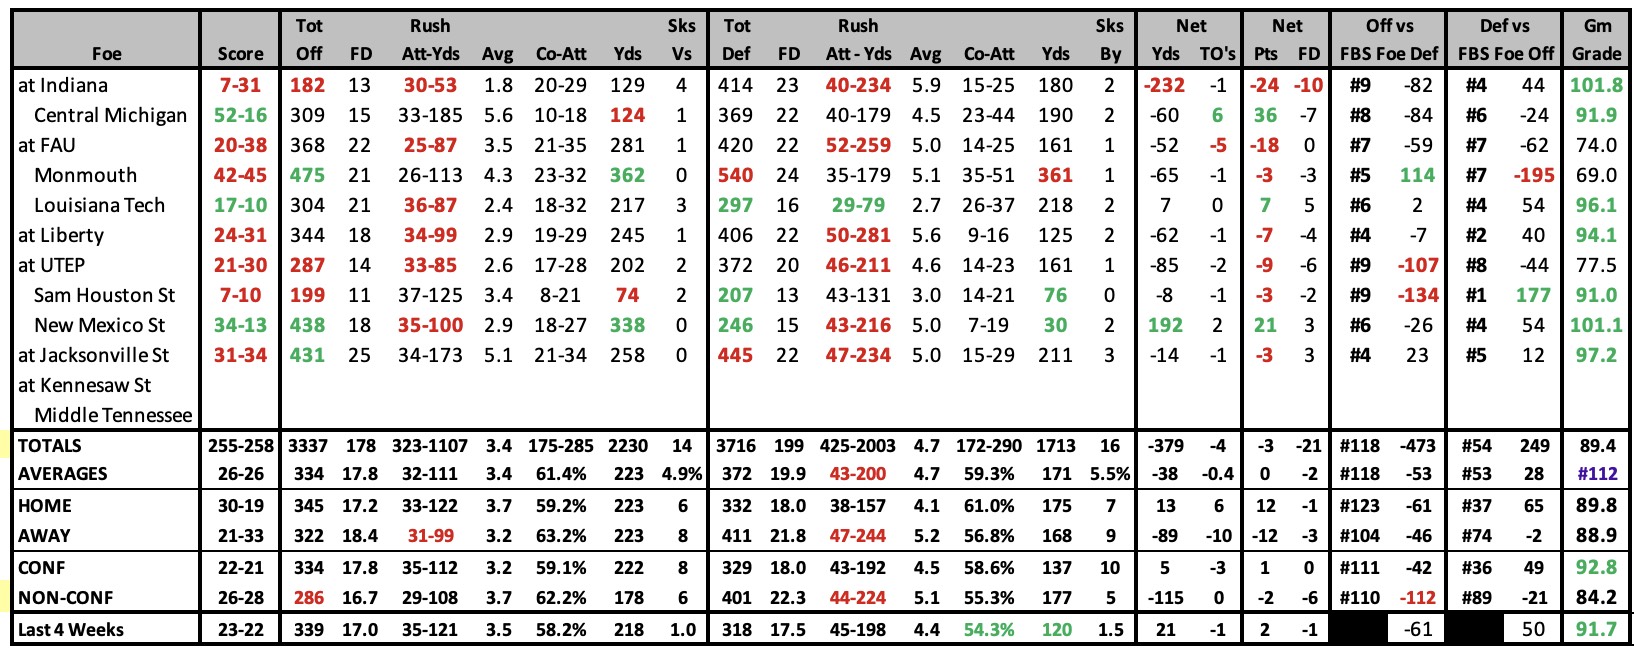
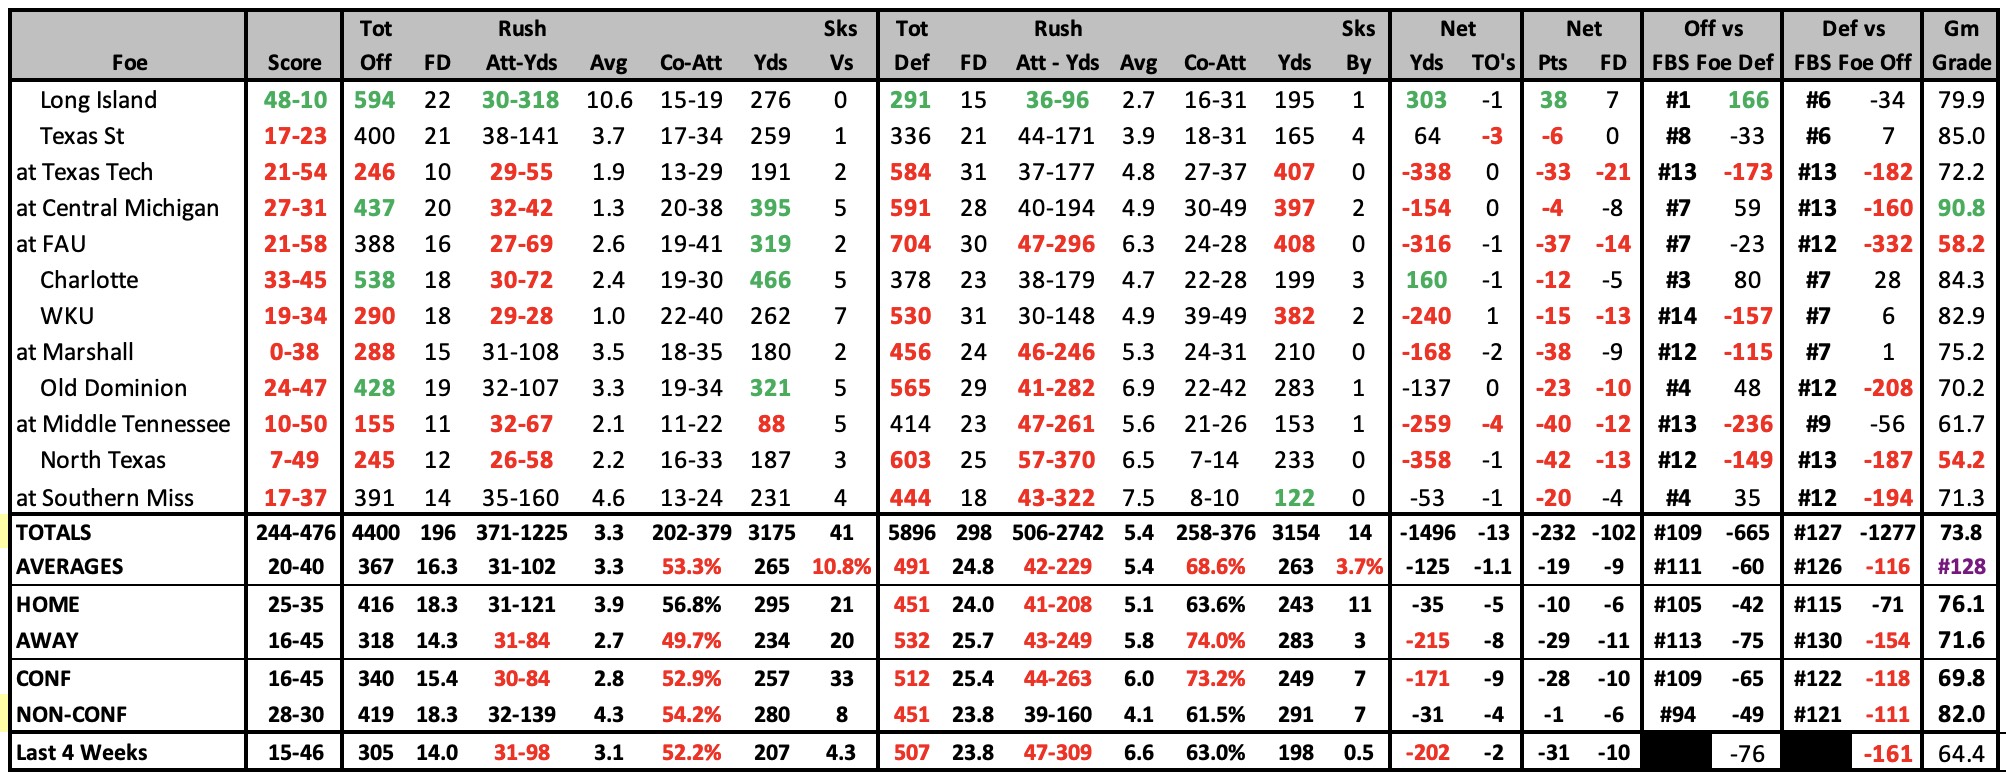
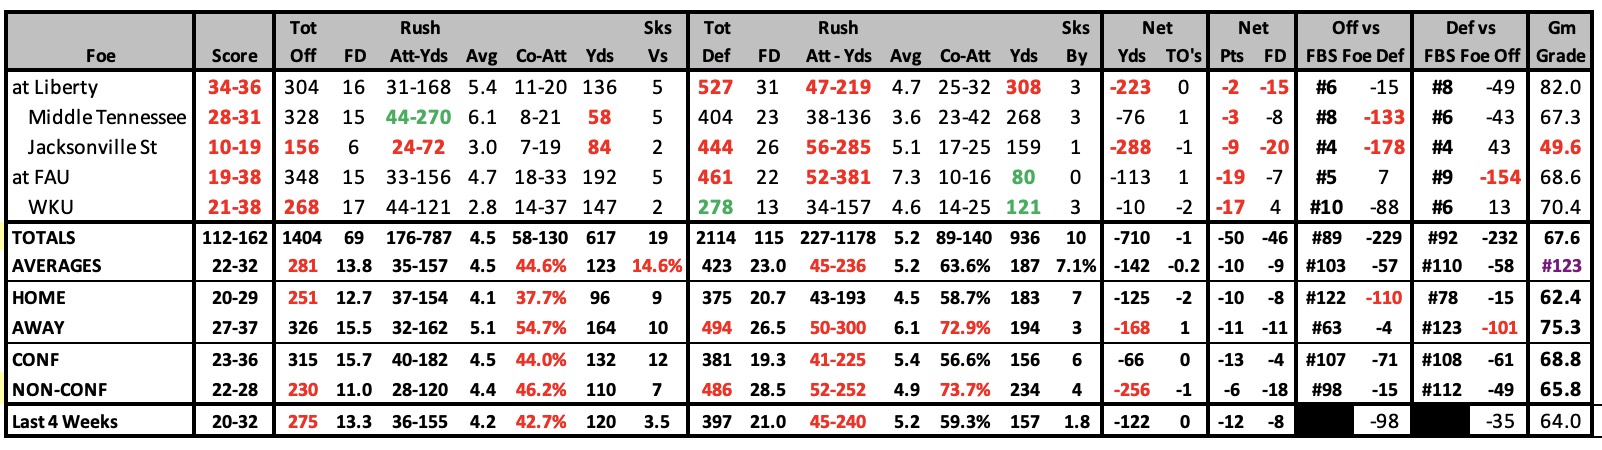
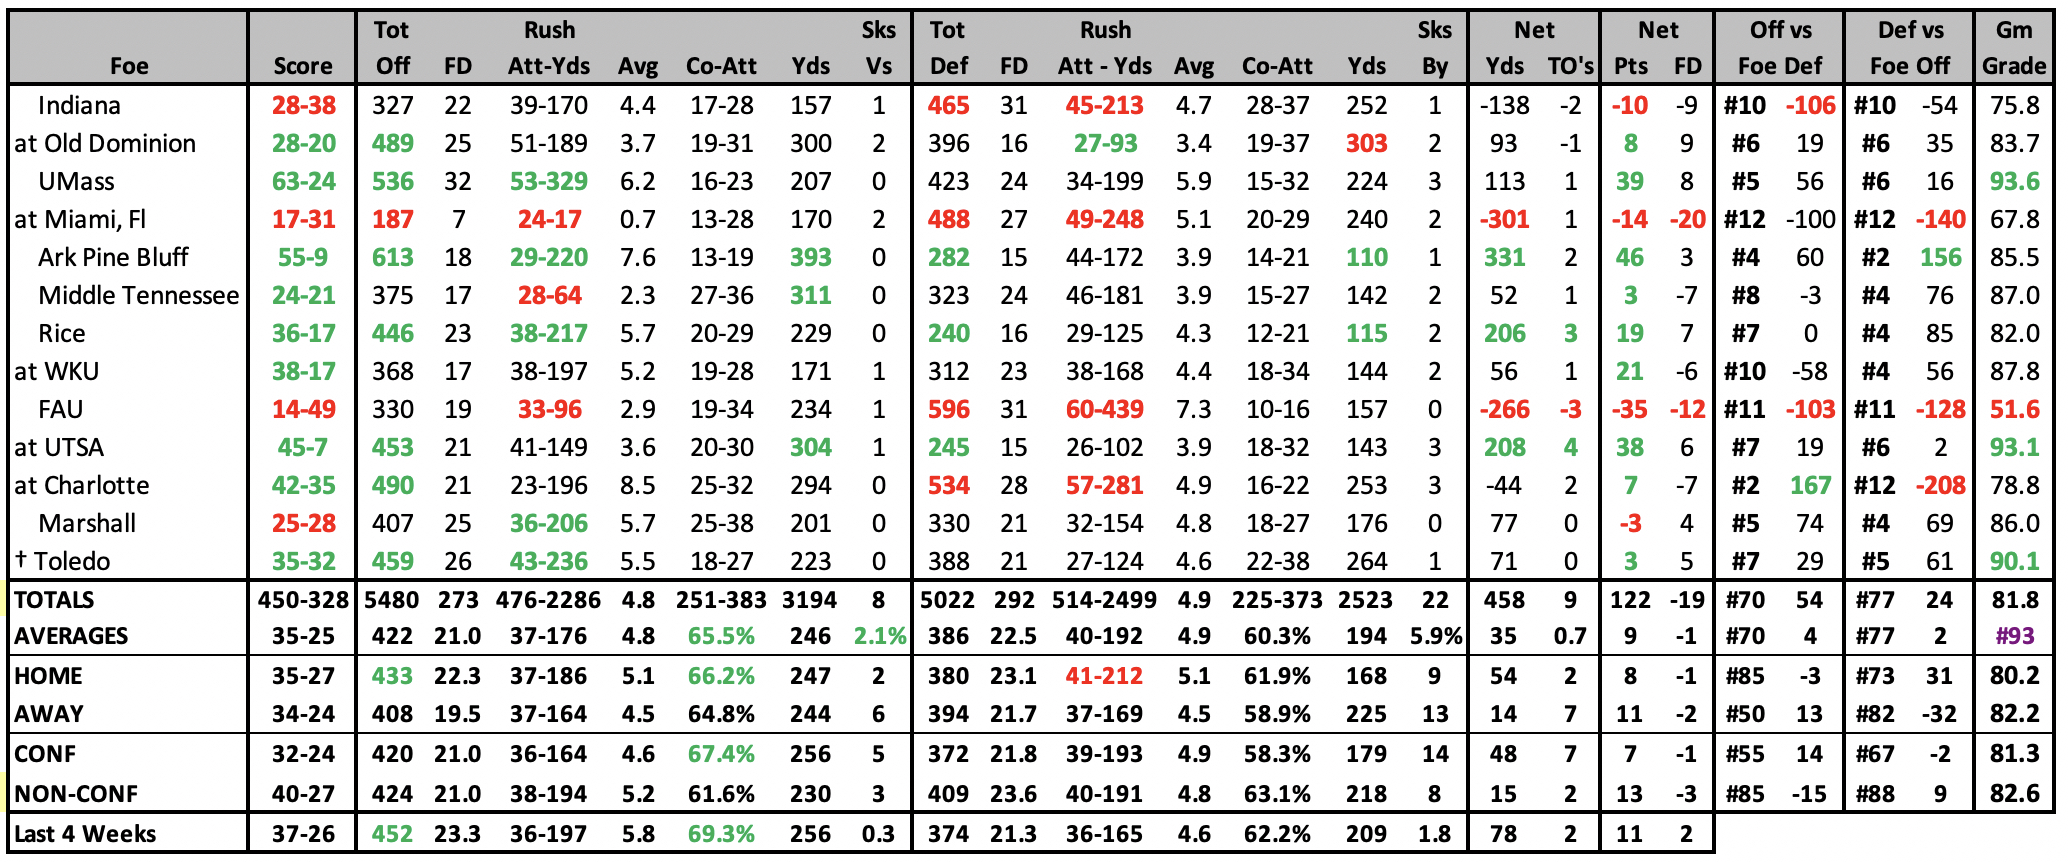
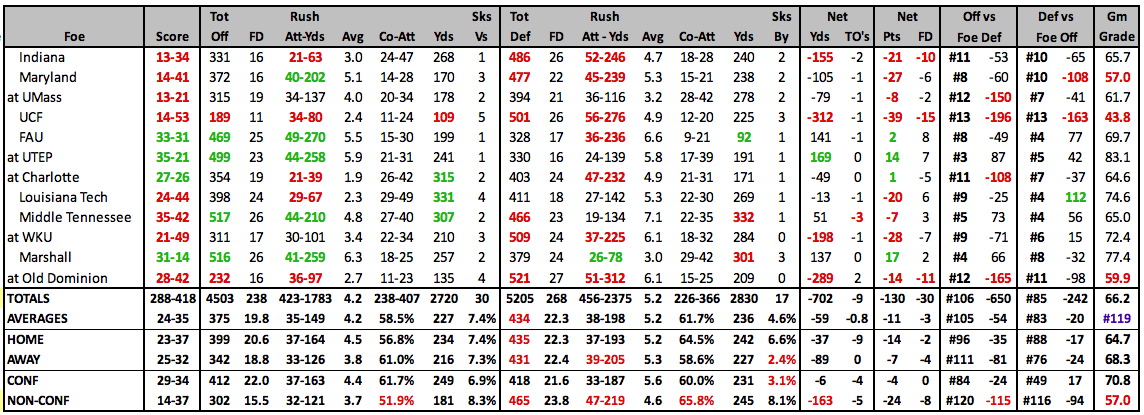
2025 GAME BY GAME STATS |
 |
2025 SCHEDULE |
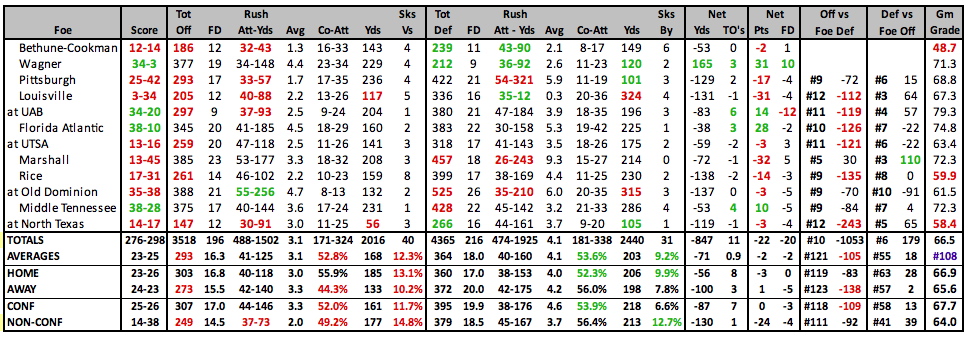
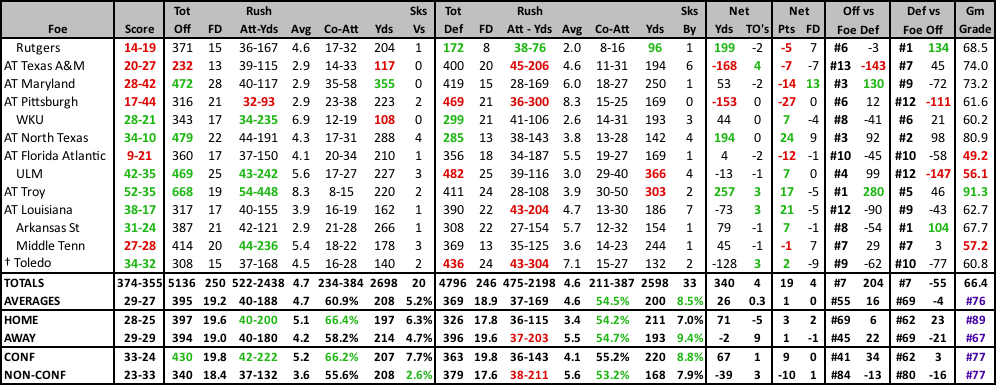
2024 RESULTS |
||||||||||||||||||||||||||||||||||||||||||||||||||||||||||||||||||||||||||||||||||||||||||||||||||||||||||||||||||||||||||||||||||||||||||||||||||||||||||||||||||||||||||||||||||||||||||||||||||||||
|
|
||||||||||||||||||||||||||||||||||||||||||||||||||||||||||||||||||||||||||||||||||||||||||||||||||||||||||||||||||||||||||||||||||||||||||||||||||||||||||||||||||||||||||||||||||||||||||||||||||||||
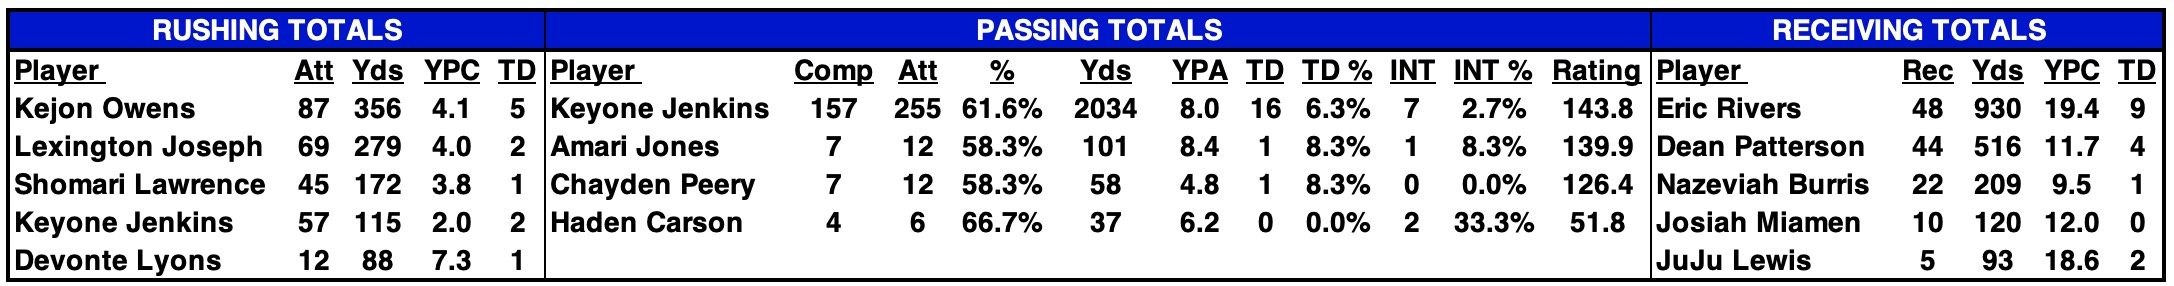
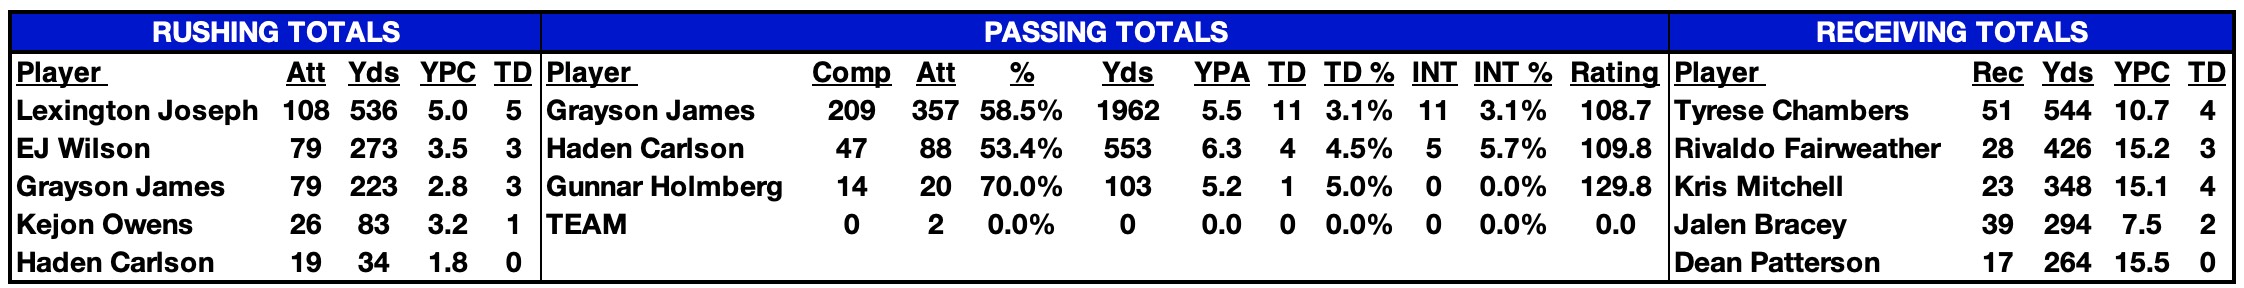
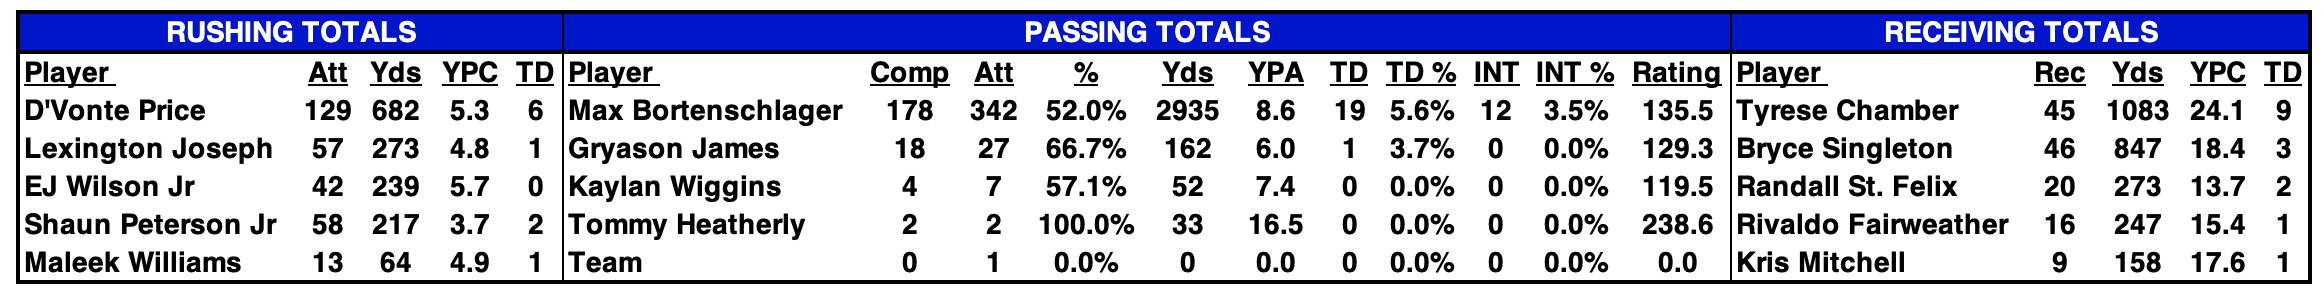
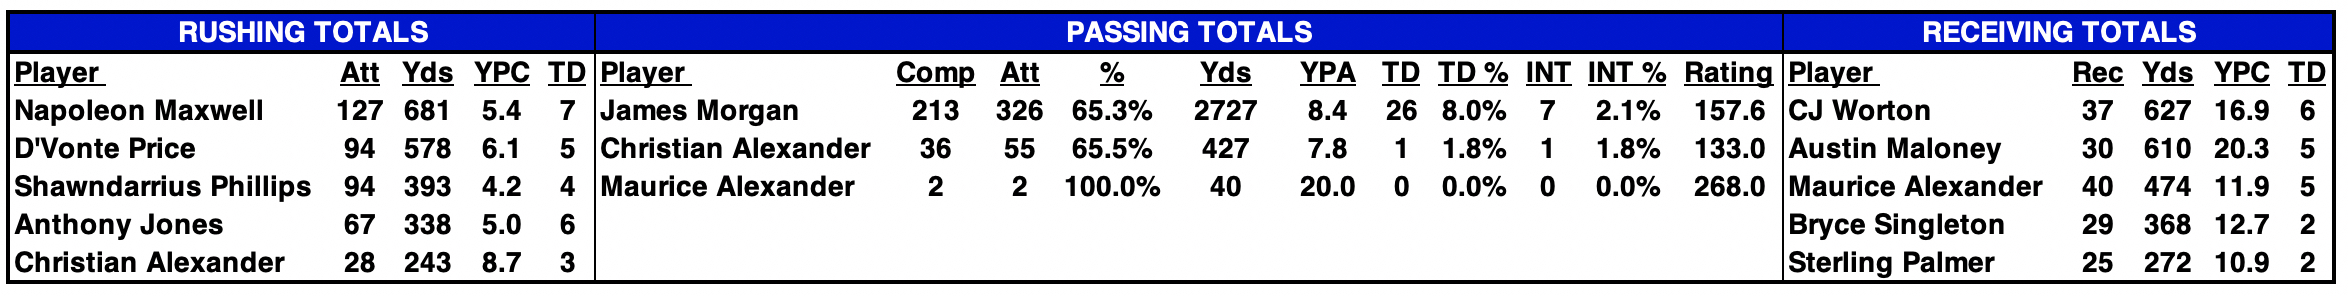
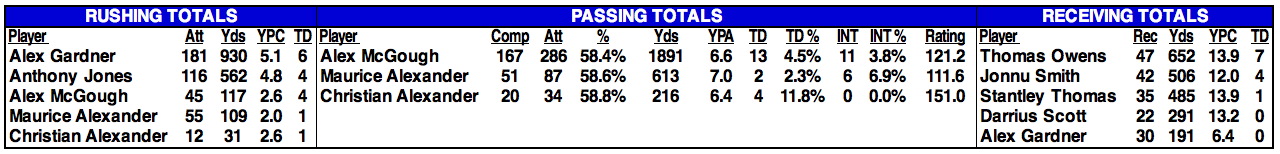
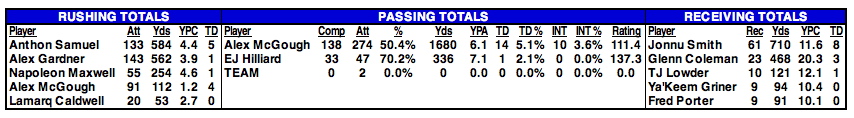
2024 STATISTICAL LEADERS |
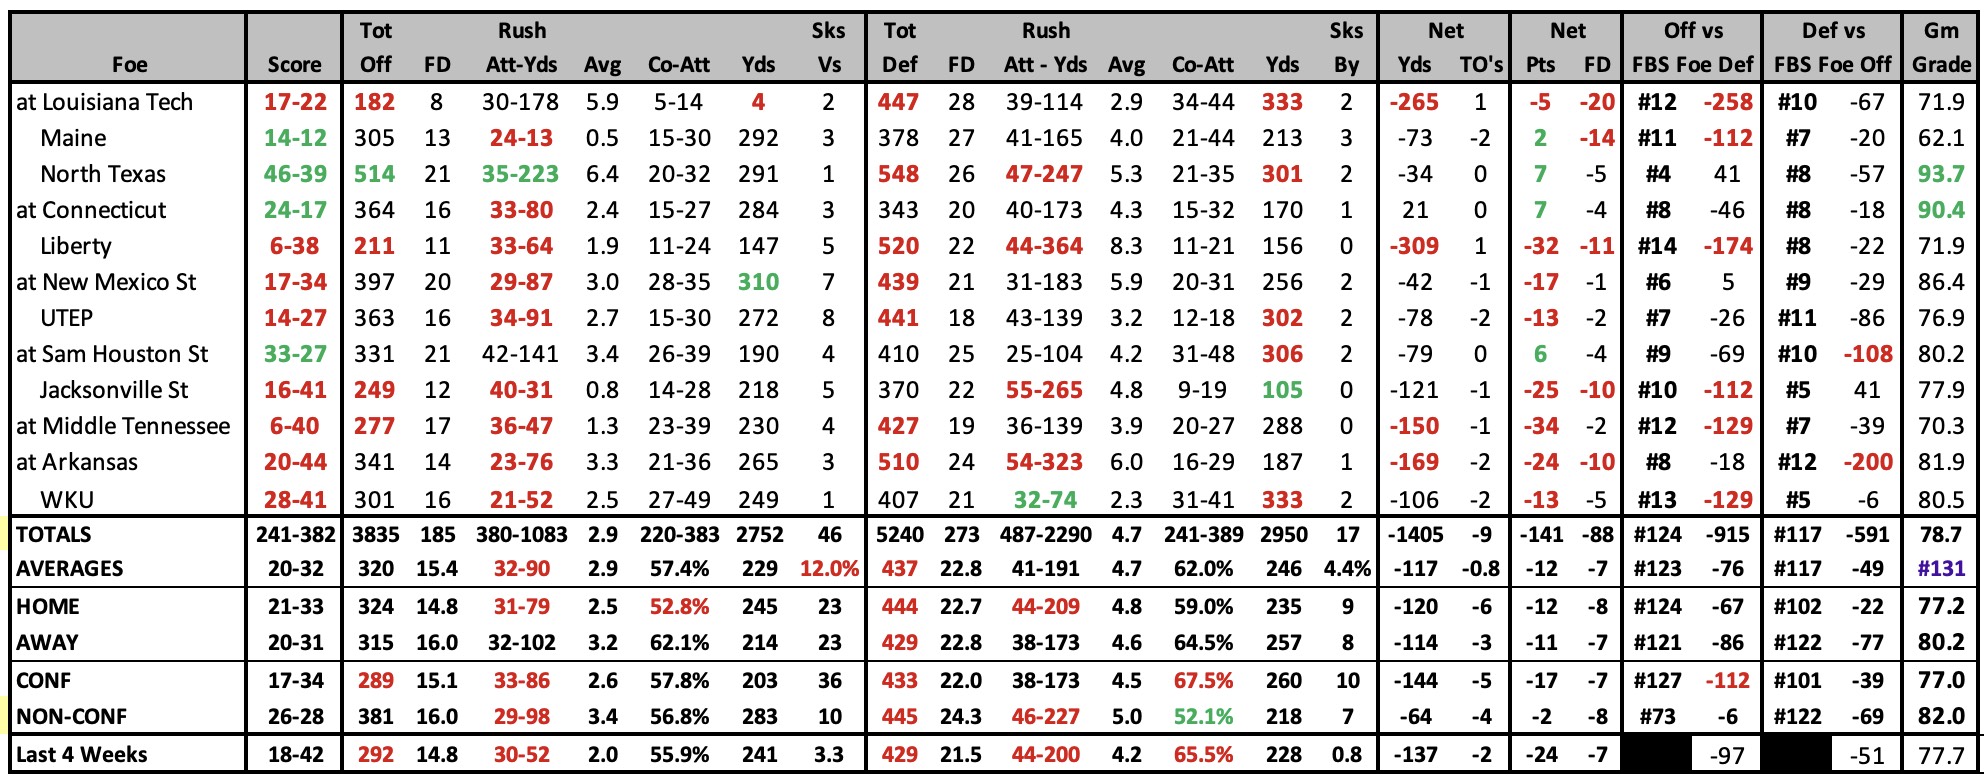
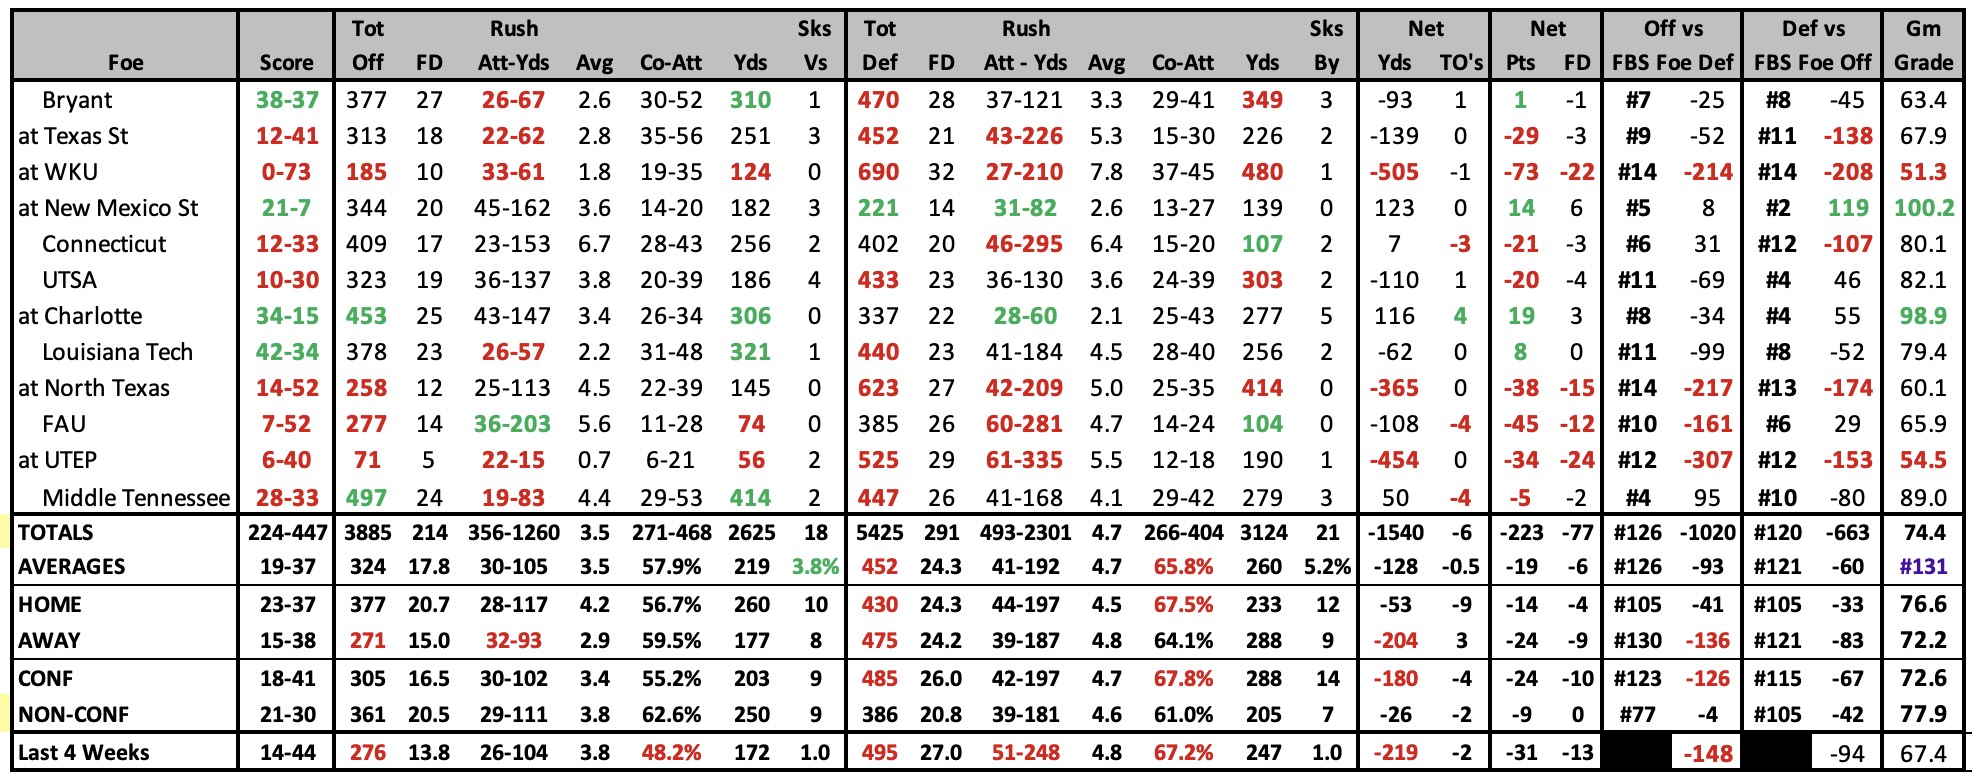
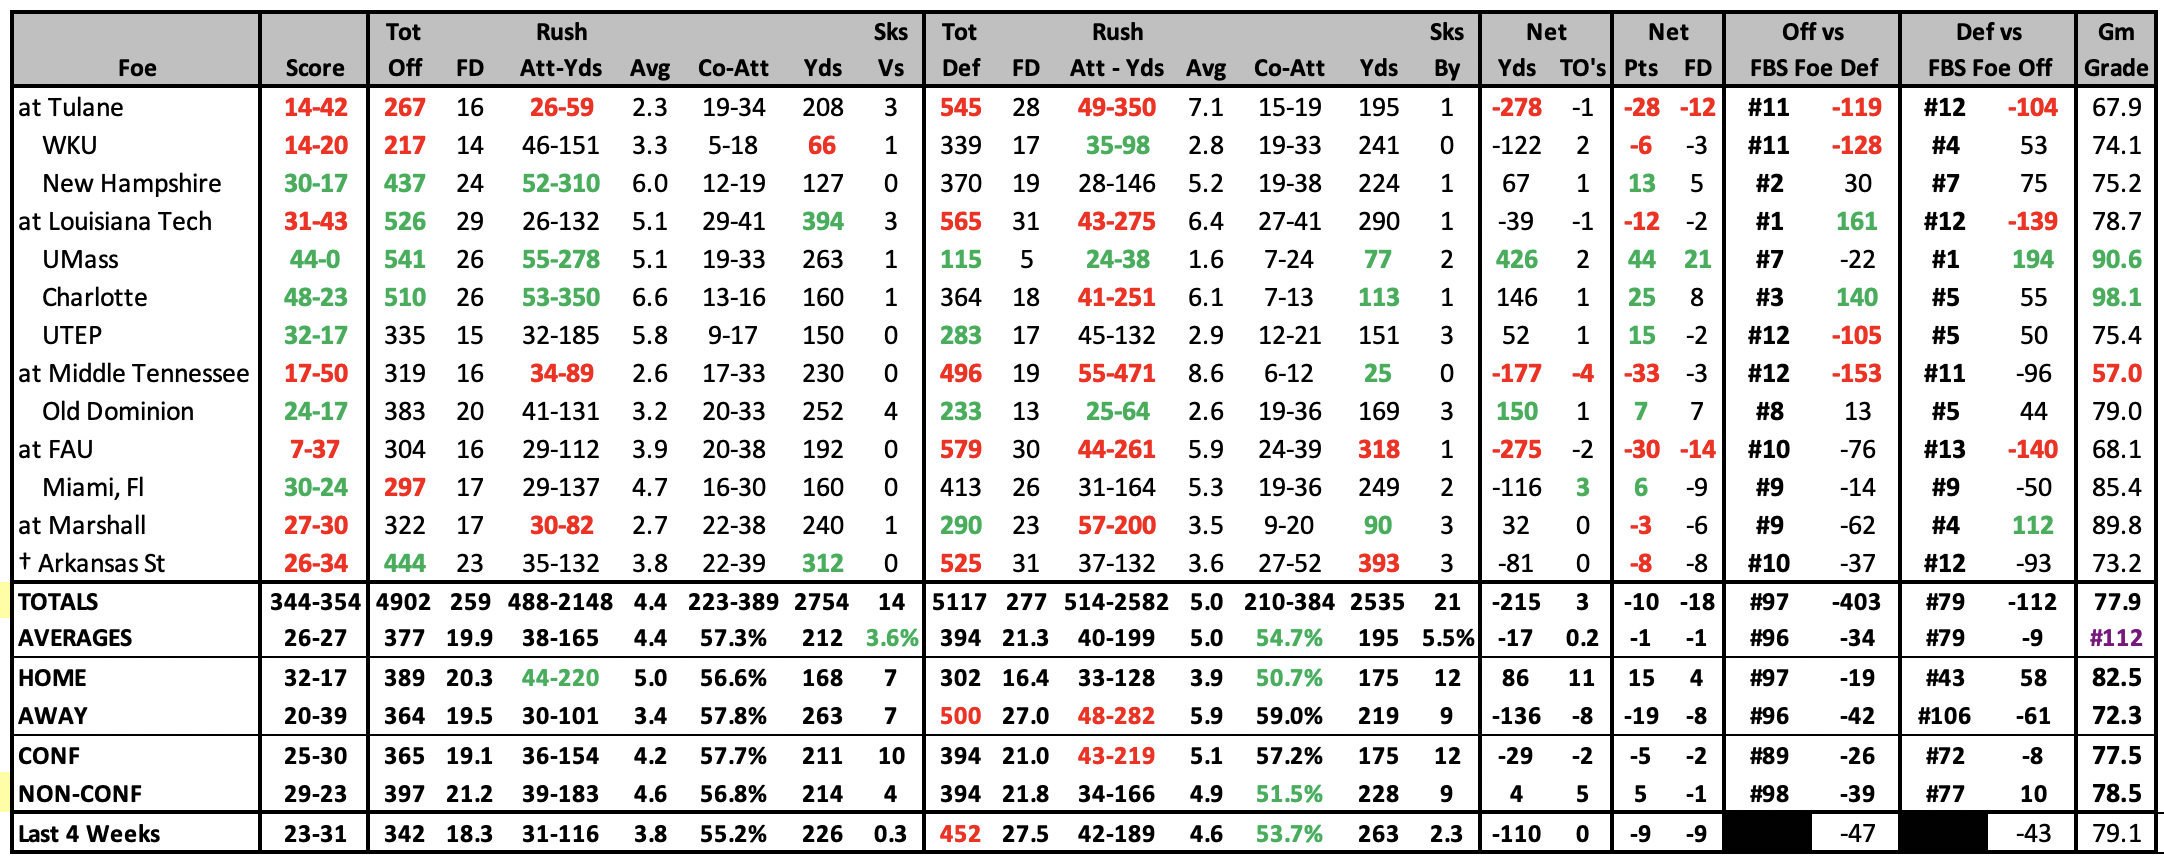
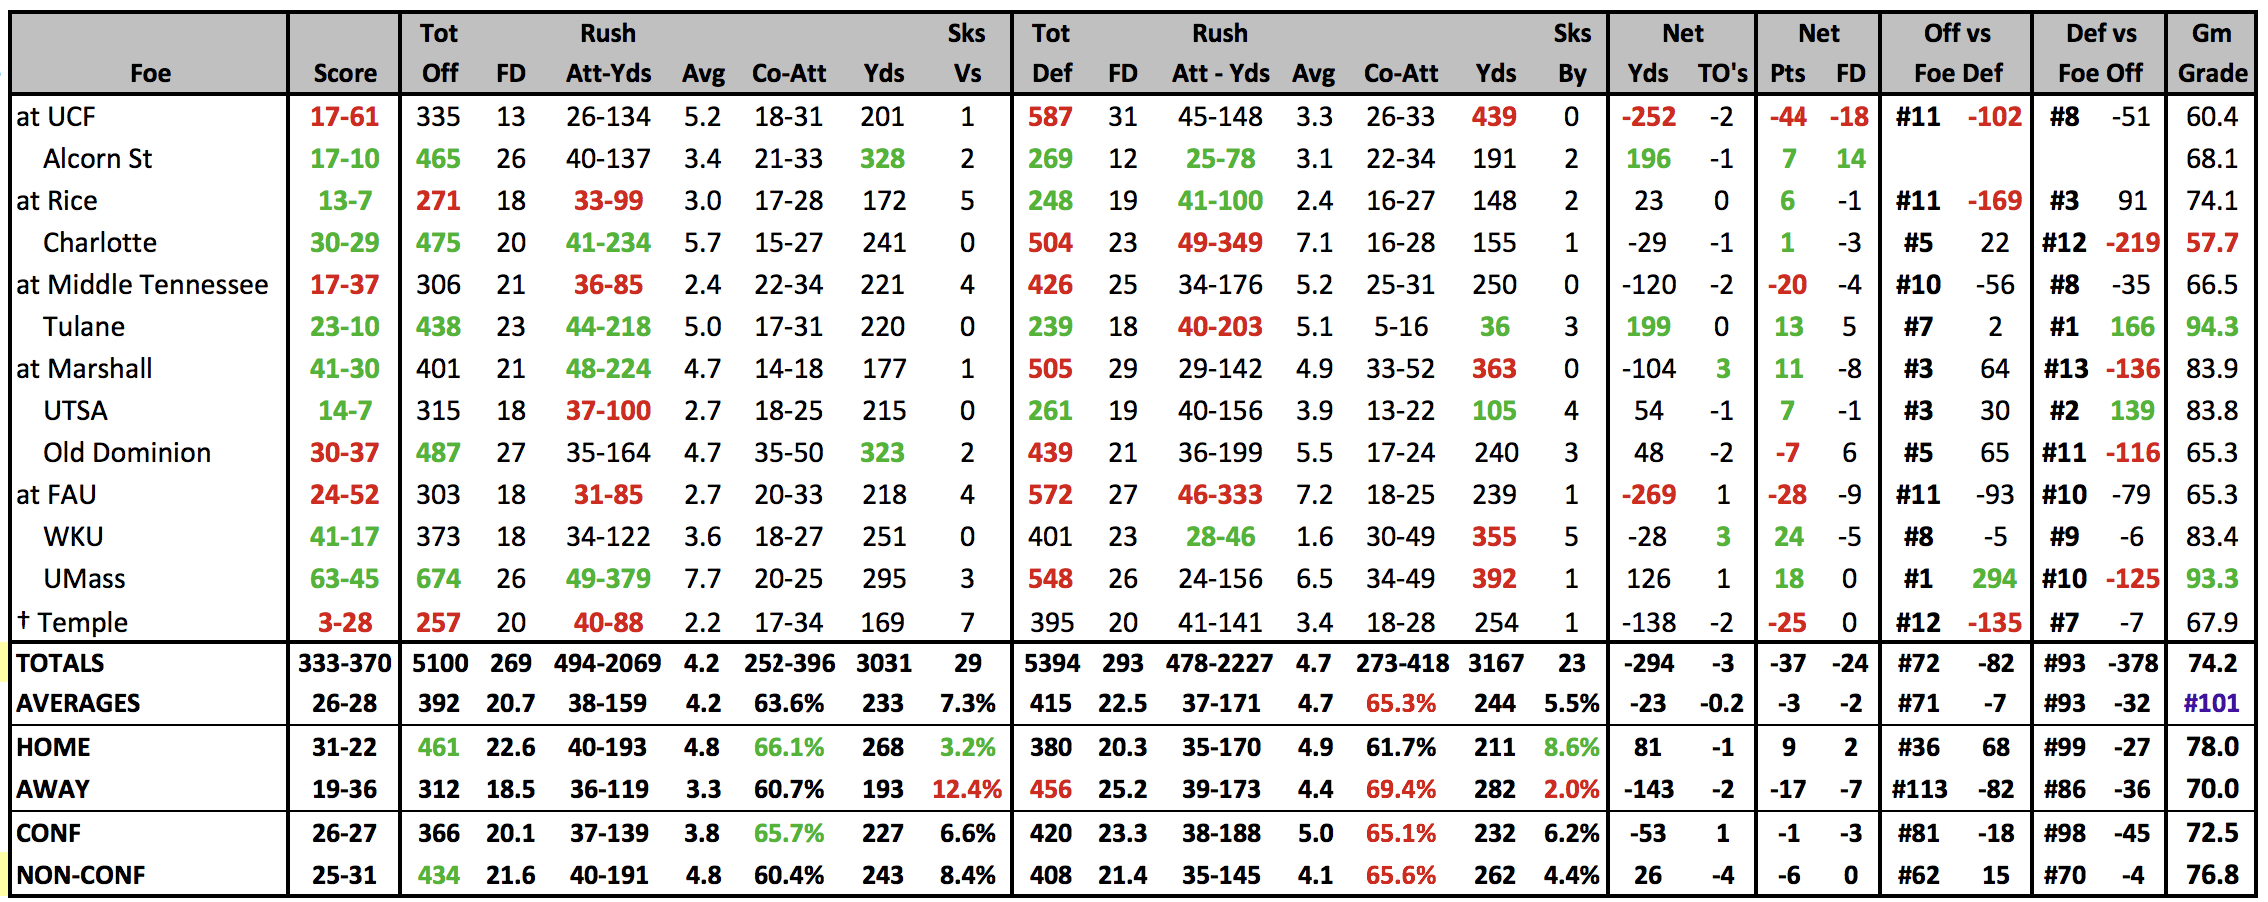
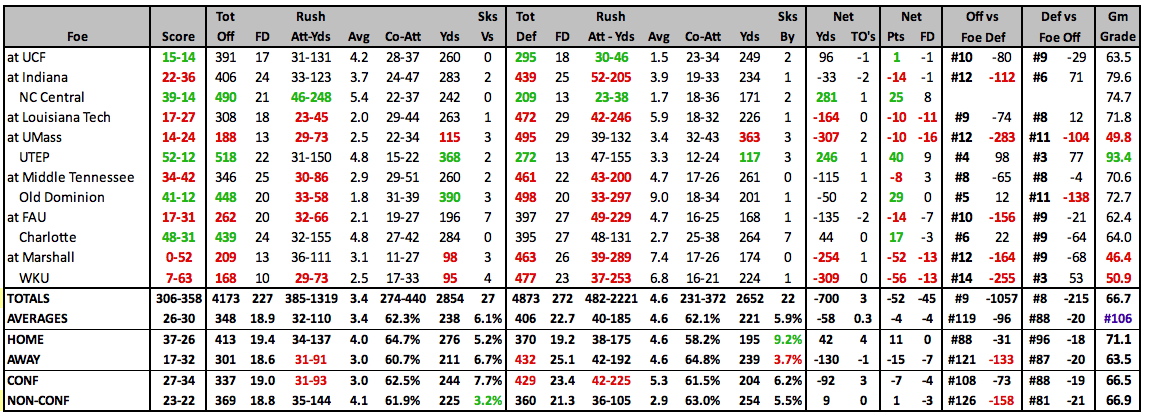
2024 GAME BY GAME STATS |
 |
2024 SCHEDULE |
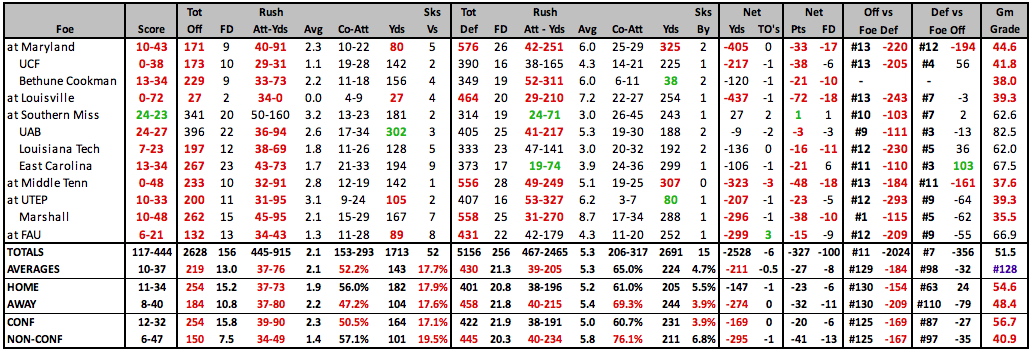
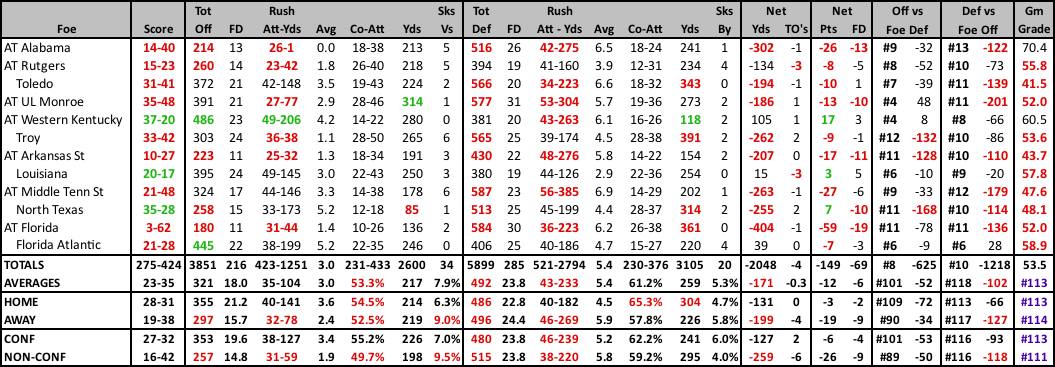
2023 RESULTS |
||||||||||||||||||||||||||||||||||||||||||||||||||||||||||||||||||||||||||||||||||||||||||||||||||||||||||||||||||||||||||||||||||||||||||||||||||||||||||||||||||||||||||||||||||||||||||||||||
|
|
2023 STATISTICAL LEADERS |
2023 GAME BY GAME STATS |
 |
2023 SCHEDULE |
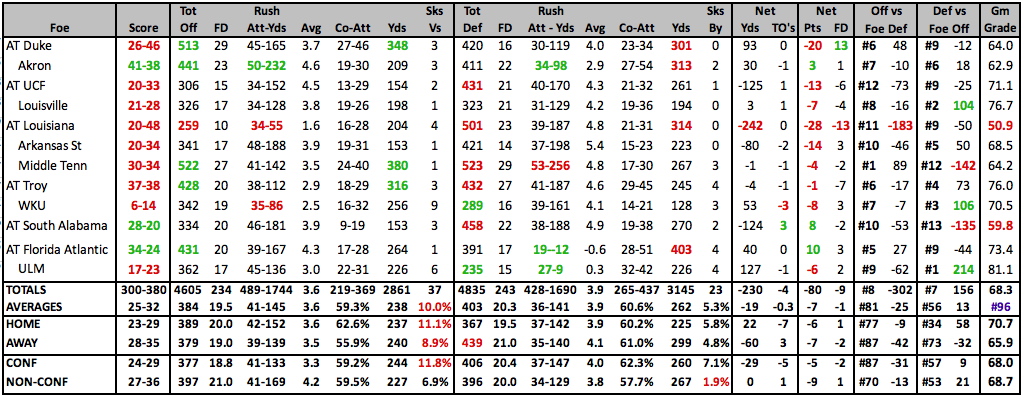
2022 RESULTS |
||||||||||||||||||||||||||||||||||||||||||||||||||||||||||||||||||||||||||||||||||||||||||||||||||||||||||||||||||||||||||||||||||||||||||||||||||||||||||||||||||||||||||||||||||||||||||||||||
|
|
2022 STATISTICAL LEADERS |
2022 GAME BY GAME STATS |
 |
2022 SCHEDULE |
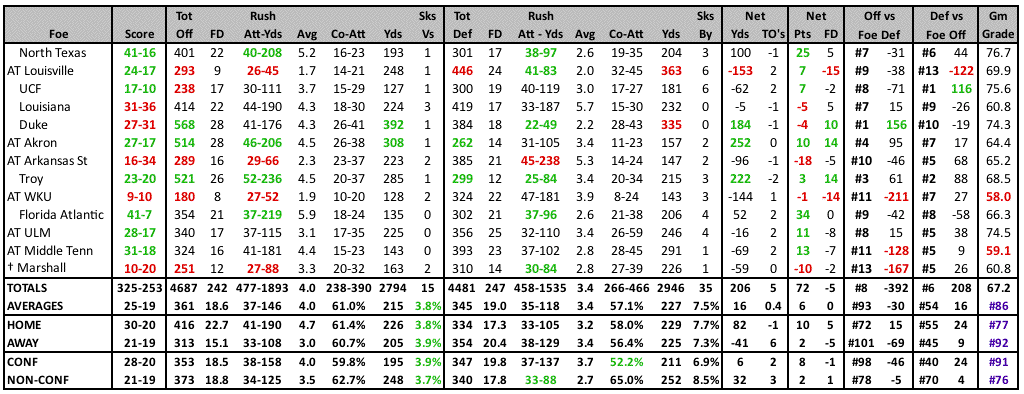
2021 RESULTS |
||||||||||||||||||||||||||||||||||||||||||||||||||||||||||||||||||||||||||||||||||||||||||||||||||||||||||||||||||||||||||||||||||||||||||||||||||||||||||||||||||||||||||||||||||||||||||
|
|
2021 STATISTICAL LEADERS |
2021 GAME BY GAME STATS |
 |
2021 SCHEDULE |
2020 RESULTS |
||||||||||||||||||||||||||||||||||||||||||||||||||||||||||||||||||||||||||||||||||||||||||||||||||||||||||||||||||||||||||||||||||||||||||||||||||||||||||||||||||||||||||||||||||||
|
|
2020 STATISTICAL LEADERS |
2020 GAME BY GAME STATS |
 |
2020 SCHEDULE |
2019 RESULTS |
||||||||||||||||||||||||||||||||||||||||||||||||||||||||||||||||||||||||||||||||||||||||||||||||||||||||||||||||||||||||||||||||||||||||||||||||||||||||||||||||||||||||||||||||||||||||||||||||||||||
|
|
||||||||||||||||||||||||||||||||||||||||||||||||||||||||||||||||||||||||||||||||||||||||||||||||||||||||||||||||||||||||||||||||||||||||||||||||||||||||||||||||||||||||||||||||||||||||||||||||||||||
2019 STATISTICAL LEADERS |
2019 GAME BY GAME STATS |
 |
2019 SCHEDULE |
2018 RESULTS |
||||||||||||||||||||||||||||||||||||||||||||||||||||||||||||||||||||||||||||||||||||||||||||||||||||||||||||||||||||||||||||||||||||||||||||||||||||||||||||||||||||||||||||||||||||||||||||||||||||||||||||||||||||||||||||
|
|
||||||||||||||||||||||||||||||||||||||||||||||||||||||||||||||||||||||||||||||||||||||||||||||||||||||||||||||||||||||||||||||||||||||||||||||||||||||||||||||||||||||||||||||||||||||||||||||||||||||||||||||||||||||||||||
2018 STATISTICAL LEADERS |
2018 GAME BY GAME STATS |
 |
2018 SCHEDULE |
2017 RESULTS |
|||||||||||||||||||||||||||||||||||||||||||||||||||||||||||||||||||||||||||||||||||||||||||||||||||||||||||||||||||||||||||||||||||||||||||||||||||||||||||||||||||||||||||||||||||||||||||||||||||||||||||||||||||||||||||||||||||||||
|
|
|||||||||||||||||||||||||||||||||||||||||||||||||||||||||||||||||||||||||||||||||||||||||||||||||||||||||||||||||||||||||||||||||||||||||||||||||||||||||||||||||||||||||||||||||||||||||||||||||||||||||||||||||||||||||||||||||||||||
2017 STATISTICAL LEADERS |
2017 GAME BY GAME STATS |
 |
2017 SCHEDULE |
2016 RESULTS |
||||||||||||||||||||||||||||||||||||||||||||||||||||||||||||||||||||||||||||||||||||||||||||||||||||||||||||||||||||||||||||||||||||||||||||||||||||||||||||||||||||||||||||||||||||||||||||||||||||||||||||||||||||||||||||||||
|
|
||||||||||||||||||||||||||||||||||||||||||||||||||||||||||||||||||||||||||||||||||||||||||||||||||||||||||||||||||||||||||||||||||||||||||||||||||||||||||||||||||||||||||||||||||||||||||||||||||||||||||||||||||||||||||||||||
2016 STATISTICAL LEADERS |
2016 GAME BY GAME STATS |
 |
2015 STATISTICAL LEADERS |
2015 GAME BY GAME STATS |
 |
2015 SCHEDULE |
2014 RESULTS |
|||||||||||||||||||||||||||||||||||||||||||||||||||||||||||||||||||||||||||||||||||||||||||||||||||||||||||||||||||||||||||||||||||||||||||||||||||||||||||||||||||||||||||||||||||||||||||||||||||||||||||||||||||||||||||||||||||||||
|
|
|||||||||||||||||||||||||||||||||||||||||||||||||||||||||||||||||||||||||||||||||||||||||||||||||||||||||||||||||||||||||||||||||||||||||||||||||||||||||||||||||||||||||||||||||||||||||||||||||||||||||||||||||||||||||||||||||||||||
2014 STATISTICAL LEADERS |
2014 GAME BY GAME STATS |
 |
2013 STATISTICAL LEADERS |
| Player | Att | Yds | YPC | TD | Player | Comp | Att | % | Yds | YPA | TD | INT | Rating | Player | Rec | Yds | YPC | TD |
| Lamarq Caldwell | 144 | 542 | 3.8 | 1 | Jake Medlock | 75 | 159 | 47.2% | 922 | 5.8 | 4 | 6 | 96.6 | Jonnu Smith | 39 | 388 | 9.9 | 2 |
| Silas Spearman | 132 | 368 | 2.8 | 4 | EJ Hilliard | 77 | 132 | 58.3% | 775 | 5.9 | 3 | 4 | 109.1 | TJ Lowder | 24 | 307 | 12.8 | 3 |
| Alfonso Randolph | 27 | 59 | 2.2 | 0 | Lamarq Caldwell | 1 | 1 | 100.0% | 16 | 16.0 | 1 | 0 | 564.4 | Clinton Taylor | 19 | 238 | 12.5 | 0 |
2013 GAME BY GAME STATS |
 |
2013 RESULTS |
2012 RESULTS |
||||||||||||||||||||||||||||||||||||||||||||||||||||||||||||||||||||||||||||||||||||||||||||||||||||||||||||||||||||||||||||||||||||||||||||||||||||||||||||||||||||||||||||||||||||||||||||||||||||||||||||||||||||||||||||||||||||||||||||||||||||||||||||||
|
|
||||||||||||||||||||||||||||||||||||||||||||||||||||||||||||||||||||||||||||||||||||||||||||||||||||||||||||||||||||||||||||||||||||||||||||||||||||||||||||||||||||||||||||||||||||||||||||||||||||||||||||||||||||||||||||||||||||||||||||||||||||||||||||||
2012 STATISTICAL LEADERS |
| Player | Att | Yds | YPC | TD | Player | Comp | Att | % | Yds | YPA | TD | INT | Rating | Player | Rec | Yds | YPC | TD | ||
| Kedrick Rhodes | 167 | 714 | 4.3 | 4 | Jake Medlock | 152 | 263 | 57.8% | 2127 | 8.1 | 13 | 2 | 140.5 | Willis Wright | 25 | 633 | 25.3 | 5 | ||
| Darian Mallary | 104 | 463 | 4.5 | 9 | EJ Hilliard | 65 | 94 | 69.1% | 645 | 6.9 | 4 | 3 | 134.4 | Wayne Times | 66 | 602 | 9.1 | 2 | ||
| Jeremiah Harden | 48 | 275 | 5.7 | 1 | Wayne Times | 1 | 1 | 100.0% | 69 | 69.0 | 0 | 0 | 679.6 | Jacob Younger | 25 | 404 | 16.2 | 3 |
| 2012 Individual Player Stats • 2012 Start Chart/ Starters Lost |
|---|
2012 GAME BY GAME STATS |
 |
2011 STATISTICAL LEADERS |
| Player | Att | Yds | YPC | TD | Player | Comp | Att | % | Yds | YPA | TD | INT | Rating | Player | Rec | Yds | YPC | TD | ||
| Kedrick Rhodes | 234 | 1149 | 4.9 | 8 | Wes Carroll | 200 | 332 | 60.2% | 2374 | 7.2 | 14 | 4 | 131.8 | T.Y. Hilton | 72 | 1038 | 14.4 | 7 | ||
| Darriet Perry | 131 | 496 | 3.8 | 6 | Jake Medlock | 37 | 56 | 66.1% | 376 | 6.7 | 1 | 1 | 124.8 | Wayne Times | 54 | 540 | 10.0 | 2 | ||
| T.Y. Hilton | 19 | 124 | 6.5 | 1 | Jacob Younger | 1 | 1 | 100.0% | 44 | 44.0 | 0 | 0 | 469.6 | Jacob Younger | 21 | 286 | 13.6 | 1 |
| 2011 Individual Player Stats • 2011 START CHART/STARTERS LOST |
|---|
2011 GAME BY GAME STATS |
2011 RESULTS |
2010 RESULTS |
|||||||||||||||||||||||||||||||||||||||||||||||||||||||||||||||||||||||||||||||||||||||||||||||||||||||||||||||||||||||||||||||||||||||||||||||||||||||||||||||||||||||||||||||||||||||||||||
|
|
|||||||||||||||||||||||||||||||||||||||||||||||||||||||||||||||||||||||||||||||||||||||||||||||||||||||||||||||||||||||||||||||||||||||||||||||||||||||||||||||||||||||||||||||||||||||||||||
2010 STATISTICAL LEADERS |
| Player | Att | Yds | YPC | TD | Player | Comp | Att | % | Yds | YPA | TD | INT | Rating | Player | Rec | Yds | YPC | TD | ||
| Darriet Perry | 170 | 839 | 4.9 | 16 | Wesley Carroll | 226 | 367 | 61.6% | 2623 | 7.1 | 16 | 14 | 128.4 | TY Hilton | 59 | 848 | 14.4 | 5 | ||
| Darrian Mallary | 122 | 679 | 5.6 | 2 | Wayne Younger | 8 | 13 | 61.5% | 75 | 5.8 | 0 | 0 | 110.0 | Greg Ellingson | 43 | 612 | 14.2 | 5 | ||
| Jerimiah Harden | 83 | 327 | 3.9 | 1 | Wayne Times | 0 | 3 | 0.0% | 0 | 0.0 | 0 | 0 | 0.0 | Wayne Times | 28 | 341 | 12.2 | 1 |
| 2010 Individual Player Stats |
|---|
2010 GAME BY GAME STATS |
2009 STATISTICAL LEADERS |
| Player | Att | Yds | YPC | TD | Player | Comp | Att | % | Yds | YPA | TD | INT | Rating | Player | Rec | Yds | YPC | TD | ||
| Daunte Owens | 93 | 376 | 4.04 | 5 | Paul McCall | 208 | 370 | 56.2% | 2343 | 6.3 | 14 | 8 | 117.6 | TY Hilton | 57 | 632 | 11.1 | 5 | ||
| Darriet Perry | 103 | 301 | 2.92 | 3 | Wayne Younger | 22 | 58 | 37.9% | 257 | 4.4 | 0 | 4 | 61.4 | Greg Ellingson | 34 | 528 | 15.5 | 4 | ||
| Kendall Berry | 63 | 264 | 4.19 | 6 | TY Hilton | 1 | 1 | 100.0% | 0 | 0.0 | 0 | 0 | 100.0 | Jason Frierson | 30 | 368 | 12.3 | 2 |
| 2009 Individual Player Stats |
|---|
2009 GAME BY GAME STATS |
2009 RESULTS |
2008 RESULTS |
|||||||||||||||||||||||||||||||||||||||||||||||||||||||||||||||||||||||||||||||||||||||||||||||||||||||||||||||||||||||||||||||||||||||||||||||||||||||||||||||||||||
|
|
|||||||||||||||||||||||||||||||||||||||||||||||||||||||||||||||||||||||||||||||||||||||||||||||||||||||||||||||||||||||||||||||||||||||||||||||||||||||||||||||||||||
| 2008 Individual Player Stats • 2007 Individual Player Stats |
|---|