
MIDDLE TENNESSEE BLUE RAIDERS |
|
STADIUM: Johnny "Red" Floyd Stadium PLAYING SURFACE: Sportexe PowerBlade HP • CAPACITY: 30,788 STARTERS RETURNING (O/D): 7*/8 LETTERMAN RETURNING: 30 (11,18,1) • LETTERMAN LOST: 44 (23,17,4) |
|
|
| LOCATION: Murfreesboro, TN | |
| FOUNDED: 1911 | |
| ENROLLMENT: 19,251 | |
| COLORS: Royal Blue & White | |
| MASCOT: Lightning | |
| CONFERENCE: CUSA | |
| Head Coach: Derek Mason | |
| Yrs with Tm: 2nd | |
| Overall Record: 30-64 | |
| Record with Tm: 3-9 |
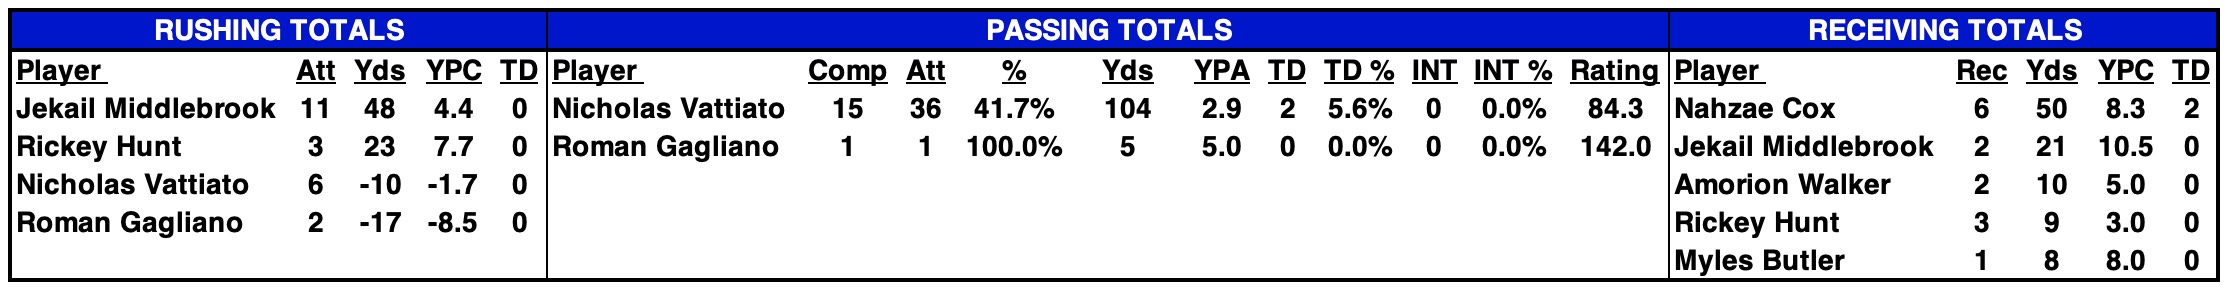
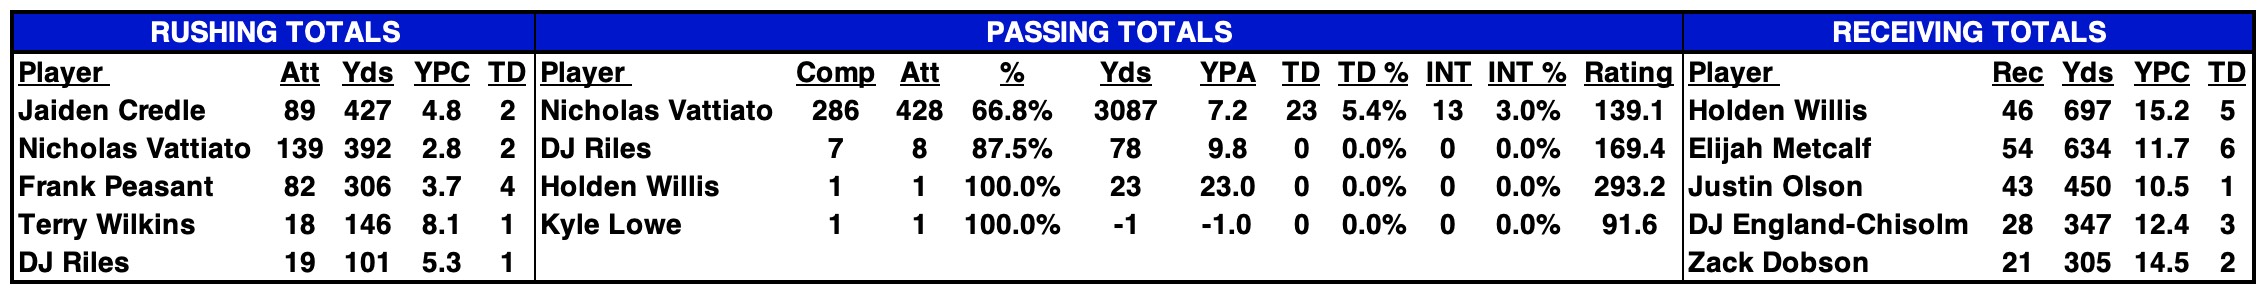
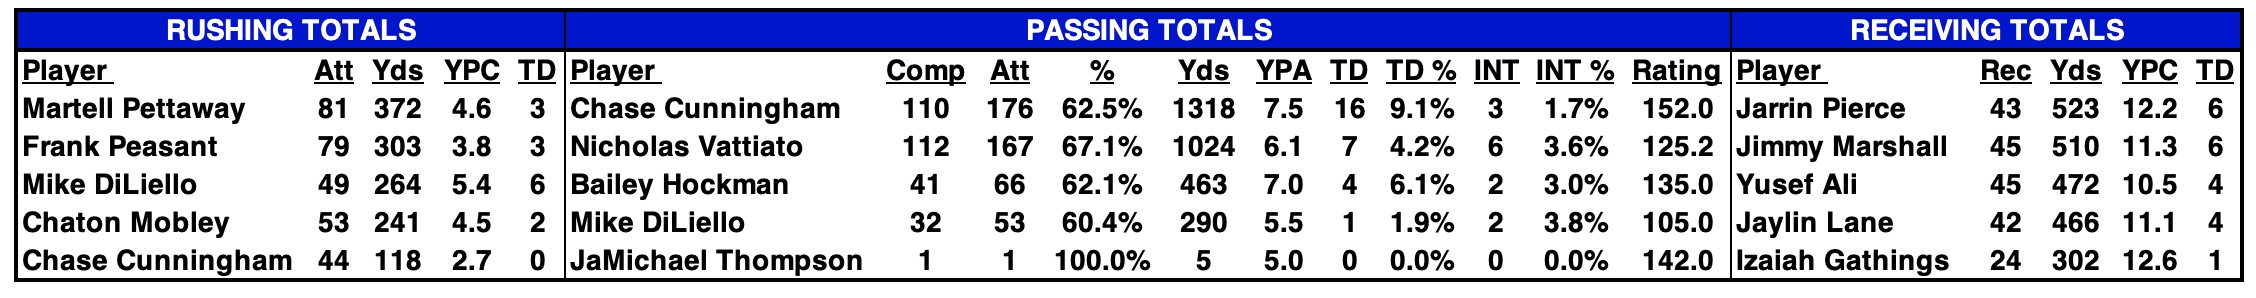
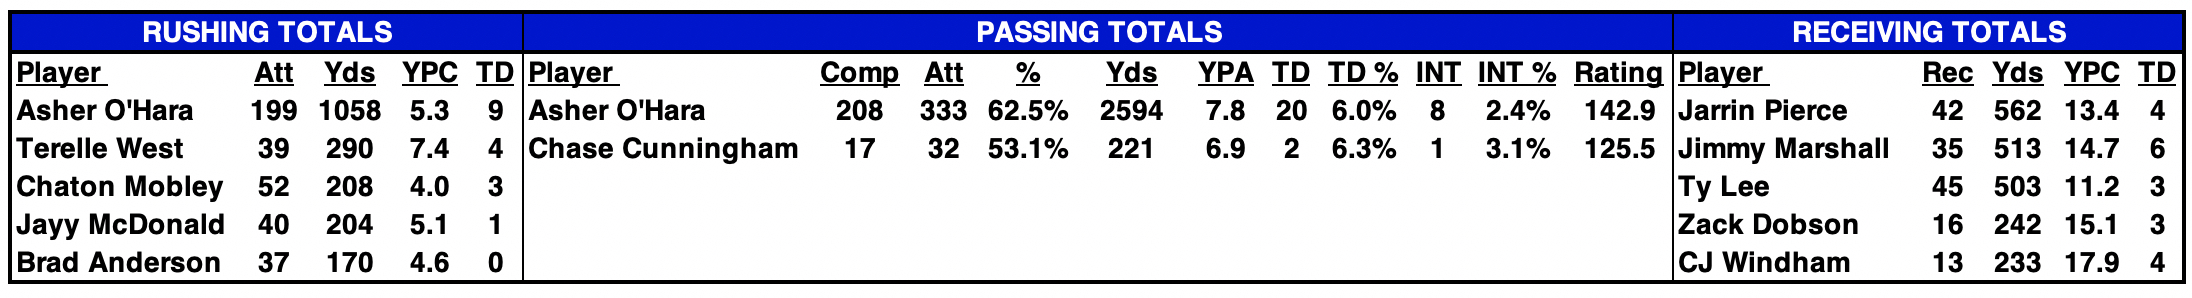
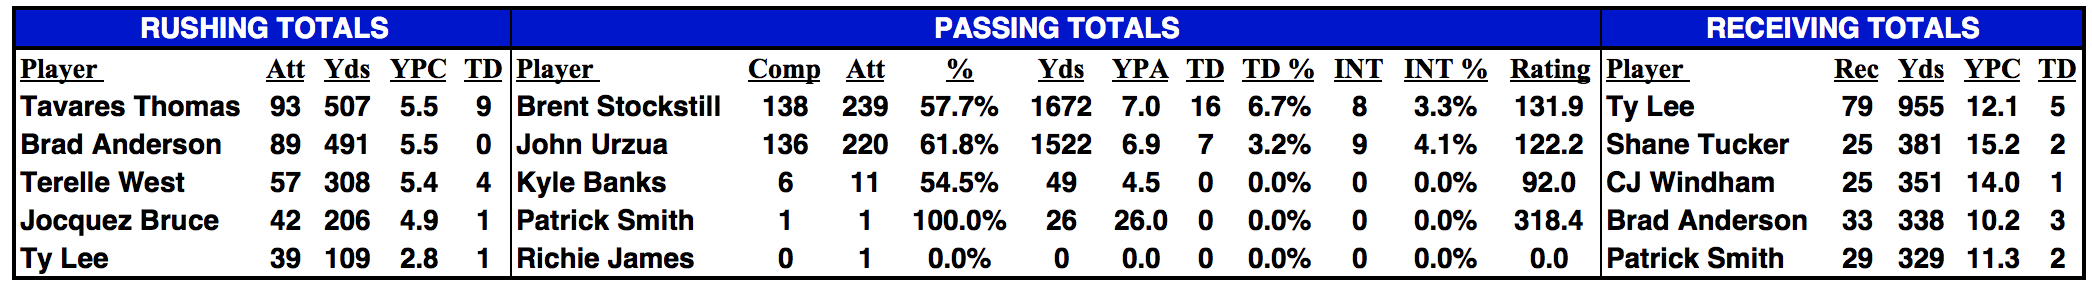
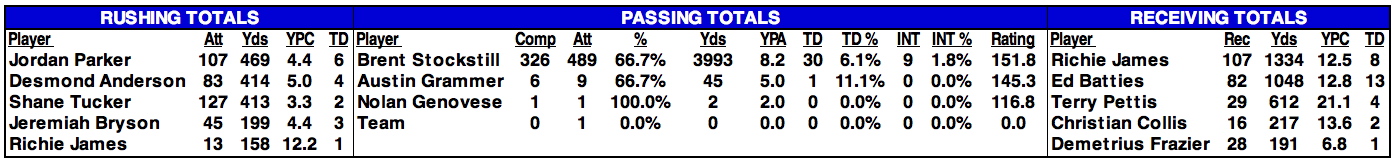
2025 STATISTICAL LEADERS |
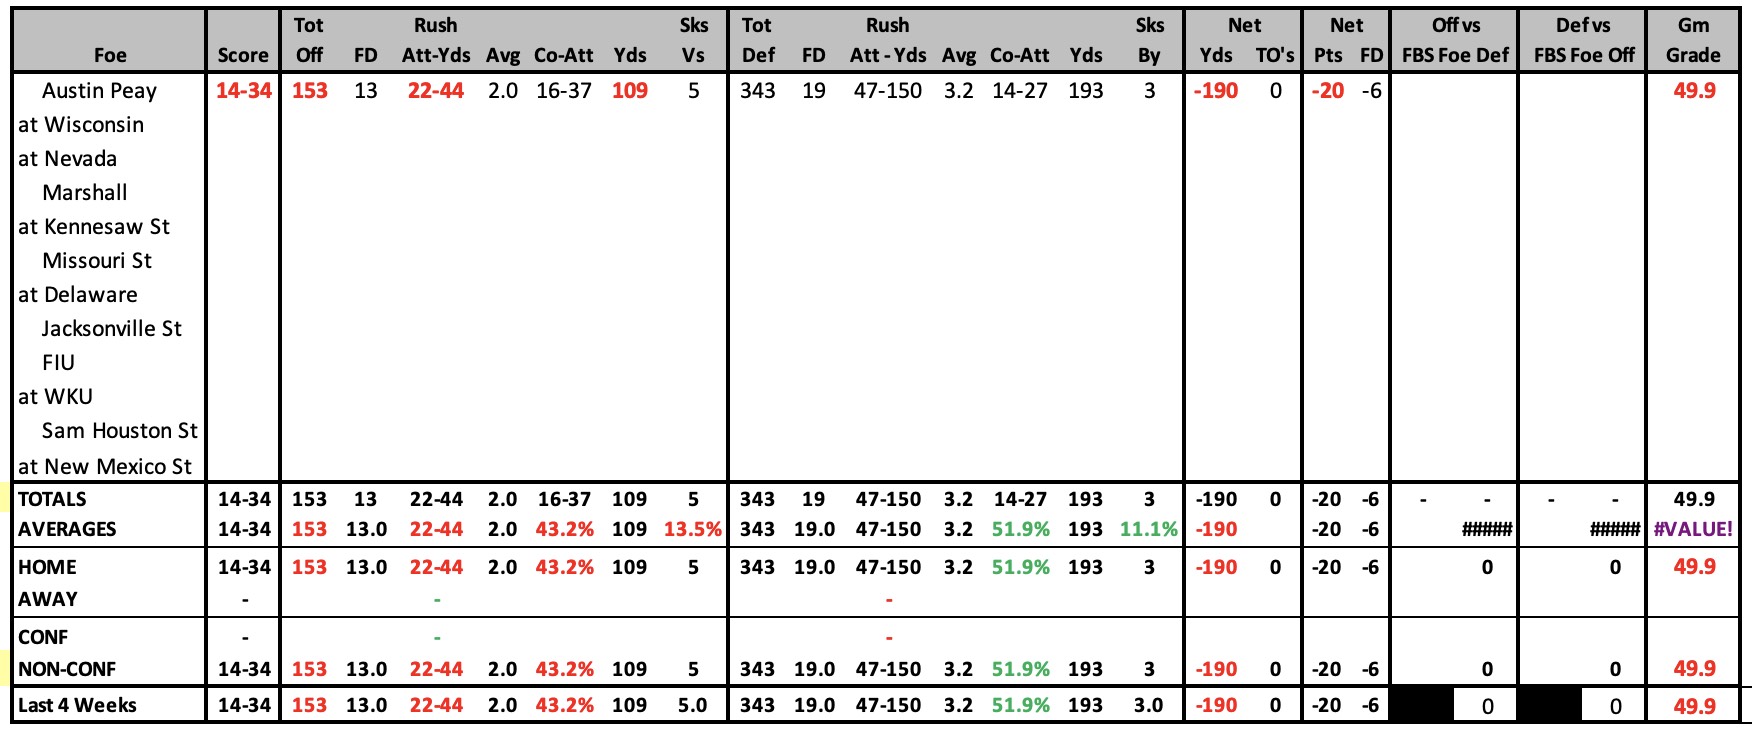
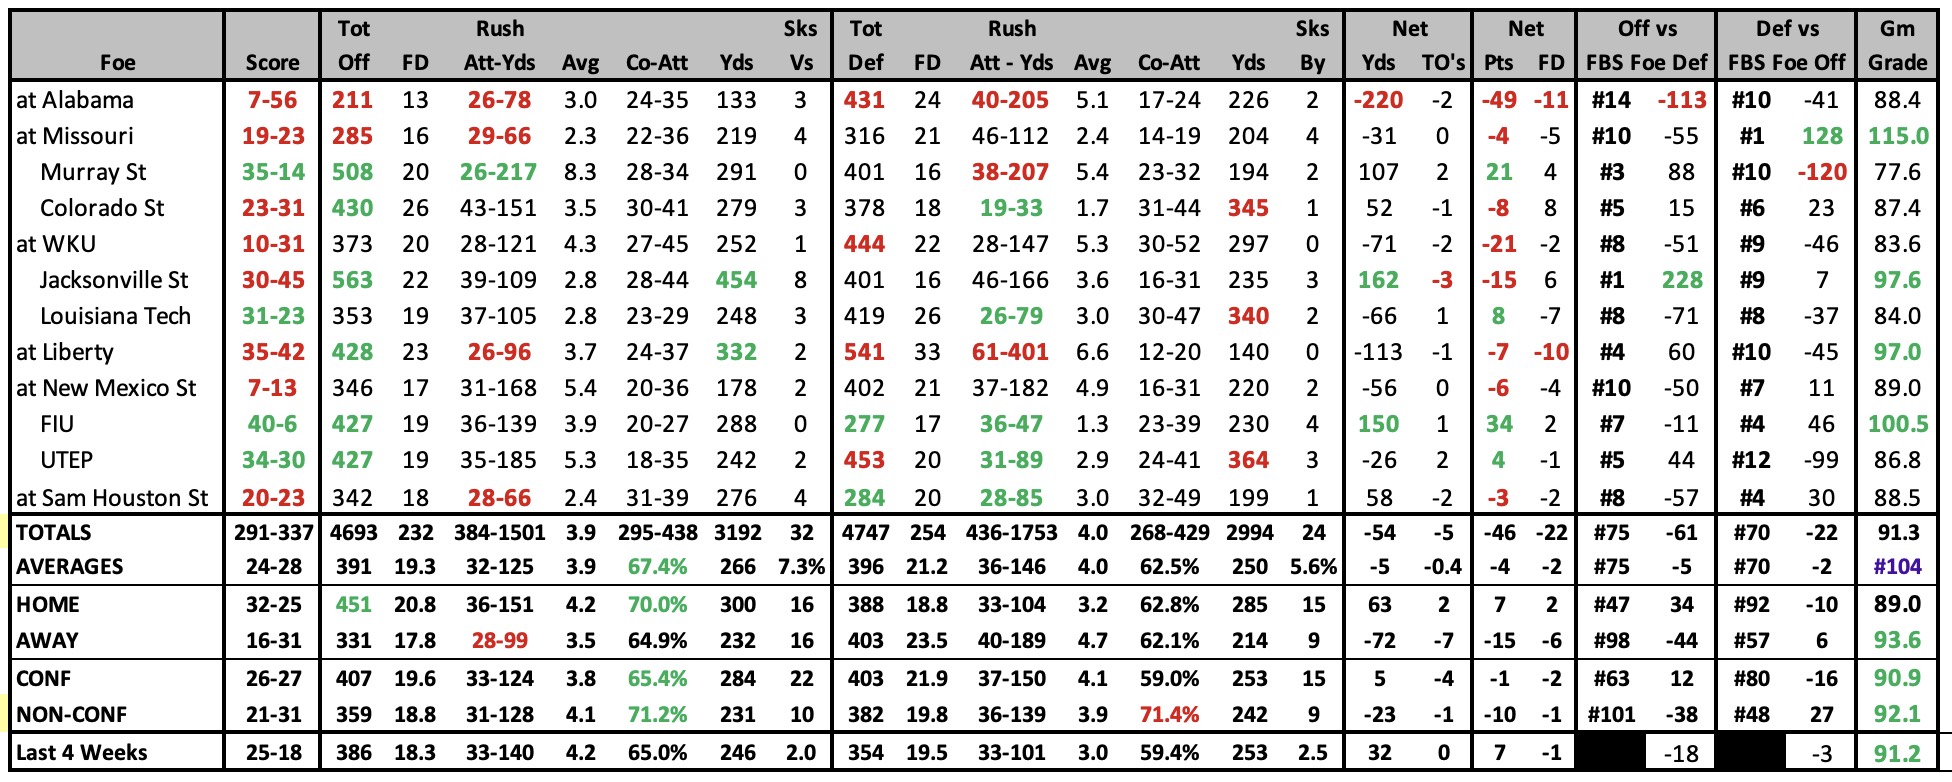
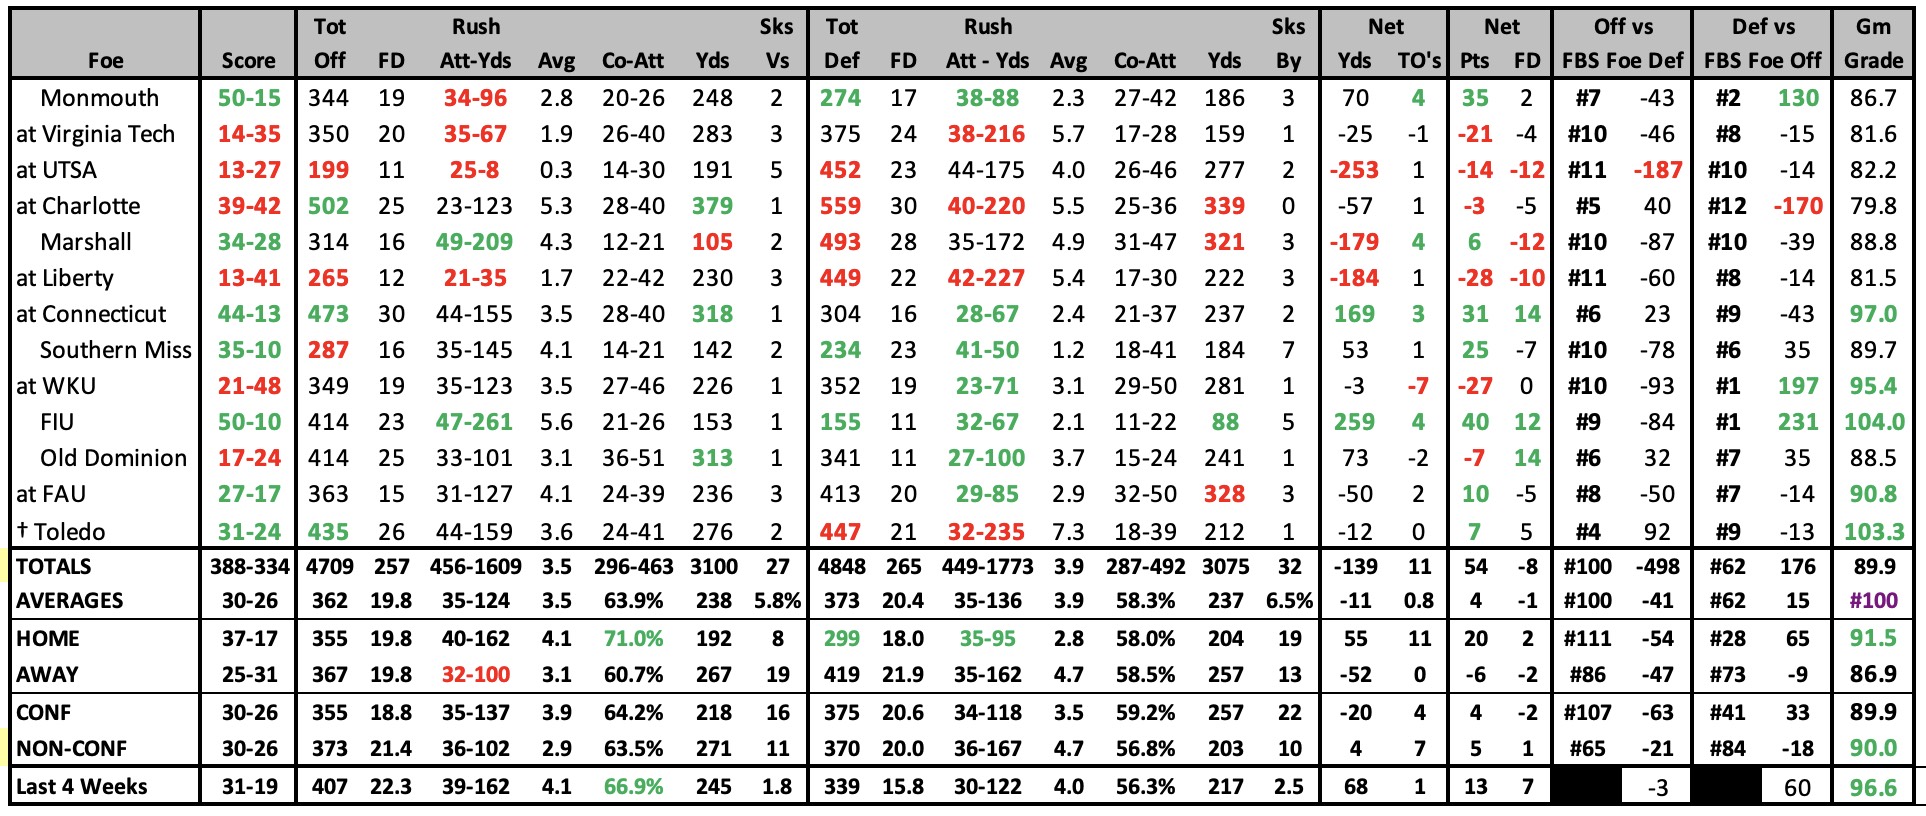
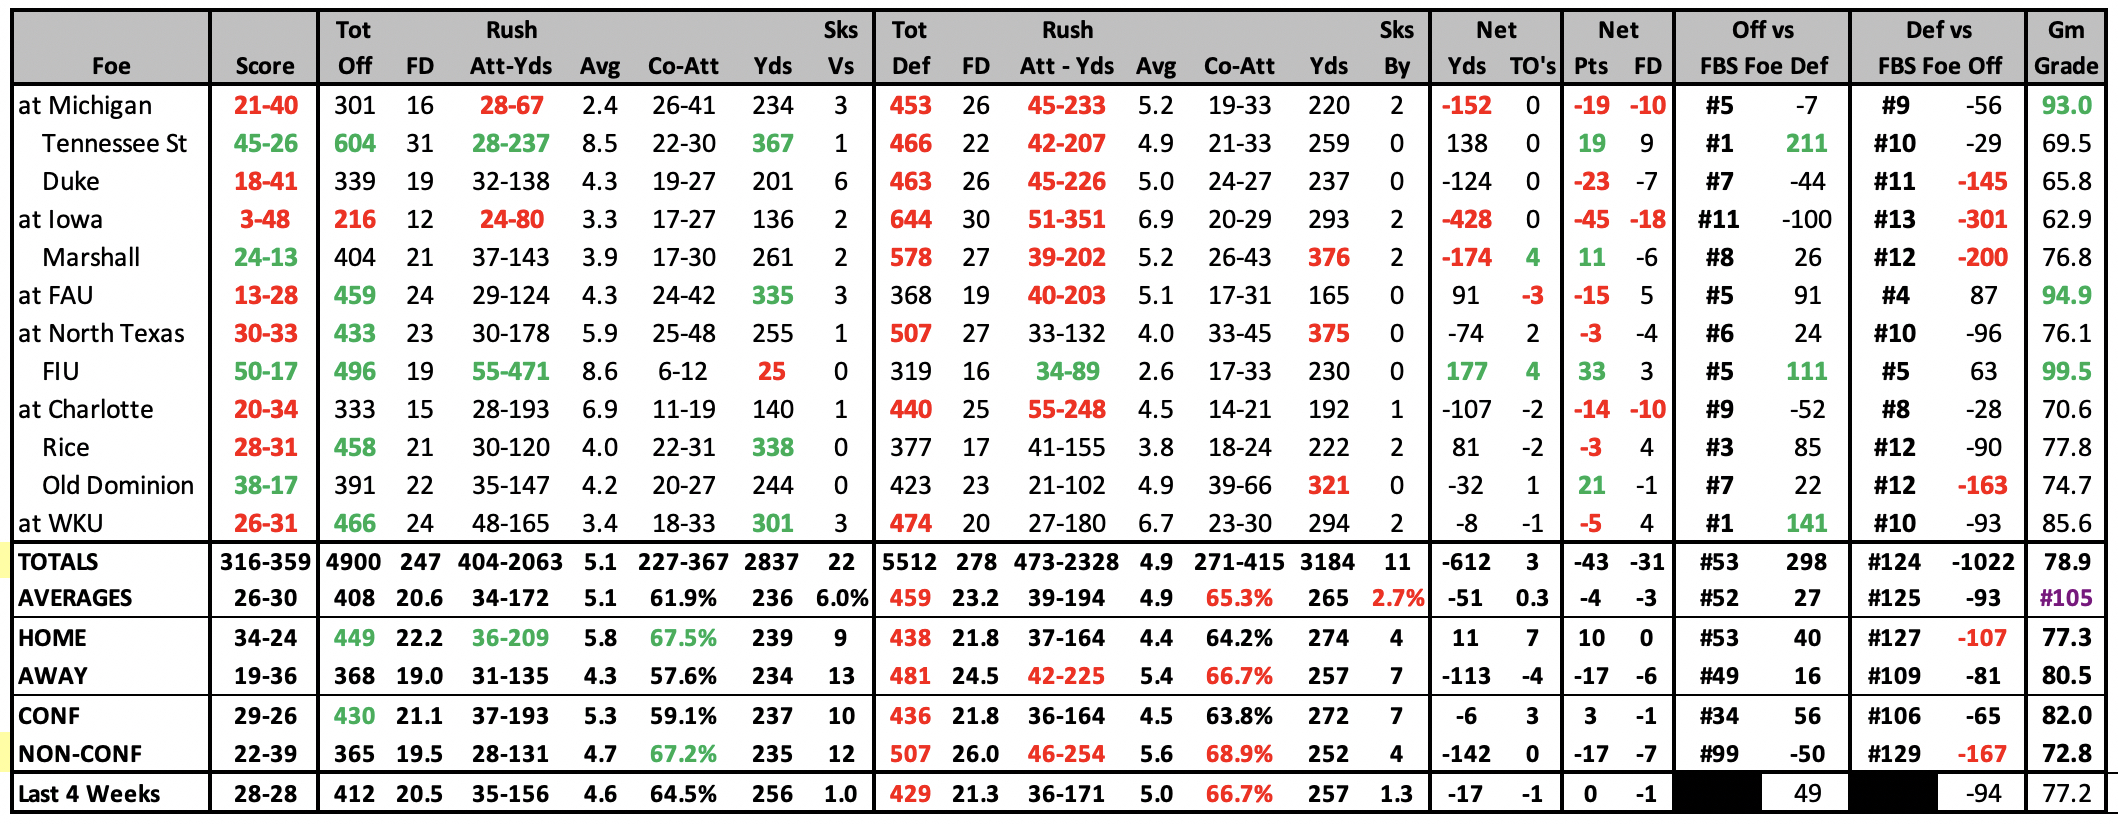
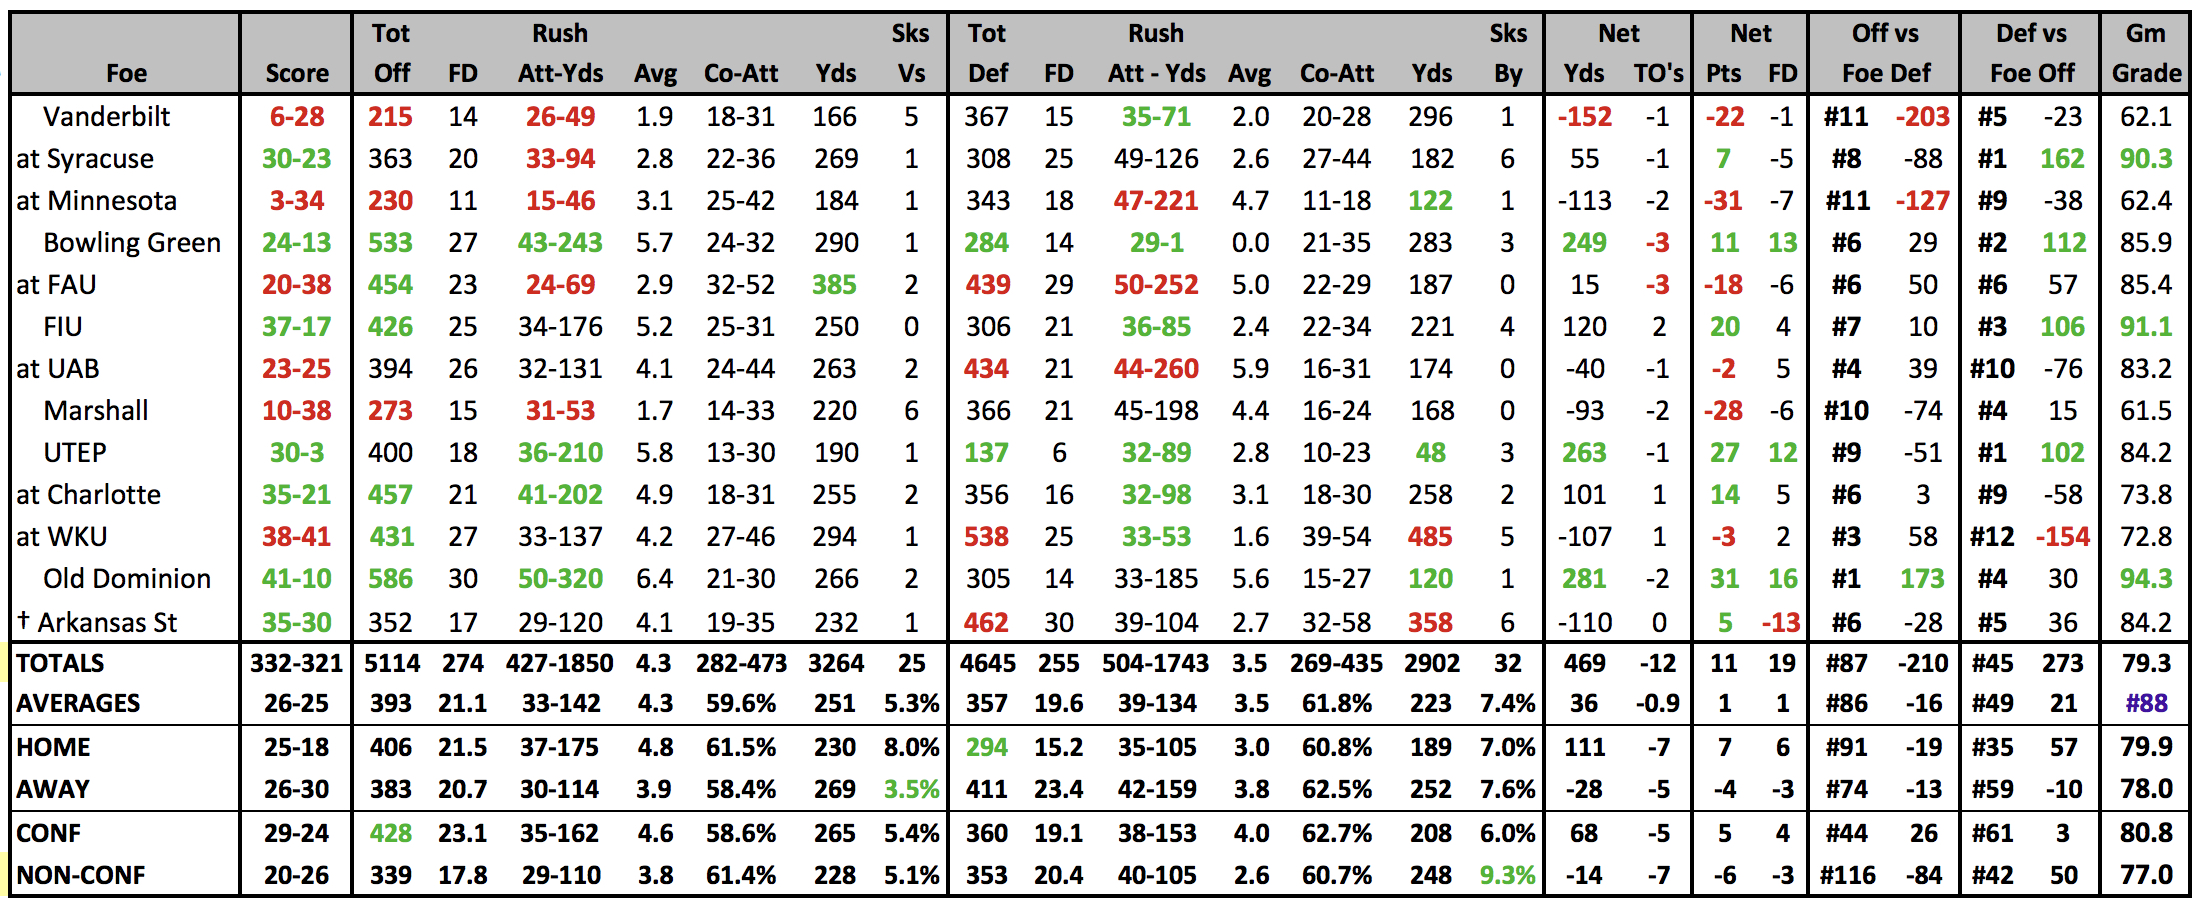
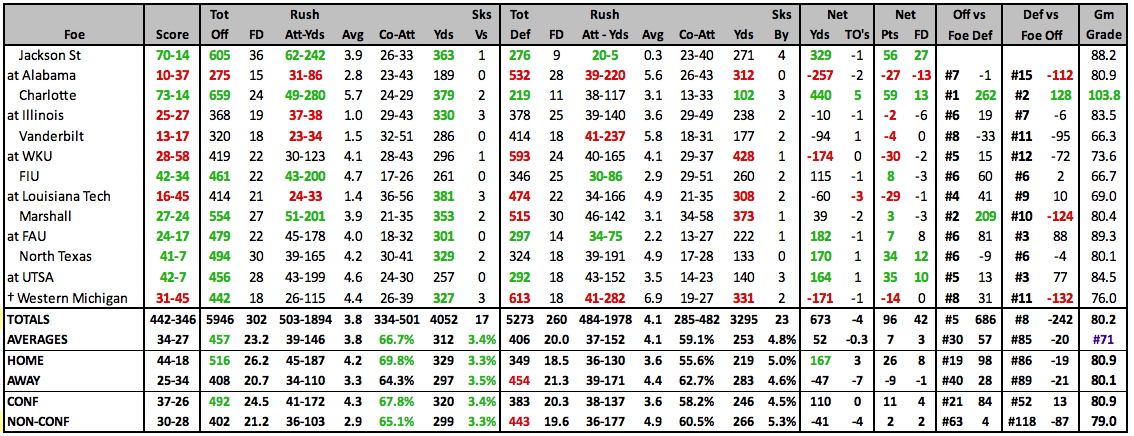
2025 GAME BY GAME STATS |
 |
2025 SCHEDULE |
2024 RESULTS |
||||||||||||||||||||||||||||||||||||||||||||||||||||||||||||||||||||||||||||||||||||||||||||||||||||||||||||||||||||||||||||||||||||||||||||||||||||||||||||||||||||||||||||||||||||||||||||||||
|
|
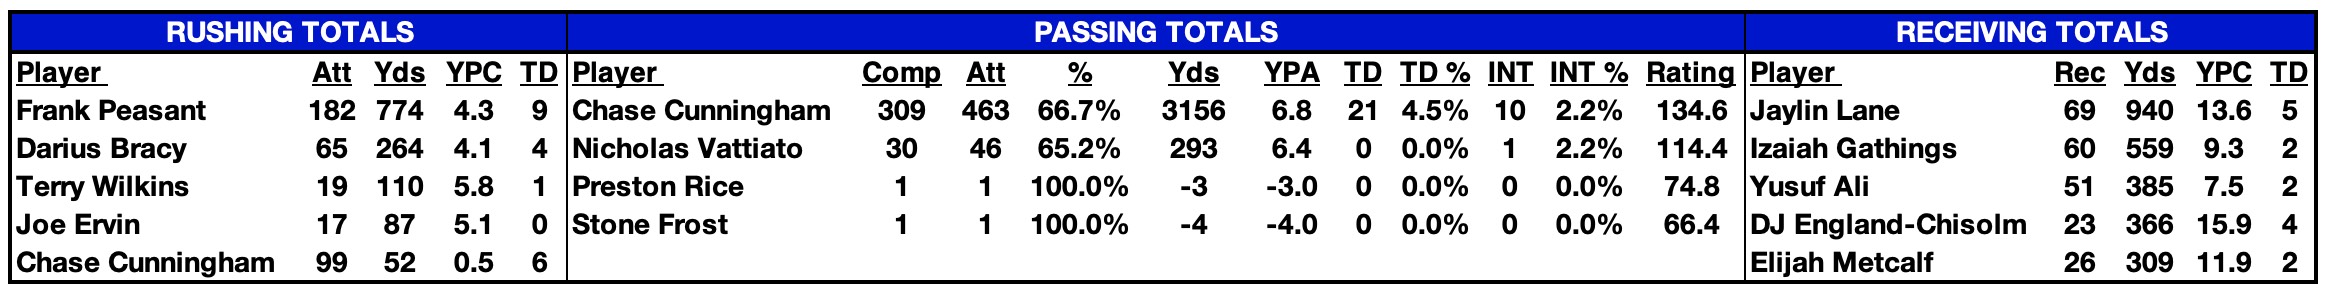
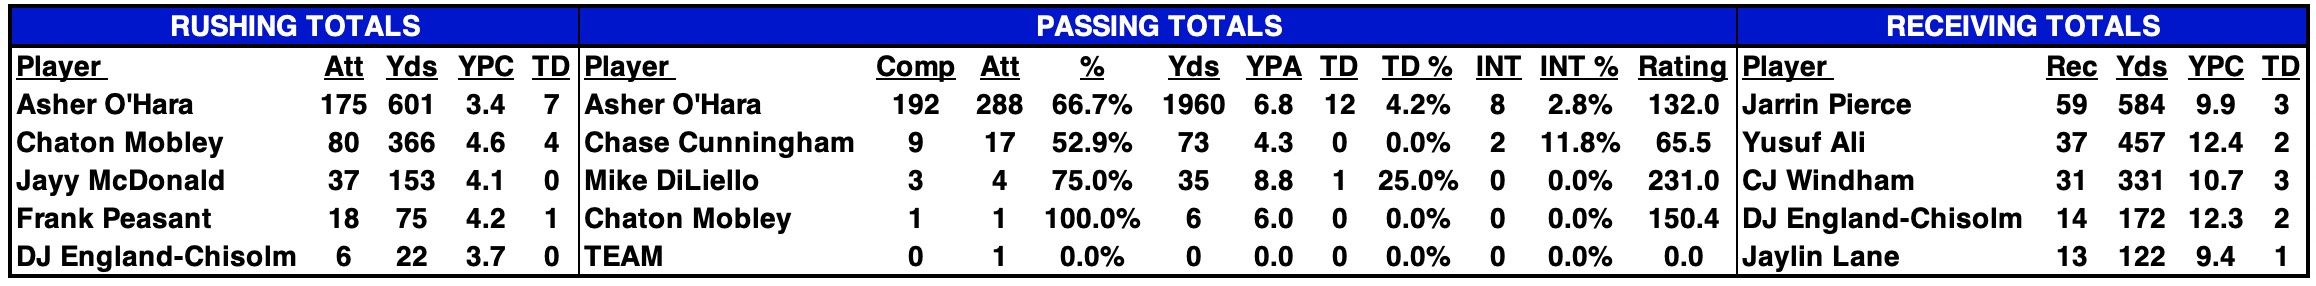
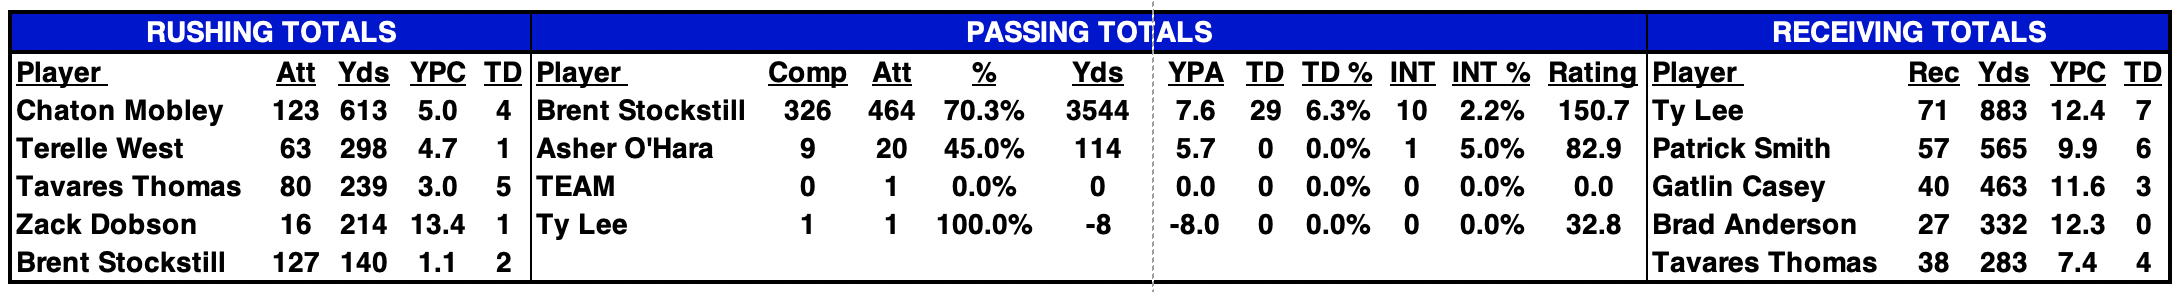
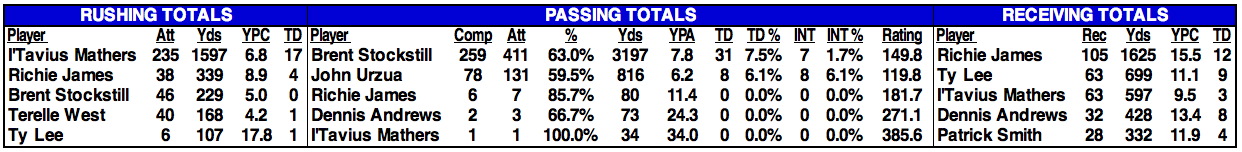
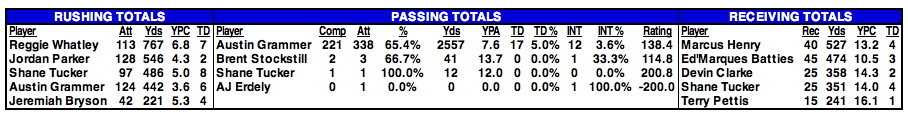
2024 STATISTICAL LEADERS |

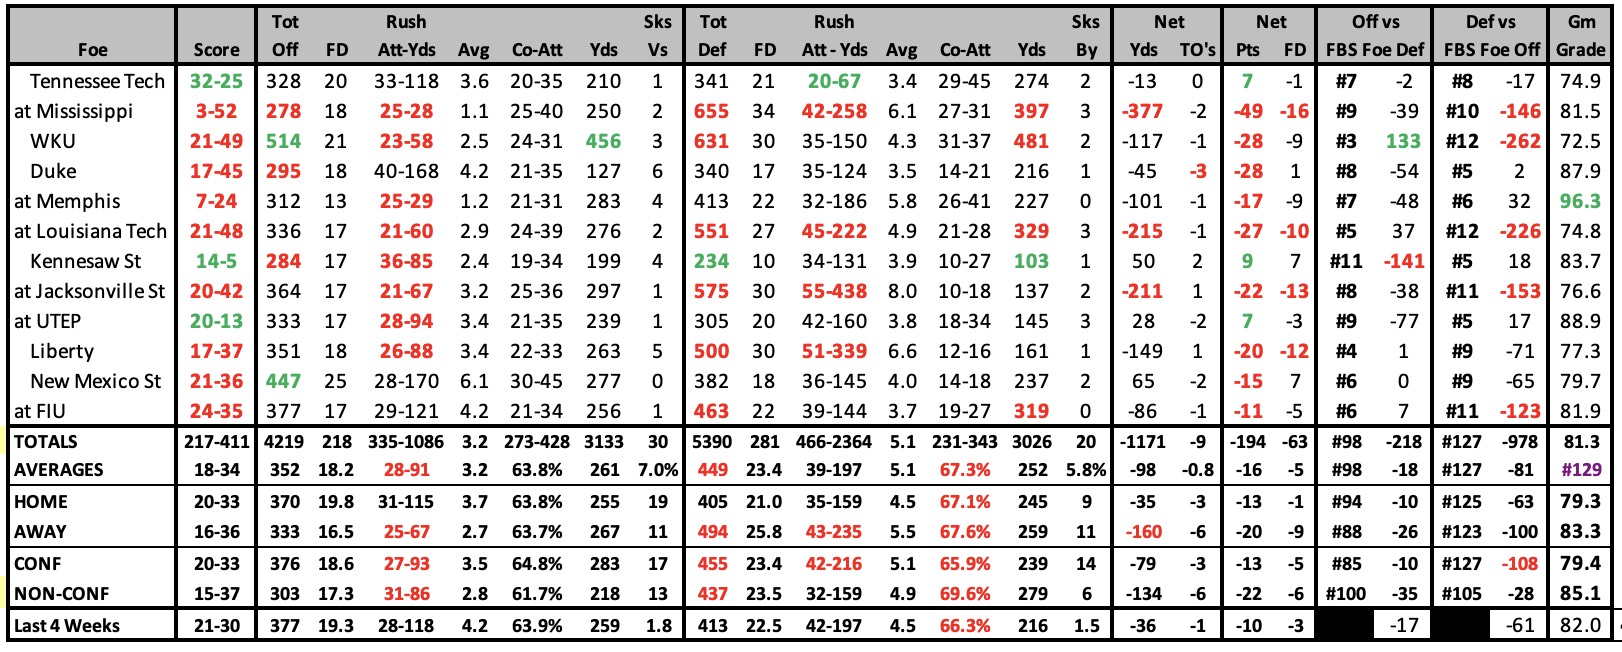
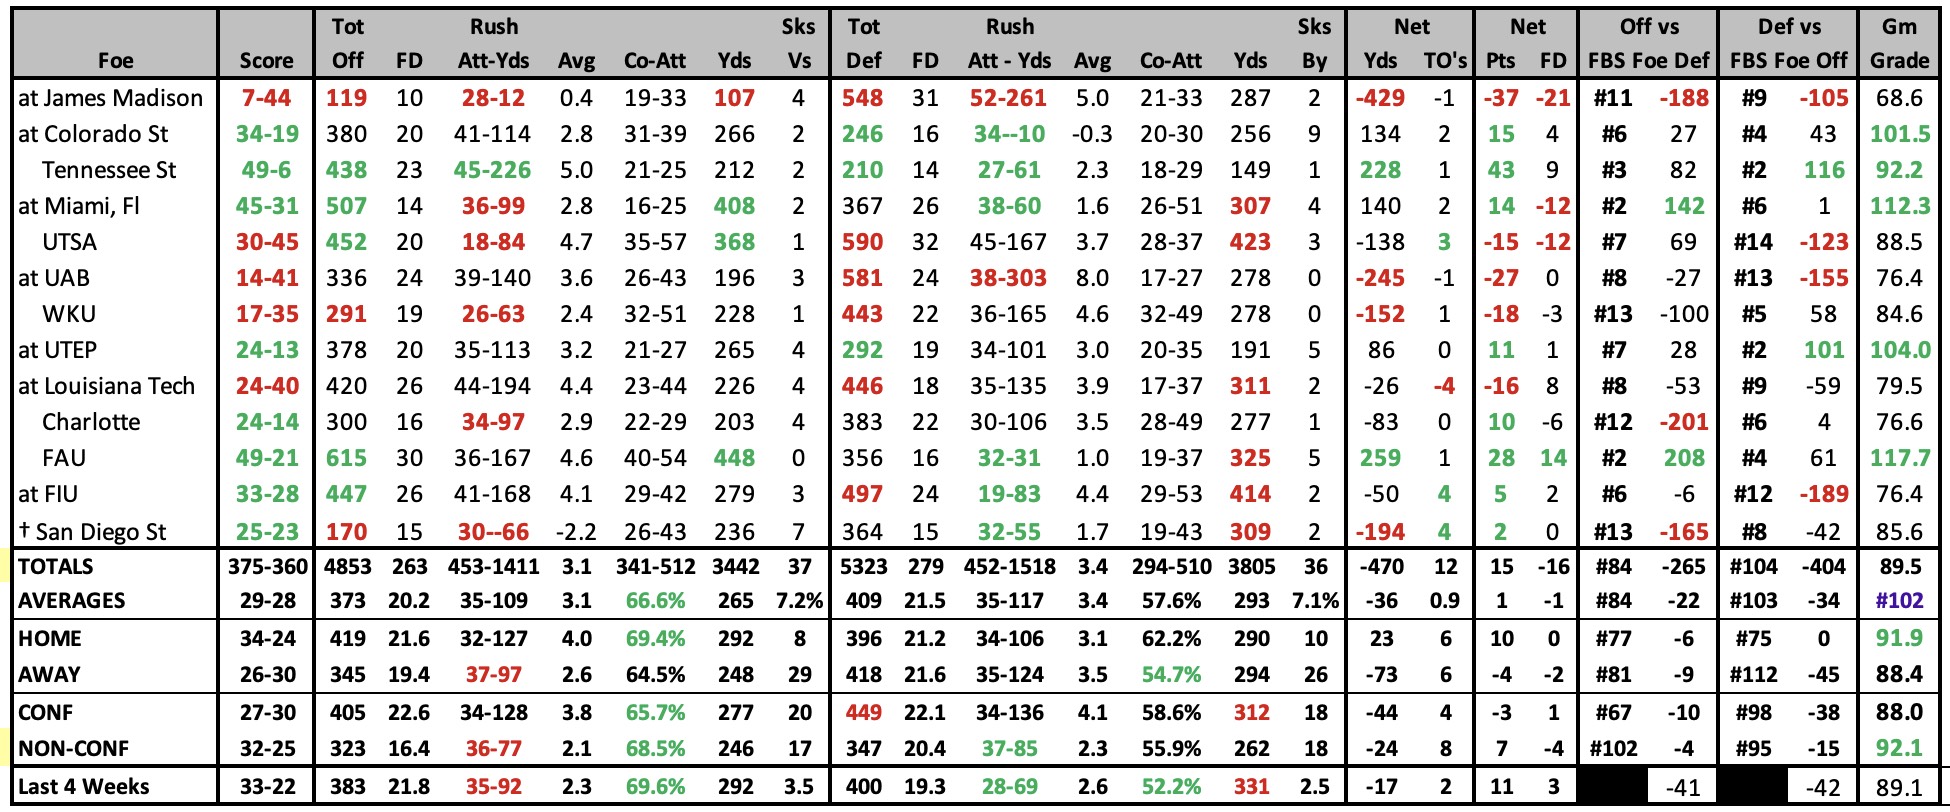
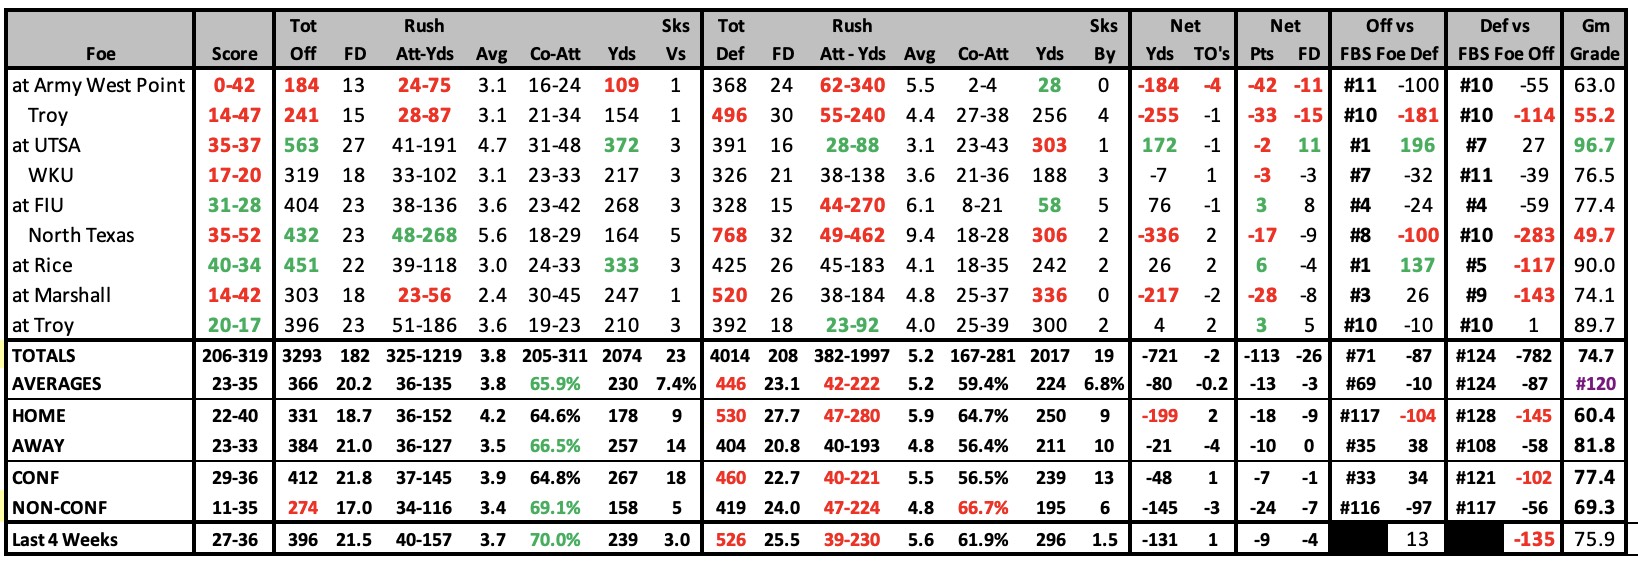
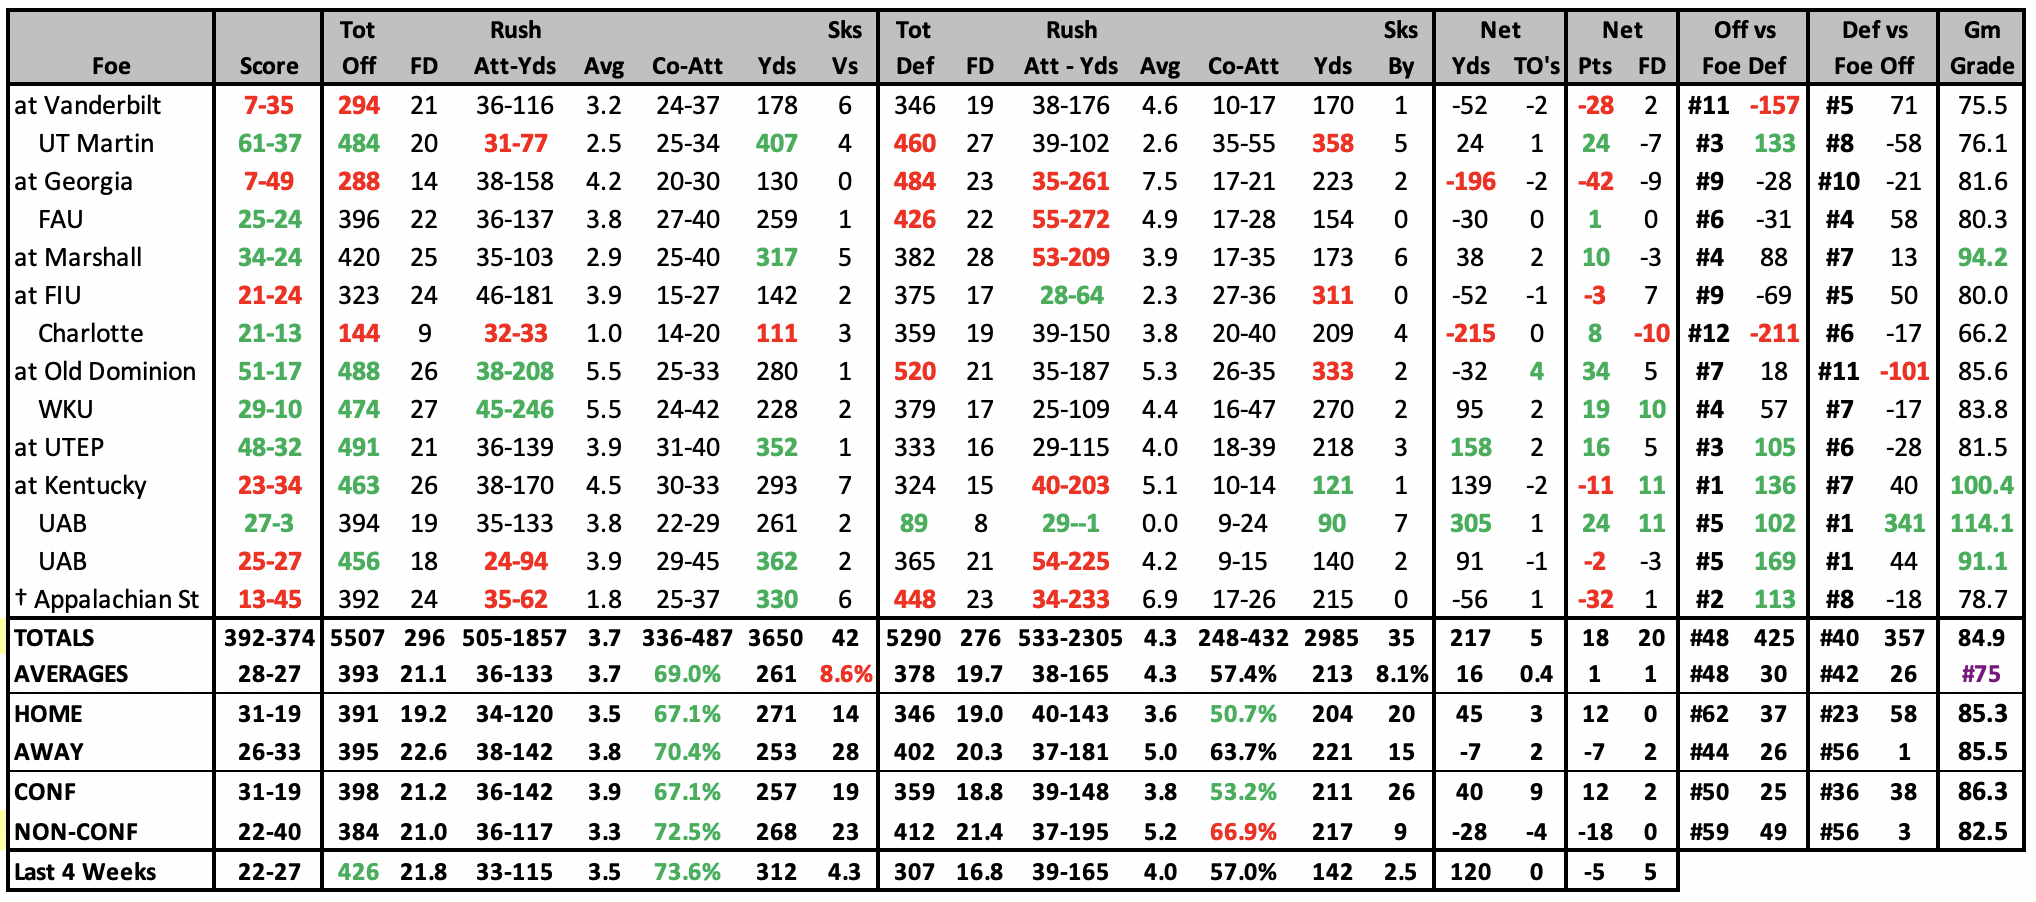
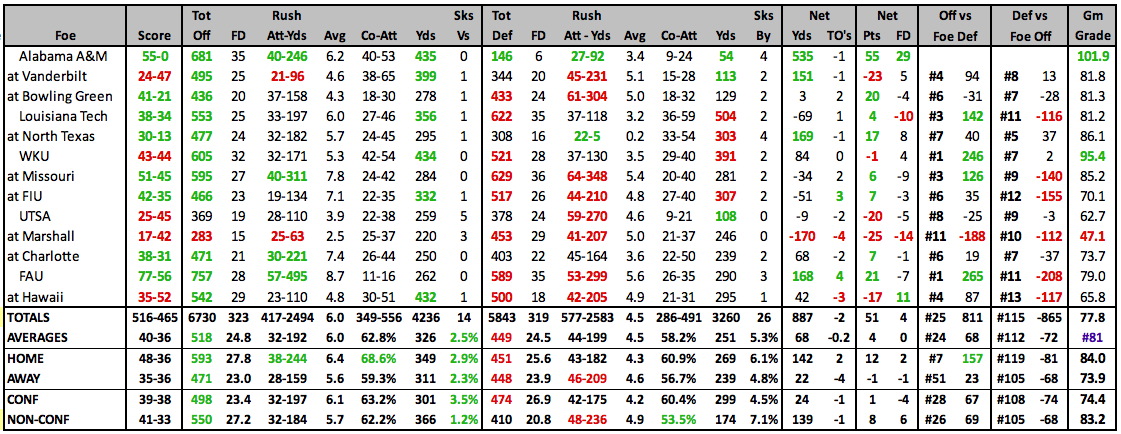
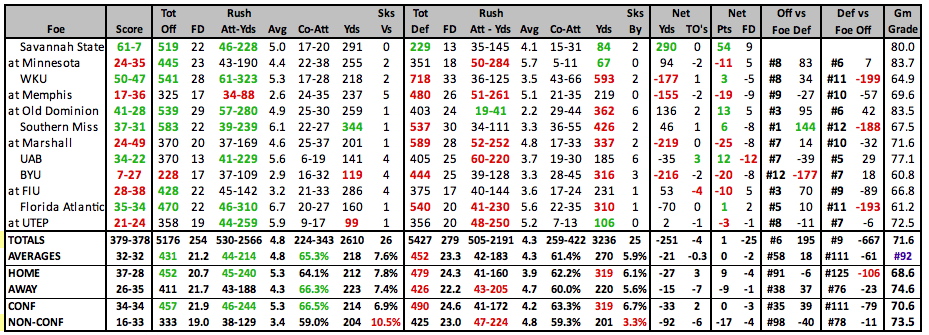
2024 GAME BY GAME STATS |
 |
2024 SCHEDULE |
2023 RESULTS |
||||||||||||||||||||||||||||||||||||||||||||||||||||||||||||||||||||||||||||||||||||||||||||||||||||||||||||||||||||||||||||||||||||||||||||||||||||||||||||||||||||||||||||||||||||||||||||||||
|
|
2023 STATISTICAL LEADERS |
2023 GAME BY GAME STATS |
 |
2023 SCHEDULE |
2022 RESULTS |
||||||||||||||||||||||||||||||||||||||||||||||||||||||||||||||||||||||||||||||||||||||||||||||||||||||||||||||||||||||||||||||||||||||||||||||||||||||||||||||||||||||||||||||||||||||||||||||||||||||
|
|
||||||||||||||||||||||||||||||||||||||||||||||||||||||||||||||||||||||||||||||||||||||||||||||||||||||||||||||||||||||||||||||||||||||||||||||||||||||||||||||||||||||||||||||||||||||||||||||||||||||
2022 STATISTICAL LEADERS |
2022 GAME BY GAME STATS |
 |
2022 SCHEDULE |
2021 RESULTS |
||||||||||||||||||||||||||||||||||||||||||||||||||||||||||||||||||||||||||||||||||||||||||||||||||||||||||||||||||||||||||||||||||||||||||||||||||||||||||||||||||||||||||||||||||||||||||||||||||||||
|
|
||||||||||||||||||||||||||||||||||||||||||||||||||||||||||||||||||||||||||||||||||||||||||||||||||||||||||||||||||||||||||||||||||||||||||||||||||||||||||||||||||||||||||||||||||||||||||||||||||||||
2021 STATISTICAL LEADERS |
2021 GAME BY GAME STATS |
 |
2021 SCHEDULE |
2020 RESULTS |
||||||||||||||||||||||||||||||||||||||||||||||||||||||||||||||||||||||||||||||||||||||||||||||||||||||||||||||||||||||||||||||||||||||||||||||||||||||||||||||||||||||||||||||||||||||||||||||||
|
|
||||||||||||||||||||||||||||||||||||||||||||||||||||||||||||||||||||||||||||||||||||||||||||||||||||||||||||||||||||||||||||||||||||||||||||||||||||||||||||||||||||||||||||||||||||||||||||||||
2020 STATISTICAL LEADERS |
2020 GAME BY GAME STATS |
 |
2020 SCHEDULE |
2019 RESULTS |
||||||||||||||||||||||||||||||||||||||||||||||||||||||||||||||||||||||||||||||||||||||||||||||||||||||||||||||||||||||||||||||||||||||||||||||||||||||||||||||||||||||||||||||||||||||||||||||||
|
|
2019 STATISTICAL LEADERS |
2019 GAME BY GAME STATS |
 |
2019 SCHEDULE |
2018 RESULTS |
||||||||||||||||||||||||||||||||||||||||||||||||||||||||||||||||||||||||||||||||||||||||||||||||||||||||||||||||||||||||||||||||||||||||||||||||||||||||||||||||||||||||||||||||||||||||||||||||||||||||||||||||||||||||||||||
|
|
||||||||||||||||||||||||||||||||||||||||||||||||||||||||||||||||||||||||||||||||||||||||||||||||||||||||||||||||||||||||||||||||||||||||||||||||||||||||||||||||||||||||||||||||||||||||||||||||||||||||||||||||||||||||||||||
2018 STATISTICAL LEADERS |
2018 GAME BY GAME STATS |
 |
2018 SCHEDULE |
2017 RESULTS |
|||||||||||||||||||||||||||||||||||||||||||||||||||||||||||||||||||||||||||||||||||||||||||||||||||||||||||||||||||||||||||||||||||||||||||||||||||||||||||||||||||||||||||||||||||||||||||||||||||||||||||||||||||||||||||||||||||||||||||||||||||||
|
|
|||||||||||||||||||||||||||||||||||||||||||||||||||||||||||||||||||||||||||||||||||||||||||||||||||||||||||||||||||||||||||||||||||||||||||||||||||||||||||||||||||||||||||||||||||||||||||||||||||||||||||||||||||||||||||||||||||||||||||||||||||||
2017 STATISTICAL LEADERS |
2017 GAME BY GAME STATS |
 |
2017 SCHEDULE |
2016 RESULTS |
||||||||||||||||||||||||||||||||||||||||||||||||||||||||||||||||||||||||||||||||||||||||||||||||||||||||||||||||||||||||||||||||||||||||||||||||||||||||||||||||||||||||||||||||||||||||||||||||||||||||||||||||||||||||||||||||||||||||||||||
|
|
||||||||||||||||||||||||||||||||||||||||||||||||||||||||||||||||||||||||||||||||||||||||||||||||||||||||||||||||||||||||||||||||||||||||||||||||||||||||||||||||||||||||||||||||||||||||||||||||||||||||||||||||||||||||||||||||||||||||||||||
2016 STATISTICAL LEADERS |
2016 GAME BY GAME STATS |
 |
2015 STATISTICAL LEADERS |
2015 GAME BY GAME STATS |
 |
2015 SCHEDULE |
2014 RESULTS |
||||||||||||||||||||||||||||||||||||||||||||||||||||||||||||||||||||||||||||||||||||||||||||||||||||||||||||||||||||||||||||||||||||||||||||||||||||||||||||||||||||||||||||||||||||||||||||||||||||||||||||||||||||||||||||||||||||||||||||||
|
|
||||||||||||||||||||||||||||||||||||||||||||||||||||||||||||||||||||||||||||||||||||||||||||||||||||||||||||||||||||||||||||||||||||||||||||||||||||||||||||||||||||||||||||||||||||||||||||||||||||||||||||||||||||||||||||||||||||||||||||||
2014 STATISTICAL LEADERS |
2014 GAME BY GAME STATS |
 |
2013 STATISTICAL LEADERS |
| Player | Att | Yds | YPC | TD | Player | Comp | Att | % | Yds | YPA | TD | INT | Rating | Player | Rec | Yds | YPC | TD |
| Jordan Parker | 146 | 731 | 5.0 | 6 | Logan Kilgore | 216 | 355 | 60.8% | 2507 | 7.1 | 16 | 13 | 127.7 | Tavarres Jefferson | 46 | 611 | 13.3 | 5 |
| Reggie Whatley | 101 | 657 | 6.5 | 3 | Austin Grammer | 22 | 46 | 47.8% | 200 | 4.3 | 1 | 2 | 82.8 | Marcus Henry | 38 | 549 | 14.4 | 3 |
| Jeremiah Bryson | 82 | 398 | 4.9 | 3 | Kyle Griswould | 0 | 1 | 0.0% | 0 | 0.0 | 0 | 0 | 0.0 | Kyle Griswould | 45 | 465 | 10.3 | 4 |
2013 GAME BY GAME STATS |
 |
2013 RESULTS |
2012 RESULTS |
||||||||||||||||||||||||||||||||||||||||||||||||||||||||||||||||||||||||||||||||||||||||||||||||||||||||||||||||||||||||||||||||||||||||||||||||||||||||||||||||||||||||||||||||||||||||||||||||||||||||||||||||||||||||||||||||||||||||||||||||||||||||||||||||||||||||||||||
|
|
||||||||||||||||||||||||||||||||||||||||||||||||||||||||||||||||||||||||||||||||||||||||||||||||||||||||||||||||||||||||||||||||||||||||||||||||||||||||||||||||||||||||||||||||||||||||||||||||||||||||||||||||||||||||||||||||||||||||||||||||||||||||||||||||||||||||||||||
2012 STATISTICAL LEADERS |
| Player | Att | Yds | YPC | TD | Player | Comp | Att | % | Yds | YPA | TD | INT | Rating | Player | Rec | Yds | YPC | TD | ||
| Jordan Parker | 166 | 851 | 5.1 | 3 | Logan Kilgore | 212 | 335 | 63.3% | 2571 | 7.7 | 16 | 6 | 139.9 | Anthony Amos | 72 | 992 | 13.8 | 9 | ||
| Benny Cunningham | 100 | 629 | 6.3 | 11 | Jeff Murphy | 5 | 8 | 62.5% | 22 | 2.8 | 0 | 1 | 60.6 | Kyle Griswould | 45 | 531 | 11.8 | 3 | ||
| Drayton Calhoun | 77 | 270 | 3.5 | 2 | Cameron Deen | 0 | 1 | 0.0% | 0 | 0.0 | 0 | 1 | -200.0 | Christian Collis | 18 | 206 | 11.4 | 2 |
| 2012 Individual Player Stats • 2012 Start Chart/Starters Lost |
|---|
2012 GAME BY GAME STATS |
 |
2011 STATISTICAL LEADERS |
| Player | Att | Yds | YPC | TD | Player | Comp | Att | % | Yds | YPA | TD | INT | Rating | Player | Rec | Yds | YPC | TD | ||
| William Pratcher | 122 | 585 | 4.8 | 2 | Logan Kilgore | 212 | 363 | 58.4% | 2237 | 6.2 | 18 | 12 | 119.9 | Malcolm Beyah | 45 | 497 | 11.0 | 6 | ||
| Benny Cunningham | 115 | 501 | 4.4 | 4 | Jeff Murphy | 84 | 140 | 60.0% | 794 | 5.7 | 3 | 3 | 110.4 | Tavarres Jefferson | 51 | 398 | 7.8 | 1 | ||
| DD Kyles | 67 | 312 | 4.7 | 3 | Andrew Banks | 1 | 1 | 100.0% | 27 | 27.0 | 0 | 0 | 326.8 | Kyle Griswould | 31 | 390 | 12.6 | 1 |
| 2011 Individual Player Stats • 2011 START CHART/STARTERS LOST |
|---|
2011 GAME BY GAME STATS |
2011 RESULTS |
2010 RESULTS |
|||||||||||||||||||||||||||||||||||||||||||||||||||||||||||||||||||||||||||||||||||||||||||||||||||||||||||||||||||||||||||||||||||||||||||||||||||||||||||||||||||||||||||||||||||||||||||||
|
|
|||||||||||||||||||||||||||||||||||||||||||||||||||||||||||||||||||||||||||||||||||||||||||||||||||||||||||||||||||||||||||||||||||||||||||||||||||||||||||||||||||||||||||||||||||||||||||||
2010 STATISTICAL LEADERS |
| Player | Att | Yds | YPC | TD | Player | Comp | Att | % | Yds | YPA | TD | INT | Rating | Player | Rec | Yds | YPC | TD | ||
| Phillip Tanner | 161 | 939 | 5.8 | 13 | Dwight Dasher | 144 | 250 | 57.6% | 1539 | 6.2 | 6 | 18 | 102.8 | Malcolm Beyah | 29 | 388 | 13.4 | 2 | ||
| Dwight Dasher | 142 | 543 | 3.8 | 8 | Logan Kilgore | 50 | 80 | 62.5% | 540 | 6.8 | 3 | 5 | 119.1 | Garrett Andrews | 34 | 377 | 11.1 | 2 | ||
| DD Kyles | 77 | 414 | 5.4 | 4 | Jeff Murphy | 31 | 53 | 58.5% | 395 | 7.5 | 0 | 1 | 117.3 | Sancho McDonald | 21 | 321 | 15.3 | 1 |
| 2010 Individual Player Stats |
|---|
2010 GAME BY GAME STATS |
2009 STATISTICAL LEADERS |
| Player | Att | Yds | YPC | TD | Player | Comp | Att | % | Yds | YPA | TD | INT | Rating | Player | Rec | Yds | YPC | TD | ||
| Dwight Dasher | 198 | 953 | 4.81 | 11 | Dwight Dasher | 204 | 374 | 54.5% | 2627 | 7.0 | 21 | 14 | 124.6 | Chris McClover | 31 | 486 | 15.7 | 4 | ||
| DD Kyles | 127 | 822 | 6.47 | 3 | Brent Burnette | 11 | 22 | 50.0% | 115 | 5.2 | 1 | 0 | 108.9 | Garrett Andrews | 31 | 479 | 15.5 | 3 | ||
| B Cunningham | 41 | 162 | 3.95 | 1 | Desmond Gee | 2 | 3 | 66.7% | 56 | 18.7 | 0 | 0 | 223.5 | P Honeycutt | 36 | 411 | 11.4 | 4 |
| 2009 Individual Player Stats |
|---|
2009 GAME BY GAME STATS |
2009 RESULTS |
2008 RESULTS |
|||||||||||||||||||||||||||||||||||||||||||||||||||||||||||||||||||||||||||||||||||||||||||||||||||||||||||||||||||||||||||||||||||||||||||||||||||||||||||||||||||||
|
|
|||||||||||||||||||||||||||||||||||||||||||||||||||||||||||||||||||||||||||||||||||||||||||||||||||||||||||||||||||||||||||||||||||||||||||||||||||||||||||||||||||||
| 2008 Individual Player Stats • 2007 Individual Player Stats |
|---|