| NEW MEXICO STATE AGGIES |
|---|
|
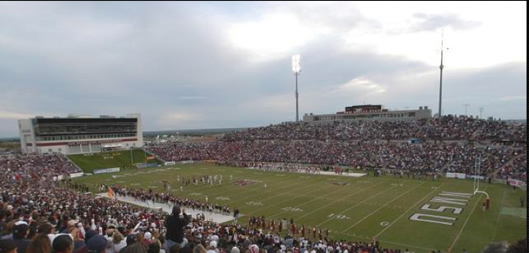
STADIUM: Aggie Memorial Stadium |
 |
|
| LOCATION: Las Cruces, NM | |
| FOUNDED: 1888 | |
| ENROLLMENT: 11,230 | |
| COLORS: Crimson & White | |
| MASCOT: Aggies | |
| CONFERENCE: CUSA | |
| Head Coach: Tony Sanchez | |
| Years with team: 2nd | |
| Overall Record: 23-49 | |
| Record with Tm: 3-9 |
| 2025 Individual Player Stats |
2025 Start Chart |
Last 40+ Years Results |
Last 20 Years - Leaders |
Draft History |
|---|
| 2025 STATISTICAL LEADERS |
|---|

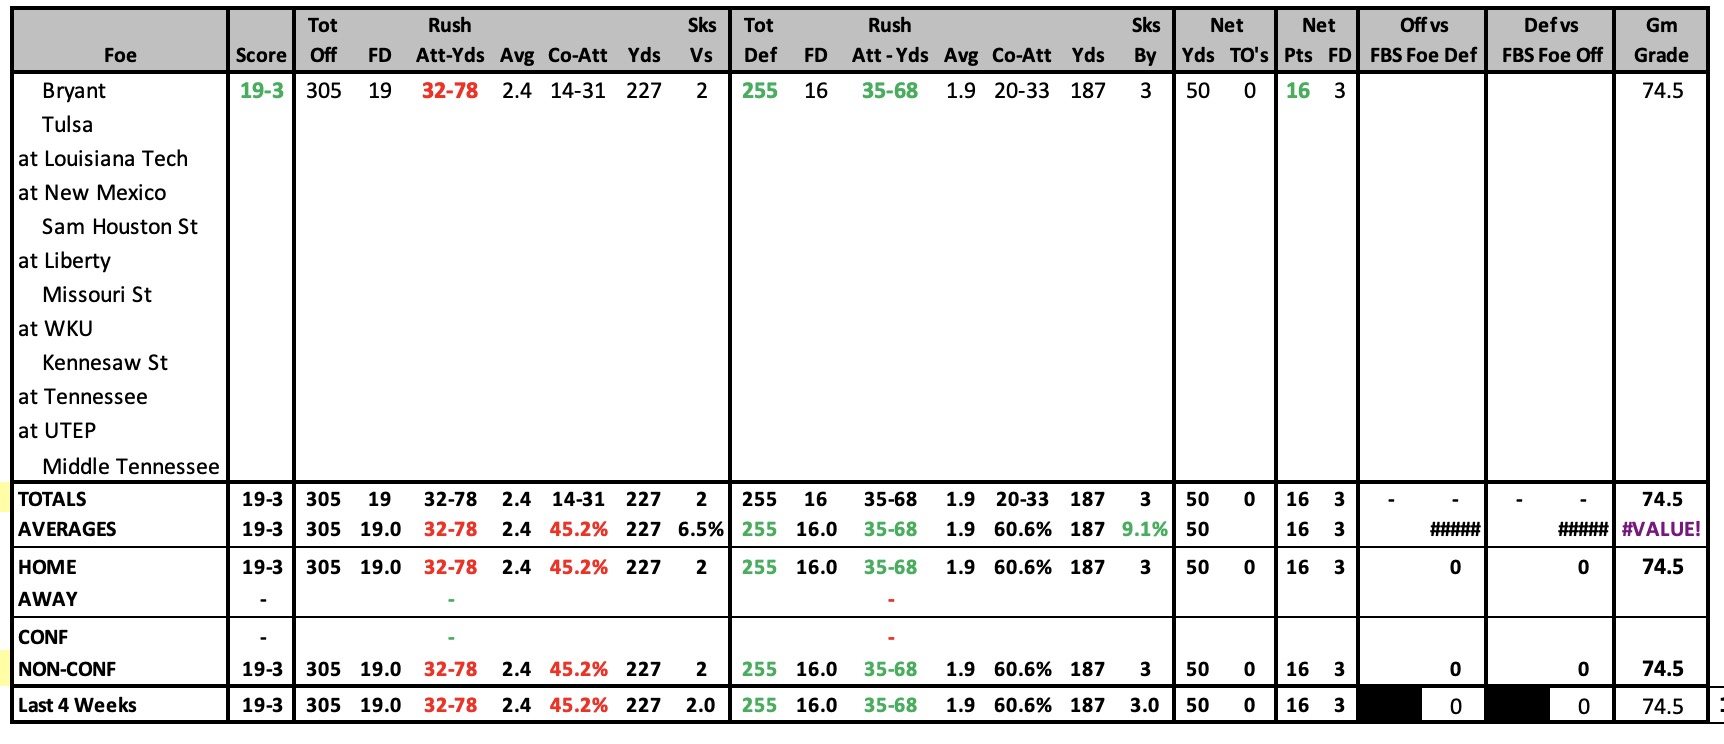
| 2025 GAME-BY-GAME STATS |
|---|
 |
2025 SCHEDULE |
2024 RESULTS |
||||||||||||||||||||||||||||||||||||||||||||||||||||||||||||||||||||||||||||||||||||||||||||||||||||||||||||||||||||||||||||||||||||||||||||||||||||||||||||||||||||||||||||||||||||||||||||||||
|
|
| 2024 STATISTICAL LEADERS |
|---|

| 2024 Individual Player Stats |
2024 Start Chart |
|---|
| 2024 GAME-BY-GAME STATS |
|---|
 |
2024 SCHEDULE |
2023 RESULTS |
||||||||||||||||||||||||||||||||||||||||||||||||||||||||||||||||||||||||||||||||||||||||||||||||||||||||||||||||||||||||||||||||||||||||||||||||||||||||||||||||||||||||||||||||||||||||||||||||||||||||||||||||||
|
|
||||||||||||||||||||||||||||||||||||||||||||||||||||||||||||||||||||||||||||||||||||||||||||||||||||||||||||||||||||||||||||||||||||||||||||||||||||||||||||||||||||||||||||||||||||||||||||||||||||||||||||||||||
| 2023 STATISTICAL LEADERS |
|---|

| 2023 Individual Player Stats |
2023 Start Chart |
|---|
| 2023 GAME-BY-GAME STATS |
|---|
 |
2023 SCHEDULE |
2022 RESULTS |
||||||||||||||||||||||||||||||||||||||||||||||||||||||||||||||||||||||||||||||||||||||||||||||||||||||||||||||||||||||||||||||||||||||||||||||||||||||||||||||||||||||||||||||||||||||||||||||||||||||||||||||||||||||||||||||
|
|
||||||||||||||||||||||||||||||||||||||||||||||||||||||||||||||||||||||||||||||||||||||||||||||||||||||||||||||||||||||||||||||||||||||||||||||||||||||||||||||||||||||||||||||||||||||||||||||||||||||||||||||||||||||||||||||
| 2022 STATISTICAL LEADERS |
|---|

| 2022 Individual Player Stats |
2022 Start Chart |
|---|
| 2022 GAME-BY-GAME STATS |
|---|
 |
2022 SCHEDULE |
2021 RESULTS |
||||||||||||||||||||||||||||||||||||||||||||||||||||||||||||||||||||||||||||||||||||||||||||||||||||||||||||||||||||||||||||||||||||||||||||||||||||||||||||||||||||||||||||||||||||||||||||||||||||||||||||
|
|
||||||||||||||||||||||||||||||||||||||||||||||||||||||||||||||||||||||||||||||||||||||||||||||||||||||||||||||||||||||||||||||||||||||||||||||||||||||||||||||||||||||||||||||||||||||||||||||||||||||||||||
| 2021 STATISTICAL LEADERS |
|---|

| 2021 Individual Player Stats |
2021 Start Chart |
|---|
| 2021 GAME-BY-GAME STATS |
|---|
 |
2021 SCHEDULE |
2021 Spring RESULTS |
||||||||||||||||||||||||||||||||||||||||||||||||||||||||||||||||||||||||||||||||||||||||||||||||||||||||||||||||||||||||
|
|
| 2021 SPRING STATISTICAL LEADERS |
|---|

| 2021 Spring Individual Player Stats |
2021 Spring Start Chart (Not Available) |
|---|
| 2021 SPRING GAME-BY-GAME STATS |
|---|
 |
2021 SPRING SCHEDULE |
2019 RESULTS |
||||||||||||||||||||||||||||||||||||||||||||||||||||||||||||||||||||||||||||||||||||||||||||||||||||||||||||||||||||||||||||||||||||||||||||||||||||||||||||||||||||||||||||||||||||||||||||||||
|
|
| 2019 STATISTICAL LEADERS |
|---|

| 2019 Individual Player Stats |
2019 Start Chart |
|---|
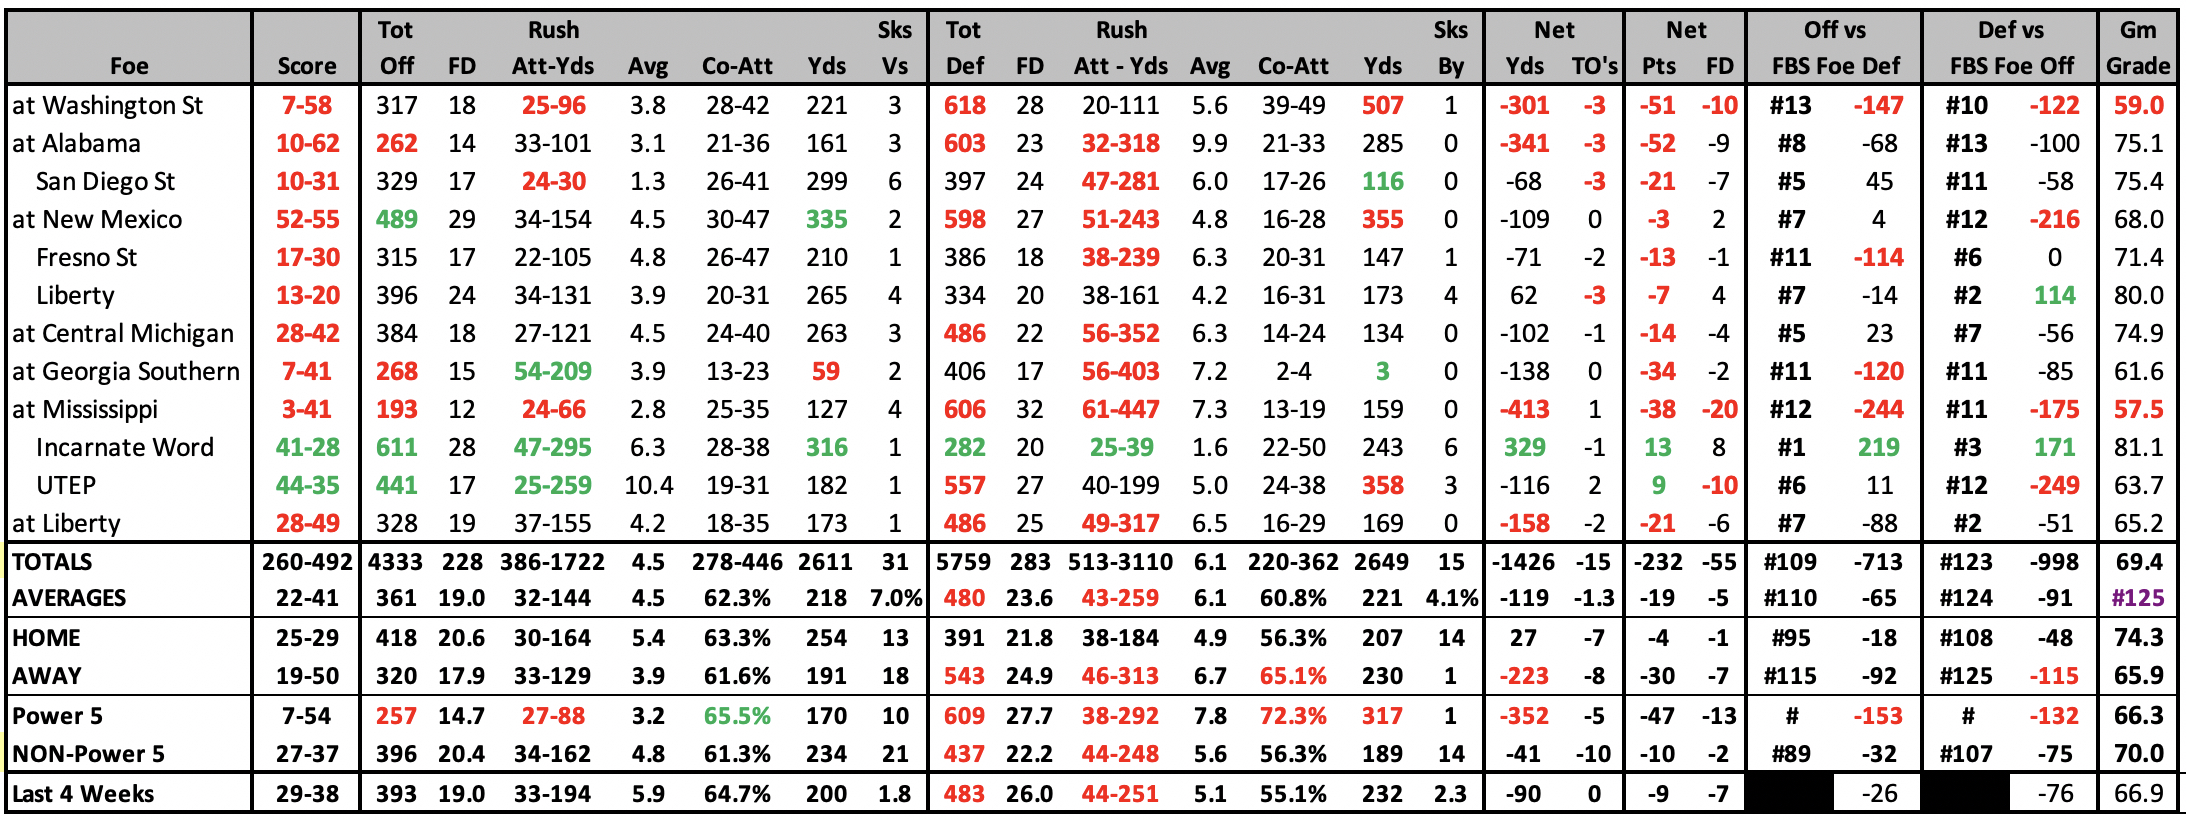
| 2019 GAME-BY-GAME STATS |
|---|
 |
2019 SCHEDULE |
2018 RESULTS |
|||||||||||||||||||||||||||||||||||||||||||||||||||||||||||||||||||||||||||||||||||||||||||||||||||||||||||||||||||||||||||||||||||||||||||||||||||||||||||||||||||||||||||||||||||||||||||||||||||||||||
|
|
| 2018 STATISTICAL LEADERS |
|---|

| 2018 Individual Player Stats |
2018 Start Chart |
|---|
| 2018 GAME-BY-GAME STATS |
|---|
 |
2018 SCHEDULE |
2017 RESULTS |
||||||||||||||||||||||||||||||||||||||||||||||||||||||||||||||||||||||||||||||||||||||||||||||||||||||||||||||||||||||||||||||||||||||||||||||||||||||||||||||||||||||||||||||||||||||||||||||||||||||||||||||||||||||||||||||||
|
|
||||||||||||||||||||||||||||||||||||||||||||||||||||||||||||||||||||||||||||||||||||||||||||||||||||||||||||||||||||||||||||||||||||||||||||||||||||||||||||||||||||||||||||||||||||||||||||||||||||||||||||||||||||||||||||||||
| 2017 STATISTICAL LEADERS |
|---|

| 2017 Individual Player Stats |
2017 Start Chart |
|---|
| 2017 GAME-BY-GAME STATS |
|---|
 |
2017 SCHEDULE |
2016 RESULTS |
||||||||||||||||||||||||||||||||||||||||||||||||||||||||||||||||||||||||||||||||||||||||||||||||||||||||||||||||||||||||||||||||||||||||||||||||||||||||||||||||||||||||||||||||||||||||||||||||||||||||||||||||||||||||||||||||
|
|
||||||||||||||||||||||||||||||||||||||||||||||||||||||||||||||||||||||||||||||||||||||||||||||||||||||||||||||||||||||||||||||||||||||||||||||||||||||||||||||||||||||||||||||||||||||||||||||||||||||||||||||||||||||||||||||||
| 2016 STATISTICAL LEADERS |
|---|

| 2016 Individual Player Stats |
2016 Start Chart |
|---|
| 2016 GAME-BY-GAME STATS |
|---|
 |
| 2015 STATISTICAL LEADERS |
|---|

| 2015 Individual Player Stats |
2015 Start Chart |
|---|
| 2015 GAME-BY-GAME STATS |
|---|
 |
2015 SCHEDULE |
2014 RESULTS |
||||||||||||||||||||||||||||||||||||||||||||||||||||||||||||||||||||||||||||||||||||||||||||||||||||||||||||||||||||||||||||||||||||||||||||||||||||||||||||||||||||||||||||||||||||||||||||||||||||||||||||||||||||||||||||||||
|
|
||||||||||||||||||||||||||||||||||||||||||||||||||||||||||||||||||||||||||||||||||||||||||||||||||||||||||||||||||||||||||||||||||||||||||||||||||||||||||||||||||||||||||||||||||||||||||||||||||||||||||||||||||||||||||||||||
| 2014 STATISTICAL LEADERS |
|---|

| 2014 Individual Player Stats |
2014 Start Chart |
|---|
| 2014 GAME-BY-GAME STATS |
|---|
 |
| 2013 STATISTICAL LEADERS |
|---|
| Player | Att | Yds | YPC | TD | Player | Comp | Att | % | Yds | YPA | TD | INT | Rating | Player | Rec | Yds | YPC | TD |
| Brandon Betancourt | 93 | 415 | 4.5 | 2 | Andrew McDonald | 216 | 323 | 66.9% | 2320 | 7.2 | 13 | 10 | 134.3 | Austin Franklin | 46 | 606 | 13.2 | 5 |
| Germi Morrison | 92 | 340 | 3.7 | 4 | King Davis III | 26 | 50 | 52.0% | 371 | 7.4 | 2 | 1 | 123.5 | Jerrel Brown | 31 | 471 | 15.2 | 2 |
| Andrew McDonald | 89 | 237 | 2.7 | 4 | Adam Shapiro | 1 | 1 | 100.0% | 6 | 6.0 | 1 | 0 | 480.4 | Adam Shapiro | 31 | 369 | 11.9 | 2 |
| 2013 Individual Player Stats |
2013 Start Chart/ Starters Lost |
|---|
| 2013 GAME-BY-GAME STATS |
|---|
 |
2013 RESULTS |
2012 RESULTS |
|||||||||||||||||||||||||||||||||||||||||||||||||||||||||||||||||||||||||||||||||||||||||||||||||||||||||||||||||||||||||||||||||||||||||||||||||||||||||||||||||||||||||||||||||||||||||||||||||||||||||||||||||||||||||||||||||||||||||||||||||||||||||
|
|
|||||||||||||||||||||||||||||||||||||||||||||||||||||||||||||||||||||||||||||||||||||||||||||||||||||||||||||||||||||||||||||||||||||||||||||||||||||||||||||||||||||||||||||||||||||||||||||||||||||||||||||||||||||||||||||||||||||||||||||||||||||||||
| 2012 STATISTICAL LEADERS |
|---|
| Player | Att | Yds | YPC | TD | Player | Comp | Att | % | Yds | YPA | TD | INT | Rating | Player | Rec | Yds | YPC | TD | ||
| Germi Morrison | 159 | 767 | 4.8 | 2 | Andrew Manley | 207 | 384 | 53.9% | 2764 | 7.2 | 18 | 11 | 124.1 | Austin Franklin | 74 | 1245 | 16.8 | 9 | ||
| Tiger Powell | 72 | 236 | 3.3 | 5 | Travaughn Colwell | 6 | 13 | 46.2% | 66 | 5.1 | 1 | 0 | 114.2 | Kemonte' Bateman | 50 | 707 | 14.1 | 5 | ||
| Travaughn Colwell | 31 | 139 | 4.5 | 0 | Andrew McDonald | 1 | 3 | 33.3% | 3 | 1.0 | 0 | 0 | 41.7 | Jerrell Brown | 19 | 250 | 13.2 | 1 |
| 2012 Individual Player Stats • 2012 Start Chart/Starters Lost |
|---|
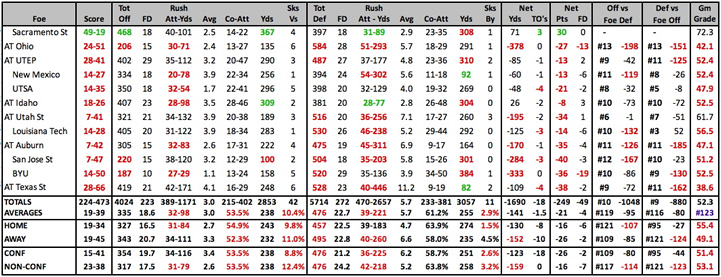
| 2012 GAME-BY-GAME STATS |
|---|
 |
| 2011 STATISTICAL LEADERS |
|---|
| Player | Att | Yds | YPC | TD | Player | Comp | Att | % | Yds | YPA | TD | INT | Rating | Player | Rec | Yds | YPC | TD | ||
| Kenny Turner | 219 | 1068 | 4.9 | 10 | Matt Christian | 145 | 277 | 52.3% | 2158 | 7.8 | 15 | 8 | 129.9 | Taveon Rogers | 59 | 1049 | 17.8 | 9 | ||
| Matt Christian | 80 | 298 | 3.7 | 5 | Andrew Manley | 62 | 109 | 56.9% | 892 | 8.2 | 6 | 3 | 138.3 | Todd Lee | 38 | 578 | 15.2 | 3 | ||
| Robert Clay | 42 | 133 | 3.2 | 1 | Travaughn Colwell | 39 | 60 | 65.0% | 420 | 7.0 | 2 | 3 | 124.8 | Austin Franklin | 34 | 524 | 15.4 | 3 |
| 2011 Individual Player Stats |
|---|
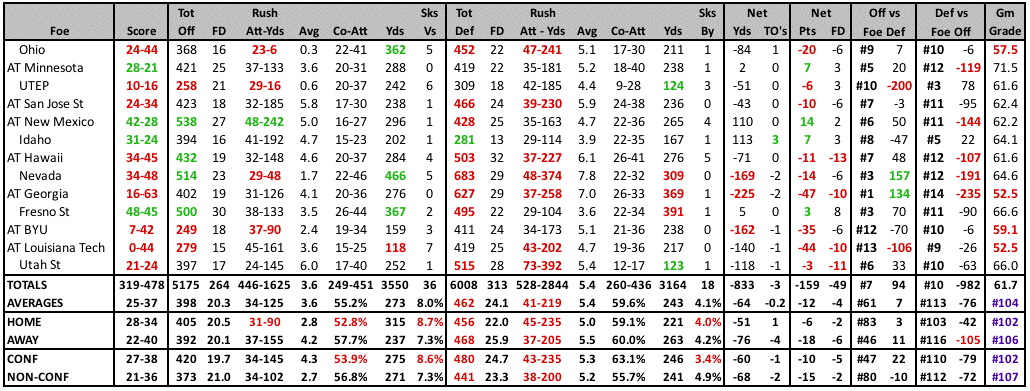
| 2011 GAME-BY-GAME STATS |
|---|
2011 RESULTS |
2010 RESULTS |
|||||||||||||||||||||||||||||||||||||||||||||||||||||||||||||||||||||||||||||||||||||||||||||||||||||||||||||||||||||||||||||||||||||||||||||||||||||||||||||||||||||||||||||||||||||||
|
|
|||||||||||||||||||||||||||||||||||||||||||||||||||||||||||||||||||||||||||||||||||||||||||||||||||||||||||||||||||||||||||||||||||||||||||||||||||||||||||||||||||||||||||||||||||||||
| 2010 STATISTICAL LEADERS |
|---|
| Player | Att | Yds | YPC | TD | Player | Comp | Att | % | Yds | YPA | TD | INT | Rating | Player | Rec | Yds | YPC | TD | ||
| Kenny Turner | 115 | 461 | 4.01 | 2 | Matt Christian | 114 | 237 | 48.1% | 1372 | 5.8 | 8 | 2 | 106.2 | Marcus Allen | 42 | 598 | 14.2 | 2 | ||
| Seth Smith | 101 | 370 | 3.66 | 3 | Andrew Manley | 63 | 121 | 52.1% | 604 | 5.0 | 1 | 6 | 86.8 | Kyle Nelson | 41 | 371 | 9.0 | 1 | ||
| Robert Clay | 54 | 226 | 4.19 | 0 | Tanner Rust | 8 | 18 | 44.4% | 33 | 1.8 | 0 | 1 | 48.7 | Todd Lee | 24 | 280 | 11.7 | 3 |
| 2010 Individual Player Stats |
|---|
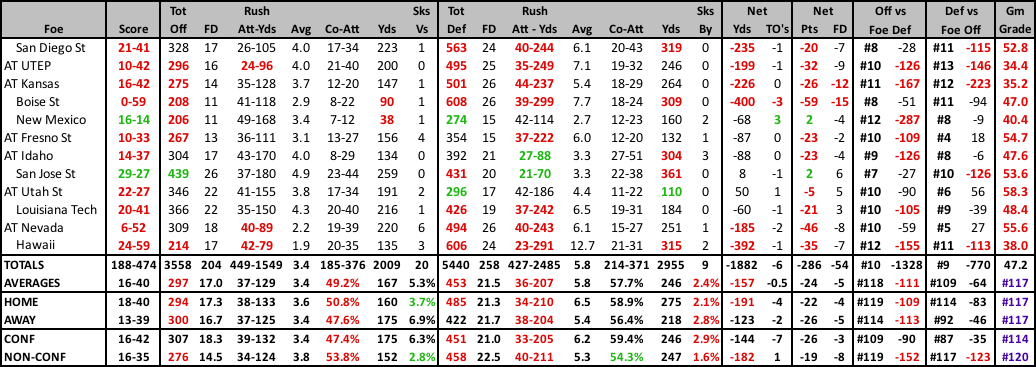
| 2010 GAME-BY-GAME STATS |
|---|
| 2009 STATISTICAL LEADERS |
|---|
| Player | Att | Yds | YPC | TD | Player | Comp | Att | % | Yds | YPA | TD | INT | Rating | Player | Rec | Yds | YPC | TD | ||
| Seth Smith | 246 | 1016 | 4.13 | 1 | Jeff Fleming | 87 | 171 | 50.9% | 789 | 4.6 | 4 | 12 | 83.3 | Marcus Allen | 26 | 308 | 11.8 | 2 | ||
| Tonny Glynn | 66 | 295 | 4.47 | 1 | Trevor Walls | 46 | 94 | 48.9% | 352 | 3.7 | 2 | 5 | 76.8 | Todd Lee | 28 | 280 | 10.0 | 1 | ||
| Jeff Fleming | 77 | 268 | 3.48 | 3 | Jason Scott | 0 | 1 | 0.0% | 0 | 0.0 | 0 | 0 | 0.0 | Marcus Anderson | 22 | 208 | 9.5 | 1 |
|
|---|
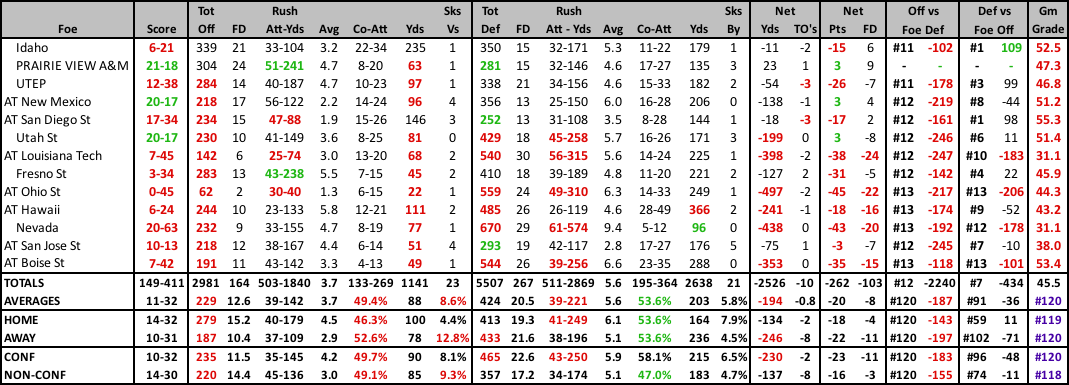
| 2009 GAME-BY-GAME STATS |
|---|
2009 RESULTS |
2008 RESULTS |
|||||||||||||||||||||||||||||||||||||||||||||||||||||||||||||||||||||||||||||||||||||||||||||||||||||||||||||||||||||||||||||||||||||||||||||||||||||||||||||||||||||
|
|
|||||||||||||||||||||||||||||||||||||||||||||||||||||||||||||||||||||||||||||||||||||||||||||||||||||||||||||||||||||||||||||||||||||||||||||||||||||||||||||||||||||
| 2008 Individual Player Stats • 2007 Individual Player Stats |
|---|

