
GEORGIA ST PANTHERS |
 |
STADIUM: Center Parc Credit Union Stadium |
|||||||||
|---|---|---|---|---|---|---|---|---|---|---|
 |
||||||||||
|
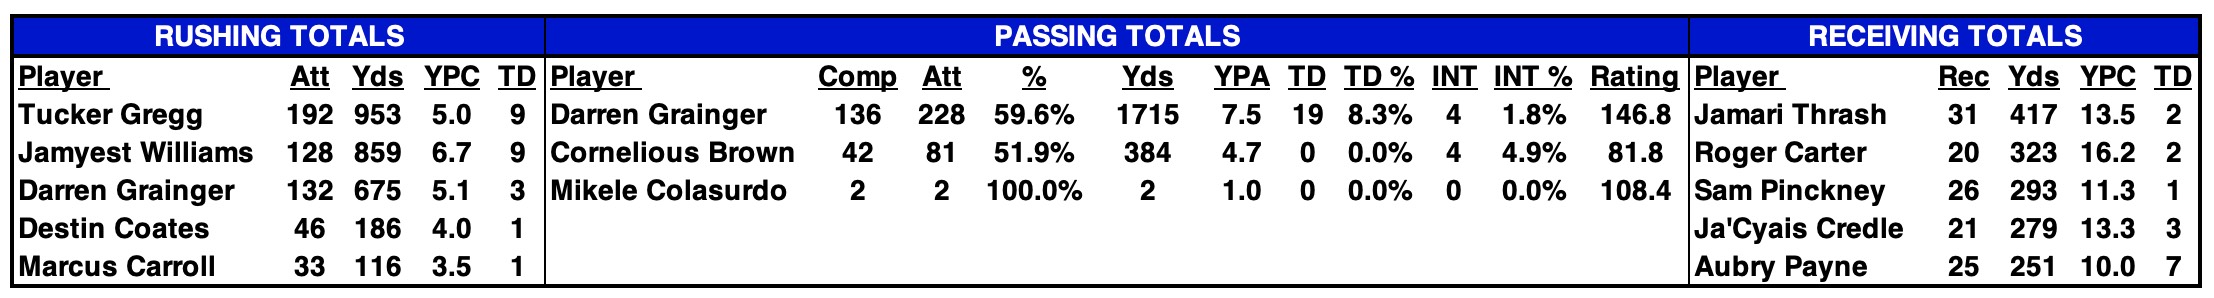
| 2025 STATISTICAL LEADERS |
|---|
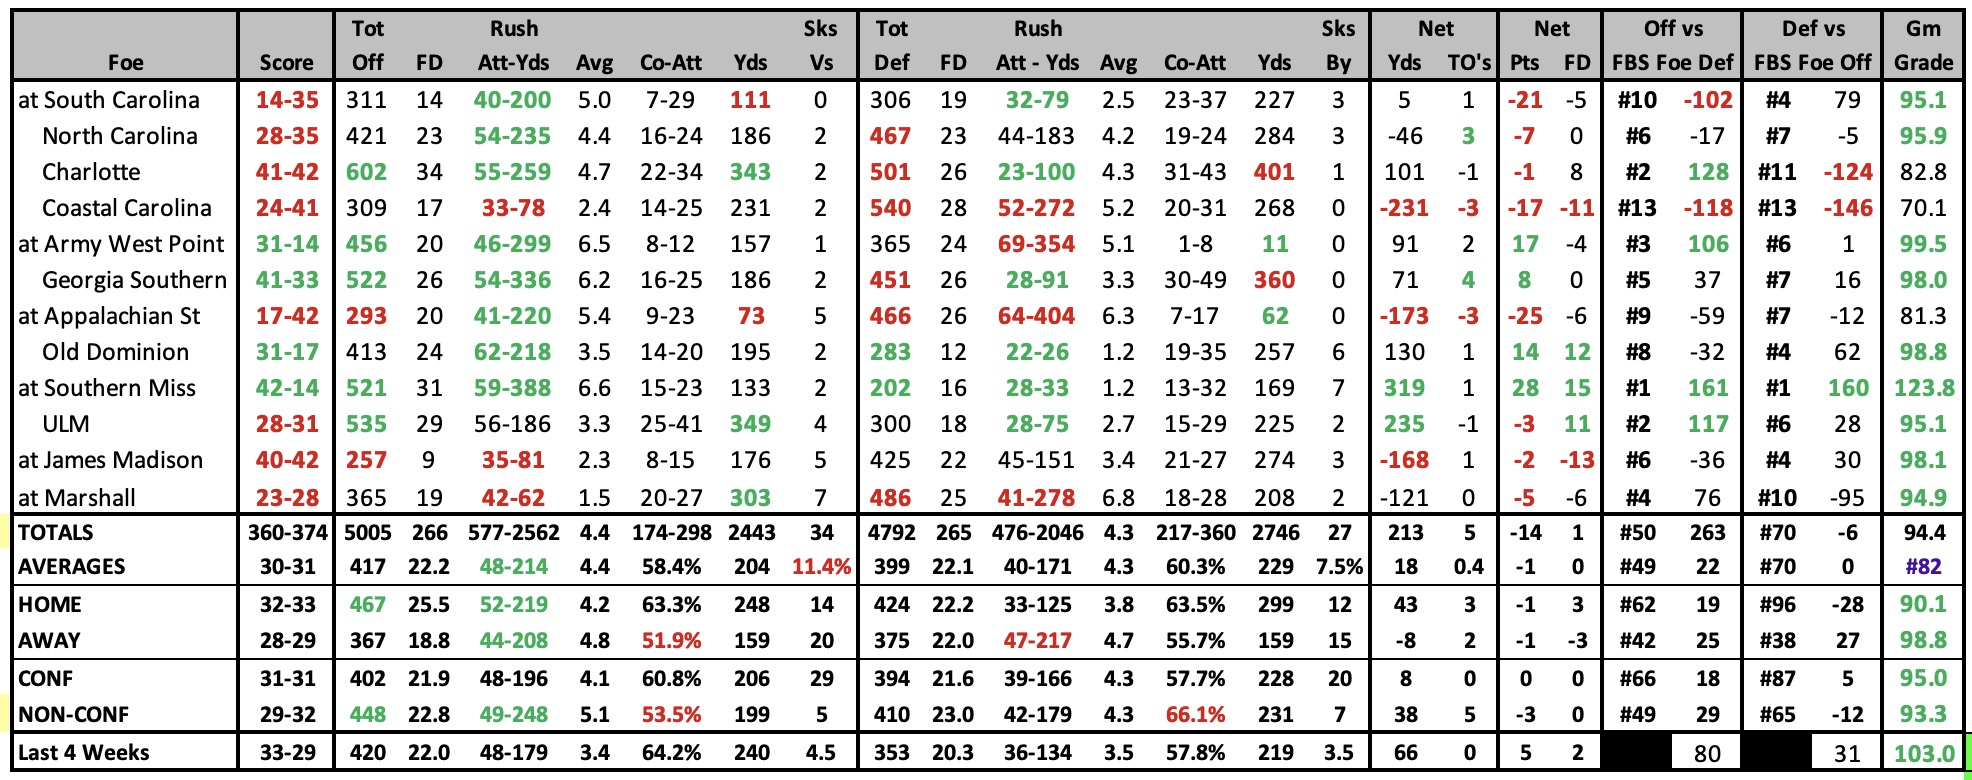
| 2025 GAME-BY-GAME STATS |
|---|
 |
2024 SCHEDULE |
2024 RESULTS |
||||||||||||||||||||||||||||||||||||||||||||||||||||||||||||||||||||||||||||||||||||||||||||||||||||||||||||||||||||||||||||||||||||||||||||||||||||||||||||||||||||||||||||||||||||||||||||||||
|
|
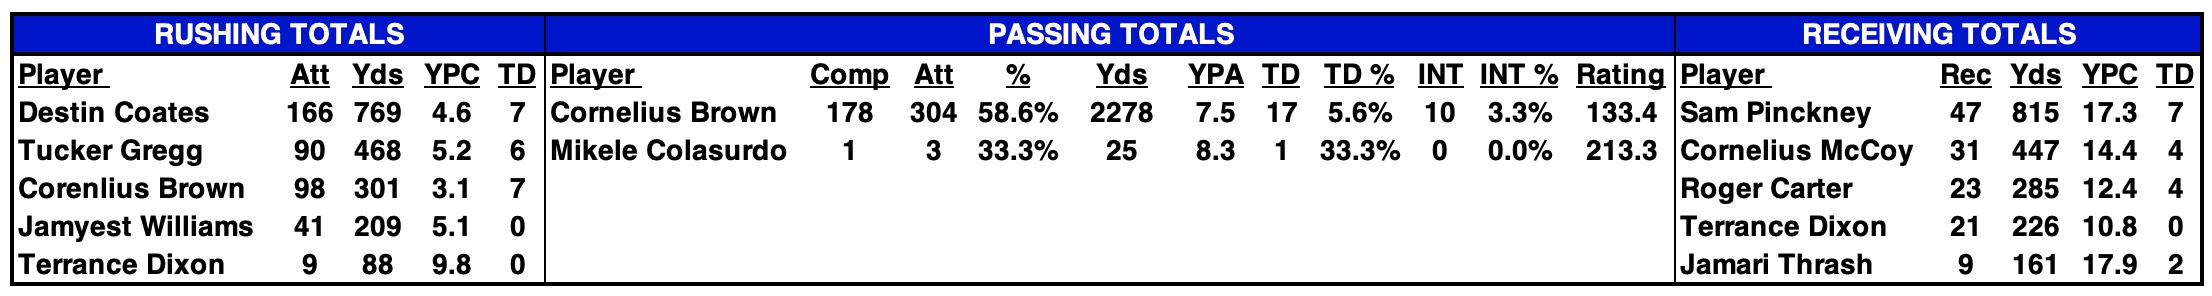
| 2024 STATISTICAL LEADERS |
|---|
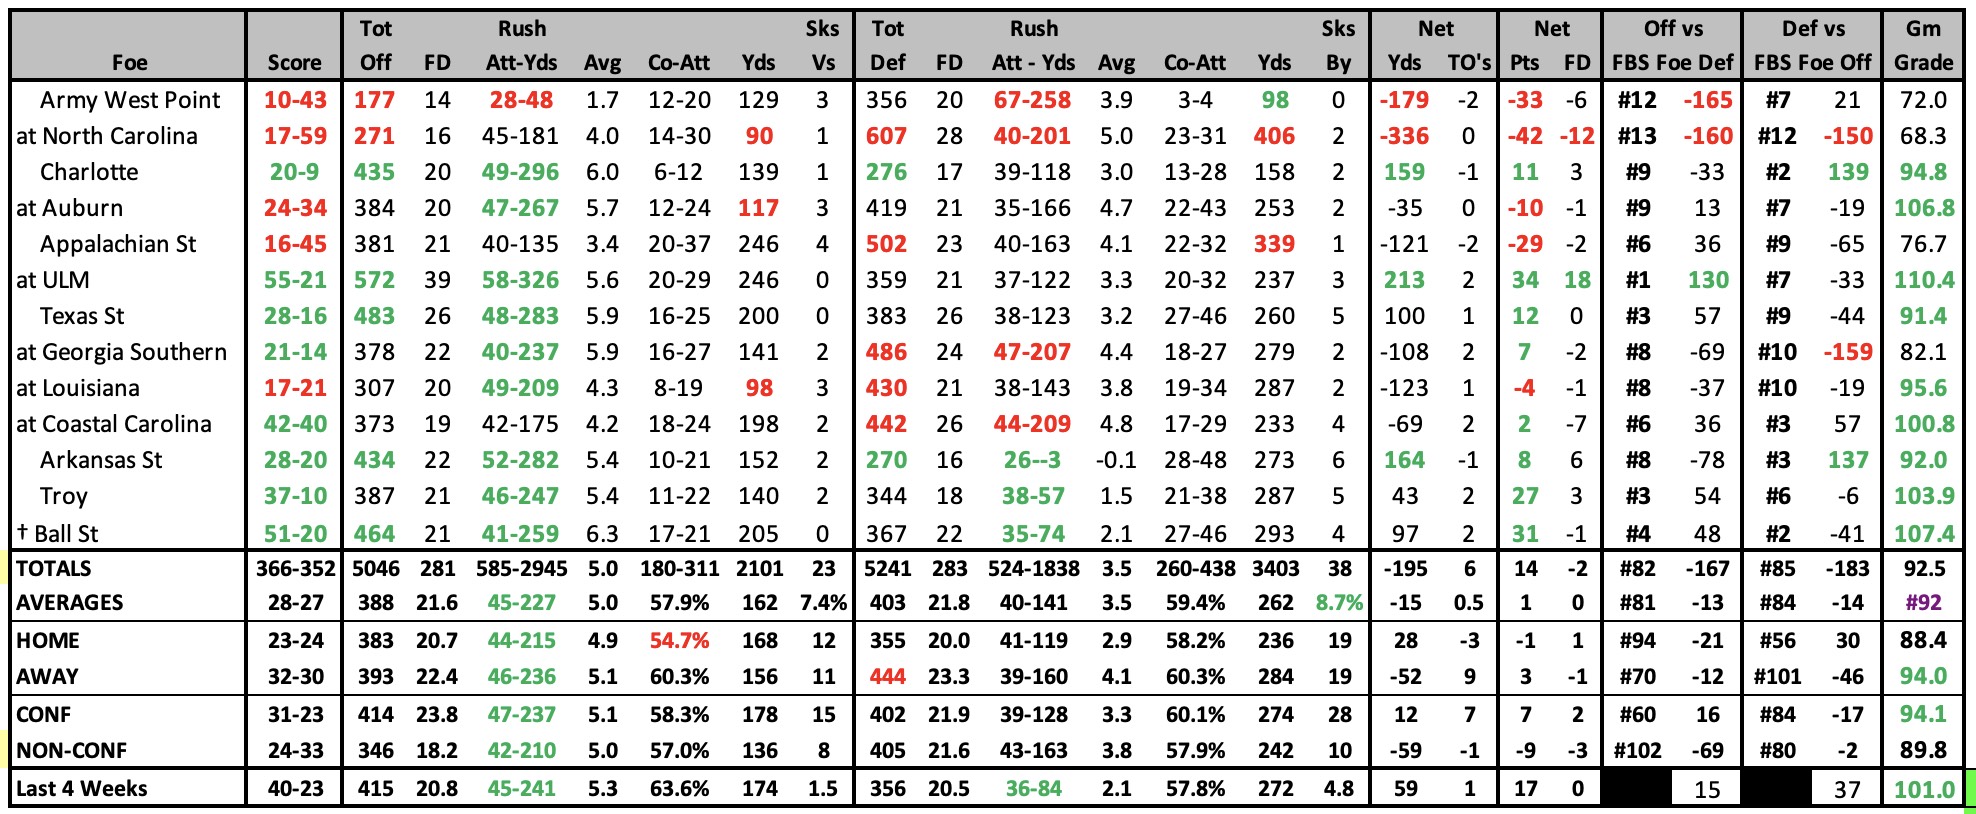
| 2024 GAME-BY-GAME STATS |
|---|
 |
2024 SCHEDULE |
2023 RESULTS |
||||||||||||||||||||||||||||||||||||||||||||||||||||||||||||||||||||||||||||||||||||||||||||||||||||||||||||||||||||||||||||||||||||||||||||||||||||||||||||||||||||||||||||||||||||||||||||||||
|
|
||||||||||||||||||||||||||||||||||||||||||||||||||||||||||||||||||||||||||||||||||||||||||||||||||||||||||||||||||||||||||||||||||||||||||||||||||||||||||||||||||||||||||||||||||||||||||||||||
| 2023 STATISTICAL LEADERS |
|---|
| 2023 GAME-BY-GAME STATS |
|---|
 |
2023 SCHEDULE |
2022 RESULTS |
||||||||||||||||||||||||||||||||||||||||||||||||||||||||||||||||||||||||||||||||||||||||||||||||||||||||||||||||||||||||||||||||||||||||||||||||||||||||||||||||||||||||||||||||||||||||||||||||
|
|
||||||||||||||||||||||||||||||||||||||||||||||||||||||||||||||||||||||||||||||||||||||||||||||||||||||||||||||||||||||||||||||||||||||||||||||||||||||||||||||||||||||||||||||||||||||||||||||||
| 2022 STATISTICAL LEADERS |
|---|
| 2022 GAME-BY-GAME STATS |
|---|
 |
2022 SCHEDULE |
2021 RESULTS |
||||||||||||||||||||||||||||||||||||||||||||||||||||||||||||||||||||||||||||||||||||||||||||||||||||||||||||||||||||||||||||||||||||||||||||||||||||||||||||||||||||||||||||||||||||||||||||||||
|
|
||||||||||||||||||||||||||||||||||||||||||||||||||||||||||||||||||||||||||||||||||||||||||||||||||||||||||||||||||||||||||||||||||||||||||||||||||||||||||||||||||||||||||||||||||||||||||||||||
| 2021 STATISTICAL LEADERS |
|---|
| 2021 GAME-BY-GAME STATS |
|---|
 |
2021 SCHEDULE |
2020 RESULTS |
||||||||||||||||||||||||||||||||||||||||||||||||||||||||||||||||||||||||||||||||||||||||||||||||||||||||||||||||||||||||||||||||||||||||||||||||||||||||||||||||||||||||||||||||||||||||||||||||
|
|
||||||||||||||||||||||||||||||||||||||||||||||||||||||||||||||||||||||||||||||||||||||||||||||||||||||||||||||||||||||||||||||||||||||||||||||||||||||||||||||||||||||||||||||||||||||||||||||||
| 2020 STATISTICAL LEADERS |
|---|
| 2020 GAME-BY-GAME STATS |
|---|
 |
2020 SCHEDULE |
2019 RESULTS |
||||||||||||||||||||||||||||||||||||||||||||||||||||||||||||||||||||||||||||||||||||||||||||||||||||||||||||||||||||||||||||||||||||||||||||||||||||||||||||||||||||||||||||||||||||||||||||||||||||||||||||
|
|
||||||||||||||||||||||||||||||||||||||||||||||||||||||||||||||||||||||||||||||||||||||||||||||||||||||||||||||||||||||||||||||||||||||||||||||||||||||||||||||||||||||||||||||||||||||||||||||||||||||||||||
| 2019 STATISTICAL LEADERS |
|---|
| 2019 GAME-BY-GAME STATS |
|---|
 |
2019 SCHEDULE |
2018 RESULTS |
|||||||||||||||||||||||||||||||||||||||||||||||||||||||||||||||||||||||||||||||||||||||||||||||||||||||||||||||||||||||||||||||||||||||||||||||||||||||||||||||||||||||||||||||||||||||||||||||||||||||||||||||||||||
|
|
|||||||||||||||||||||||||||||||||||||||||||||||||||||||||||||||||||||||||||||||||||||||||||||||||||||||||||||||||||||||||||||||||||||||||||||||||||||||||||||||||||||||||||||||||||||||||||||||||||||||||||||||||||||
| 2018 STATISTICAL LEADERS |
|---|
| 2018 GAME-BY-GAME STATS |
|---|
 |
2018 SCHEDULE |
2017 RESULTS |
||||||||||||||||||||||||||||||||||||||||||||||||||||||||||||||||||||||||||||||||||||||||||||||||||||||||||||||||||||||||||||||||||||||||||||||||||||||||||||||||||||||||||||||||||||||||||||||||||||||||||||||||||||||||||||||||
|
|
||||||||||||||||||||||||||||||||||||||||||||||||||||||||||||||||||||||||||||||||||||||||||||||||||||||||||||||||||||||||||||||||||||||||||||||||||||||||||||||||||||||||||||||||||||||||||||||||||||||||||||||||||||||||||||||||
| 12017 STATISTICAL LEADERS |
|---|
| 2017 GAME-BY-GAME STATS |
|---|
 |
2017 SCHEDULE |
2016 RESULTS |
||||||||||||||||||||||||||||||||||||||||||||||||||||||||||||||||||||||||||||||||||||||||||||||||||||||||||||||||||||||||||||||||||||||||||||||||||||||||||||||||||||||||||||||||||||||||||||||||||||||||||||||||||||||||||||||||||||
|
|
||||||||||||||||||||||||||||||||||||||||||||||||||||||||||||||||||||||||||||||||||||||||||||||||||||||||||||||||||||||||||||||||||||||||||||||||||||||||||||||||||||||||||||||||||||||||||||||||||||||||||||||||||||||||||||||||||||
| 2016 STATISTICAL LEADERS |
|---|
| 2016 GAME-BY-GAME STATS |
|---|
 |
| 2015 STATISTICAL LEADERS |
|---|
| 2015 GAME-BY-GAME STATS |
|---|
 |
2015 SCHEDULE |
2014 RESULTS |
|||||||||||||||||||||||||||||||||||||||||||||||||||||||||||||||||||||||||||||||||||||||||||||||||||||||||||||||||||||||||||||||||||||||||||||||||||||||||||||||||||||||||||||||||||||||||||||||||||||||||||||||||||||||||||||||||||||||||||||||||||||||||
|
|
|||||||||||||||||||||||||||||||||||||||||||||||||||||||||||||||||||||||||||||||||||||||||||||||||||||||||||||||||||||||||||||||||||||||||||||||||||||||||||||||||||||||||||||||||||||||||||||||||||||||||||||||||||||||||||||||||||||||||||||||||||||||||
| 2014 STATISTICAL LEADERS |
|---|
| 2014 GAME-BY-GAME STATS |
|---|
 |
| 2013 STATISTICAL LEADERS |
|---|
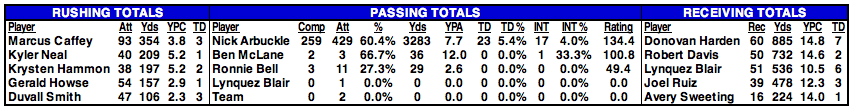
| Player | Att | Yds | YPC | TD | Player | Comp | Att | % | Yds | YPA | TD | INT | Rating | Player | Rec | Yds | YPC | TD |
| Travis Evans | 104 | 389 | 3.7 | 3 | Ronnie Bell | 171 | 342 | 50.0% | 2252 | 6.6 | 15 | 10 | 113.9 | Albert Wilson | 65 | 1076 | 16.6 | 8 |
| Albert Wilson | 30 | 267 | 8.9 | 1 | Ben McLane | 28 | 51 | 54.9% | 354 | 6.9 | 2 | 1 | 122.2 | Robert Davis | 40 | 601 | 15.0 | 4 |
| Jonathan Jean-Bart | 70 | 252 | 3.6 | 1 | Kelton Hill | 2 | 3 | 66.7% | 109 | 36.3 | 1 | 0 | 481.9 | Keith Rucker | 14 | 208 | 14.9 | 1 |
| 2013 Individual Player Stats |
2013 Start Chart/ Starters Lost |
|---|
| 2013 GAME-BY-GAME STATS |
|---|
 |
2013 RESULTS |
2012 RESULTS |
||||||||||||||||||||||||||||||||||||||||||||||||||||||||||||||||||||||||||||||||||||||||||||||||||||||||||||||||||||||||||||||||||||||||||||||||||||||||||||||||||||
|
|
||||||||||||||||||||||||||||||||||||||||||||||||||||||||||||||||||||||||||||||||||||||||||||||||||||||||||||||||||||||||||||||||||||||||||||||||||||||||||||||||||||
| 2012 GAME-BY-GAME STATS |
|---|
 |
| 2011 GAME-BY-GAME STATS |
|---|
| Tot | Rush | Sks | Tot | Rush | Sks | Net | Net | ||||||||||||
| Foe | Score | Off | FD | Att-Yds | Avg | Co-Att | Yds | Vs | Def | FD | Att - Yds | Avg | Co-Att | Yds | By | Yds | TO's | Pts | FD |
| Clark Atlanta | 41-7 | 342 | 19 | 37-146 | 3.9 | 13-18 | 196 | 1 | 247 | 12 | 38-140 | 3.7 | 10-17 | 107 | 3 | 95 | 2 | 34 | 7 |
| Old Dominion | 17-40 | 291 | 16 | 35-85 | 2.4 | 15-44 | 206 | 4 | 403 | 16 | 54-277 | 5.1 | 13-21 | 126 | 1 | -112 | -1 | -23 | 0 |
| AT Jacksonville St | 21-37 | 325 | 15 | 28-116 | 4.1 | 17-30 | 209 | 0 | 401 | 21 | 58-246 | 4.2 | 9-11 | 155 | 1 | -76 | 0 | -16 | -6 |
| AT Houston | 0-56 | 241 | 11 | 35-108 | 3.1 | 12-27 | 133 | 2 | 732 | 34 | 39-171 | 4.4 | 40-50 | 561 | 3 | -491 | 0 | -56 | -23 |
| Murray St | 24-48 | 367 | 22 | 34-86 | 2.5 | 19-44 | 281 | 1 | 459 | 25 | 31-138 | 4.5 | 35-46 | 321 | 3 | -92 | 0 | -24 | -3 |
| AT South Carolina St | 13-23 | 320 | 15 | 45-244 | 5.4 | 6-20 | 76 | 1 | 368 | 17 | 47-155 | 3.3 | 16-30 | 213 | 1 | -48 | -3 | -10 | -2 |
| South Alabama | 27-20 | 429 | 17 | 43-220 | 5.1 | 12-15 | 209 | 1 | 323 | 24 | 50-178 | 3.6 | 14-30 | 145 | 3 | 106 | 2 | 7 | -7 |
| AT UTSA | 14-17 | 255 | 16 | 44-164 | 3.7 | 6-15 | 91 | 1 | 297 | 16 | 35-108 | 3.1 | 17-34 | 189 | 2 | -42 | 1 | -3 | 0 |
| St Francis (Ill) | 27-30 | 355 | 14 | 32-158 | 4.9 | 14-24 | 197 | 1 | 475 | 25 | 42-258 | 6.1 | 21-33 | 217 | 1 | -120 | 0 | -3 | -11 |
| AT West Alabama | 23-30 | 447 | 21 | 31-219 | 7.1 | 19-37 | 228 | 0 | 388 | 24 | 54-222 | 4.1 | 15-21 | 166 | 1 | 59 | -2 | -7 | -3 |
| Campbell | 42-35 | 520 | 27 | 50-307 | 6.1 | 13-22 | 213 | 3 | 338 | 20 | 30-88 | 2.9 | 21-32 | 250 | 2 | 182 | 0 | 7 | 7 |
| TOTALS | 249-343 | 3892 | 193 | 414-1853 | 4.5 | 146-296 | 2039 | 15 | 4431 | 234 | 478-1981 | 4.1 | 211-325 | 2450 | 21 | -539 | -1 | -94 | -41 |
| AVERAGES | 23-31 | 354 | 17.5 | 38-168 | 4.5 | 49.3% | 185 | 5.1% | 403 | 21.3 | 43-180 | 4.1 | 64.9% | 223 | 6.5% | -49 | -0.1 | -9 | -4 |
| HOME | 36-36 | 461 | 23.0 | 46-200 | 5.0 | 51.5% | 260 | 6.6% | 449 | 24.4 | 49-216 | 5.2 | 63.7% | 233 | 7.3% | 12 | 3 | 0 | -1 |
| AWAY | 14-33 | 318 | 15.6 | 37-170 | 4.7 | 46.5% | 147 | 3.1% | 437 | 22.4 | 47-180 | 3.8 | 66.4% | 257 | 5.5% | -120 | -4 | -18 | -7 |
2011 RESULTS |
2010 RESULTS |
||||||||||||||||||||||||||||||||||||||||||||||||||||||||||||||||||||||||||||||||||||||||||||||||||||
|
|
||||||||||||||||||||||||||||||||||||||||||||||||||||||||||||||||||||||||||||||||||||||||||||||||||||
| 2010 GAME-BY-GAME STATS |
|---|
| SKS | SKS | |||||||||||||||||||||
| ATT | OPPONENT | FD | RUSH | - | YDS | AVG | CO | - | ATT | YDS | VS | FD | RUSH | - | YDS | AVG | CO | - | ATT | YDS | BY | TURN |
| 30,237 | Shorter | 20 | 35 | - | 212 | 6.1 | 14 | - | 19 | 154 | 1 | 14 | 53 | - | 206 | 3.9 | 5 | - | 11 | 57 | 0 | 1 |
| 12,647 | Lambuth | 5 | 17 | - | 91 | 5.4 | 8 | - | 18 | 92 | 1 | 21 | 50 | - | 184 | 3.7 | 19 | - | 26 | 126 | 6 | -2 |
| 16,128 | Jacksonville St | 19 | 22 | - | 112 | 5.1 | 25 | - | 40 | 227 | 2 | 24 | 39 | - | 167 | 4.3 | 24 | - | 32 | 283 | 0 | 0 |
| 3,021 | at Campbell | 14 | 26 | - | 117 | 4.5 | 16 | - | 23 | 163 | 0 | 21 | 54 | - | 257 | 4.8 | 9 | - | 18 | 84 | 1 | -2 |
| 15,264 | Morehead St | 22 | 40 | - | 152 | 3.8 | 22 | - | 33 | 289 | 1 | 14 | 21 | - | 50 | 2.4 | 27 | - | 44 | 230 | 2 | 1 |
| 14,908 | Savannah St | 22 | 40 | - | 232 | 5.8 | 19 | - | 29 | 201 | 0 | 13 | 44 | - | 154 | 3.5 | 13 | - | 19 | 109 | 1 | 3 |
| 13,378 | Nc Central | 16 | 35 | - | 112 | 3.2 | 16 | - | 29 | 205 | 2 | 19 | 43 | - | 175 | 4.1 | 11 | - | 23 | 154 | 2 | 2 |
| 19,782 | at Old Dominion | 21 | 23 | - | 58 | 2.5 | 33 | - | 55 | 419 | 0 | 23 | 43 | - | 229 | 5.3 | 22 | - | 38 | 152 | 0 | -4 |
| 23,446 | at South Alabama | 15 | 19 | - | 46 | 2.4 | 21 | - | 35 | 234 | 1 | 24 | 49 | - | 293 | 6 | 12 | - | 24 | 181 | 0 | -1 |
| 14,689 | Lamar | 16 | 27 | - | 133 | 4.9 | 22 | - | 36 | 189 | 0 | 18 | 29 | - | 84 | 2.9 | 19 | - | 36 | 273 | 3 | 0 |
| 101,821 | at Alabama | 7 | 32 | - | 91 | 2.8 | 5 | - | 17 | 74 | 2 | 24 | 45 | - | 262 | 5.8 | 19 | - | 22 | 216 | 0 | -5 |
| TOTALS | 177 | 316 | - | 1356 | 4.3 | 201 | - | 334 | 2247 | 10 | 215 | 470 | - | 2061 | 4.4 | 180 | - | 293 | 1865 | 15 | -7 | |
| AVERAGES | 16.1 | 29 | - | 123 | 4.3 | 18 | - | 30 | 204 | 0.9 | 19.6 | 43 | - | 187 | 4.4 | 16 | - | 27 | 170 | 1.4 | -1 |
| 2009-2006 RESULTS |
|---|
DID NOT HAVE A FOOTBALL PROGRAM UNTIL 2010 |