JAMES MADISON DUKES |
 |
STADIUM: Brideforth Stadium |
|---|---|
 |
|
QUICK FACTS: |
|
| LOCATION: Harrisonburg, VA | |
| FOUNDED: 1908 | |
| ENROLLMENT: 22,227 | |
| COLORS: Purple & Gold | |
| CONFERENCE: Sun Belt | |
| Head Coach: Bob Chesney | |
| YEARS WITH TEAM: 2nd | |
| OVERALL RECORD: 9-4 | |
| FBS RECORD W/ TEAM: 9-4 | |
| FCS RECORD: 44-21 |
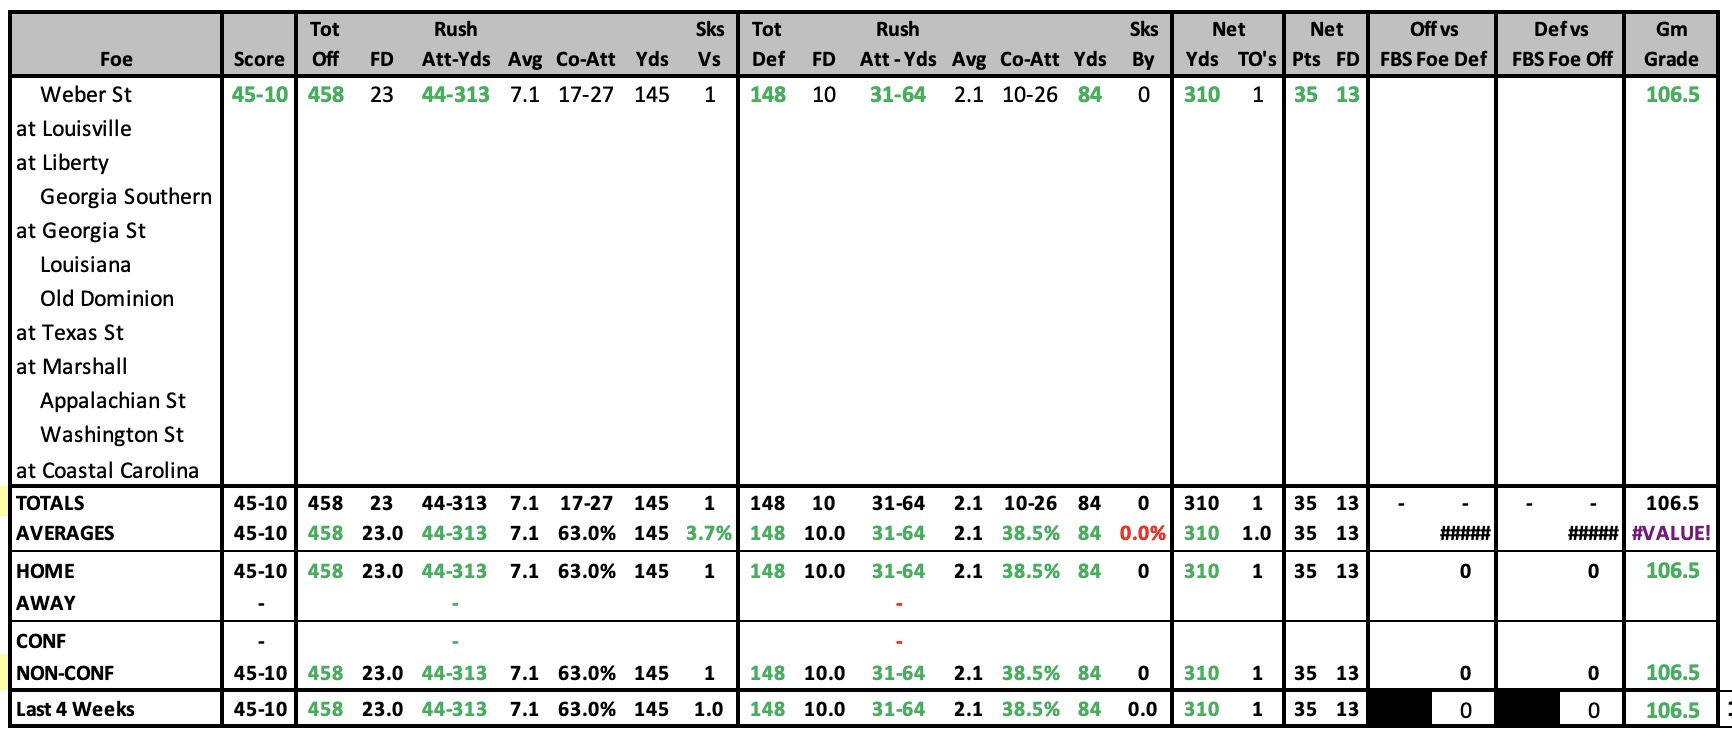
| 2025 STATISTICAL LEADERS |
|---|

| 2025 GAME-BY-GAME STATS |
|---|
 |
2025 SCHEDULE |
2024 RESULTS |
||||||||||||||||||||||||||||||||||||||||||||||||||||||||||||||||||||||||||||||||||||||||||||||||||||||||||||||||||||||||||||||||||||||||||||||||||||||||||||||||||||||||||||||||||||||||||||||||||||||||||||||||||||||||
|
|
||||||||||||||||||||||||||||||||||||||||||||||||||||||||||||||||||||||||||||||||||||||||||||||||||||||||||||||||||||||||||||||||||||||||||||||||||||||||||||||||||||||||||||||||||||||||||||||||||||||||||||||||||||||||
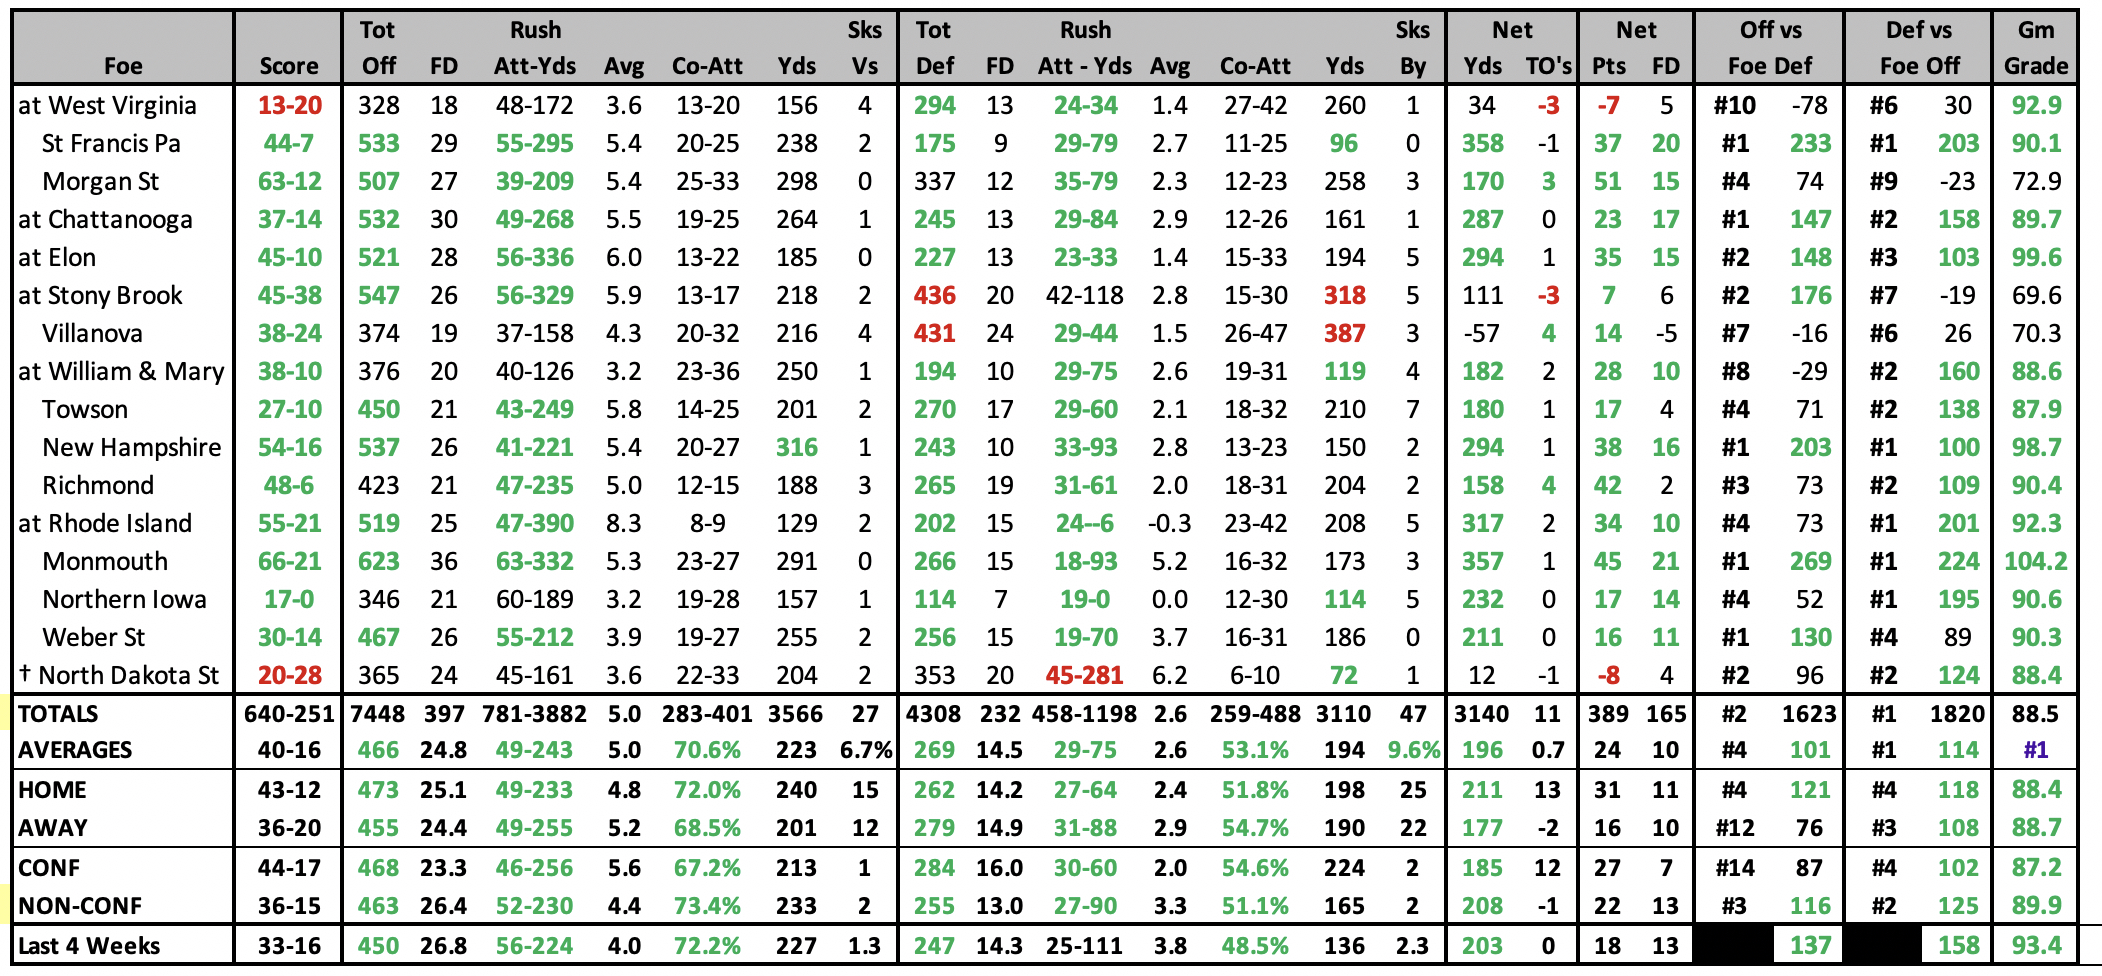
| 2024 STATISTICAL LEADERS |
|---|

| 2024 GAME-BY-GAME STATS |
|---|
 |
2024 SCHEDULE |
2023 RESULTS |
||||||||||||||||||||||||||||||||||||||||||||||||||||||||||||||||||||||||||||||||||||||||||||||||||||||||||||||||||||||||||||||||||||||||||||||||||||||||||||||||||||||||||||||||||||||||||||||||||||||||||||
|
|
||||||||||||||||||||||||||||||||||||||||||||||||||||||||||||||||||||||||||||||||||||||||||||||||||||||||||||||||||||||||||||||||||||||||||||||||||||||||||||||||||||||||||||||||||||||||||||||||||||||||||||
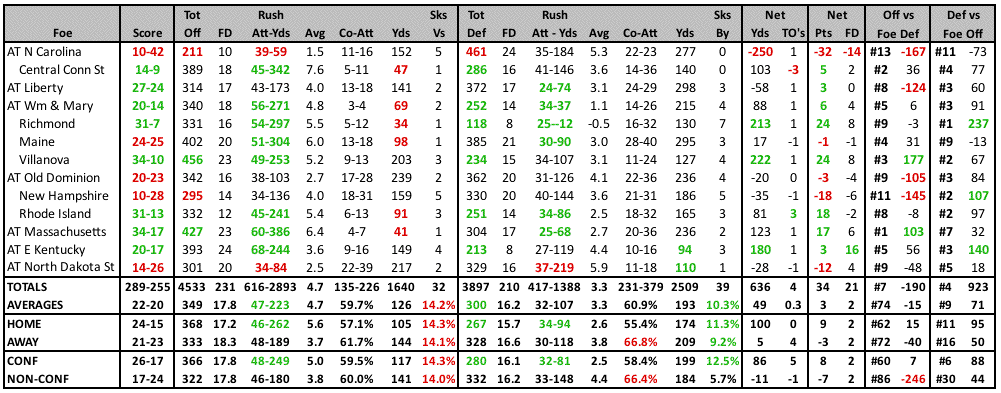
| 2023 STATISTICAL LEADERS |
|---|

| 2023 GAME-BY-GAME STATS |
|---|
 |
2023 SCHEDULE |
2022 RESULTS |
||||||||||||||||||||||||||||||||||||||||||||||||||||||||||||||||||||||||||||||||||||||||||||||||||||||||||||||||||||||||||||||||||||||||||||||||||||||||||||||||||||||||||||||||||||||||||||||||
|
|
||||||||||||||||||||||||||||||||||||||||||||||||||||||||||||||||||||||||||||||||||||||||||||||||||||||||||||||||||||||||||||||||||||||||||||||||||||||||||||||||||||||||||||||||||||||||||||||||
| 2022 STATISTICAL LEADERS |
|---|

| 2022 GAME-BY-GAME STATS |
|---|
 |
2022 SCHEDULE |
2021 RESULTS |
||||||||||||||||||||||||||||||||||||||||||||||||||||||||||||||||||||||||||||||||||||||||||||||||||||||||||||||||||||||||||||||||||||||||||||||||||||||||||||||||||||||||||||||||||||||||||||||||
|
|
| 2021 STATISTICAL LEADERS |
|---|

2021 Start Chart |
| 2021 GAME-BY-GAME STATS |
|---|
 |
| 2021 SPRING STATISTICAL LEADERS |
|---|

| 2021 SPRING GAME-BY-GAME STATS |
|---|
 |
| 2019 STATISTICAL LEADERS |
|---|

| 2019 GAME-BY-GAME STATS |
|---|
 |
| 2018 STATISTICAL LEADERS |
|---|

| 2018 GAME-BY-GAME STATS |
|---|
 |
| 2017 GAME-BY-GAME STATS |
|---|
 |
| 2016 GAME-BY-GAME STATS |
|---|
 |
| 2015 GAME-BY-GAME STATS |
|---|
 |
| 2014 GAME-BY-GAME STATS |
|---|
 |
| 2013 GAME-BY-GAME STATS |
|---|
 |
2013 SCHEDULE |
2012 RESULTS |
||||||||||||||||||||||||||||||||||||||||||||||||||||||||||||||||||||||||||||||||||||||||||||||||||||||||||||
|
|
| 2012 GAME-BY-GAME STATS |
|---|
 |
| 2011 GAME-BY-GAME STATS |
|---|

2011 RESULTS |
2010 RESULTS |
||||||||||||||||||||||||||||||||||||||||||||||||||||||||||||||||||||||||||||||||||||||||||||||||
|
|
||||||||||||||||||||||||||||||||||||||||||||||||||||||||||||||||||||||||||||||||||||||||||||||||
| 2010 GAME-BY-GAME STATS |
|---|
| SKS | SKS | |||||||||||||||||||||
| ATT | OPPONENT | FD | RUSH | - | YDS | AVG | CO | - | ATT | YDS | VS | FD | RUSH | - | YDS | AVG | CO | - | ATT | YDS | BY | TURN |
| 16,612 | Morehead St | 24 | 61 | - | 294 | 4.8 | 8 | - | 15 | 189 | 0 | 6 | 30 | - | 67 | 2.2 | 12 | - | 24 | 85 | 2 | 1 |
| 66,233 | at Virginia Tech | 14 | 41 | - | 114 | 2.8 | 5 | - | 8 | 121 | 2 | 23 | 44 | - | 238 | 5.4 | 10 | - | 16 | 124 | 0 | 3 |
| 16,385 | Liberty | 14 | 41 | - | 205 | 5 | 6 | - | 14 | 78 | 0 | 16 | 32 | - | 61 | 1.9 | 21 | - | 32 | 203 | 0 | 0 |
| 16,205 | Delaware | 12 | 33 | - | 161 | 4.9 | 12 | - | 20 | 122 | 0 | 16 | 40 | - | 70 | 1.8 | 14 | - | 22 | 136 | 2 | 0 |
| 9,049 | at Towson | 19 | 45 | - | 181 | 4 | 12 | - | 24 | 136 | 0 | 15 | 35 | - | 167 | 4.8 | 8 | - | 25 | 92 | 1 | -1 |
| 16,985 | New Hampshire | 11 | 38 | - | 118 | 3.1 | 10 | - | 23 | 157 | 4 | 21 | 32 | - | 106 | 3.3 | 22 | - | 40 | 248 | 2 | -2 |
| 9,217 | at Villanova | 16 | 32 | - | 87 | 2.7 | 22 | - | 33 | 213 | 4 | 21 | 47 | - | 209 | 4.4 | 13 | - | 19 | 159 | 1 | 0 |
| 16,664 | UMass | 19 | 42 | - | 180 | 4.3 | 13 | - | 25 | 179 | 1 | 16 | 36 | - | 139 | 3.9 | 15 | - | 19 | 163 | 1 | 0 |
| 8,700 | at Richmond | 12 | 52 | - | 166 | 3.2 | 6 | - | 15 | 57 | 2 | 17 | 33 | - | 85 | 2.6 | 16 | - | 30 | 187 | 2 | 1 |
| 16,733 | Wm & Mary | 15 | 48 | - | 266 | 5.5 | 0 | - | 1 | 0 | 2 | 23 | 32 | - | 86 | 2.7 | 24 | - | 40 | 250 | 3 | 0 |
| 3,880 | at Maine | 10 | 41 | - | 140 | 3.4 | 6 | - | 8 | 64 | 0 | 19 | 31 | - | 163 | 5.3 | 24 | - | 39 | 118 | 1 | 0 |
| TOTALS | 166 | 474 | - | 1912 | 4 | 100 | - | 186 | 1316 | 15 | 193 | 392 | - | 1391 | 3.5 | 179 | - | 306 | 1765 | 15 | 2 | |
| AVERAGES | 15.1 | 43 | - | 174 | 4 | 9 | - | 17 | 120 | 1.4 | 17.5 | 36 | - | 120 | 3.5 | 16 | - | 28 | 160 | 1.4 | 0 |
| 2009-2006 RESULTS |
|---|
| 2009 | 2008 | 2007 | 2006 | ||||||||
| at | Maryland (OT) | 35-38 | at | Duke | 7-31 | at | North Carolina | 14-37 | Bloomsburg | 14-3 | |
| VMI | 44-16 | NC Central | 56-7 | New Hampshire | 41-24 | at | Appalachian St | 10-21 | |||
| at | Liberty | 24-10 | UMass | 52-38 | VMI | 45-17 | Northeastern | 52-14 | |||
| at | Hofstra | 17-24 | Appalachian St | 35-32 | Coastal Carolina | 45-10 | at | VMI | 45-7 | ||
| Richmond | 17-21 | at | Maine | 24-10 | Villanova | 35-7 | Rhode Island | 35-23 | |||
| Villanova | 0-27 | Hofstra | 56-0 | at | Northeastern | 21-14 | at | New Hampshire | 42-23 | ||
| at | William & Mary | 3-24 | at | Richmond | 38-31 | at | Rhode Island | 44-27 | William & Mary | 31-17 | |
| at | Delaware | 20-8 | at | Villanova | 23-19 | Richmond | 16-17 | at | Richmond | 27-10 | |
| Maine | 22-14 | Delaware | 41-7 | at | Delaware | 34-37 | Delaware | 44-24 | |||
| at | UMass | 17-14 | William & Mary | 48-24 | at | William & Mary | 55-34 | at | Villanova | 20-21 | |
| Towson | 43-12 | at | Towson | 58-27 | Towson | 23-12 | at | Towson | 38-31 | ||
| Wofford | 38-35 | at | Appalachian St | 27-28 | at | Youngstown St | 31-35 | ||||
| Villanova | 31-27 | ||||||||||
| Montana | 27-35 |
