
| SOUTHERN MISS GOLDEN EAGLES |
|---|
|
STADIUM: M.M. Roberts Stadium |
 |
|
| LOCATION: Hattiesburg, MS | |
| FOUNDED: 1910 | |
| ENROLLMENT: 11,920 | |
| COLORS: Black & Gold | |
| MASCOT: Seymour d'Campus | |
| CONFERENCE: Sun Belt | |
| HEAD COACH: Charles Huff | |
| YEARS WITH TM: 1th | |
| OVERALL RECORD: 32-20 | |
RECORD WITH TM: 0-0 |

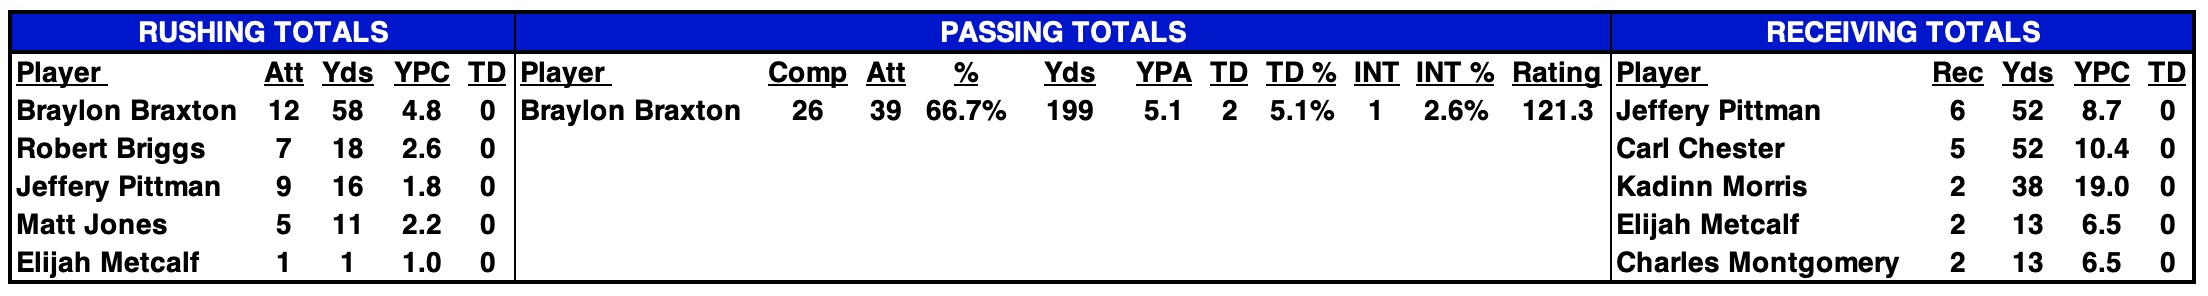
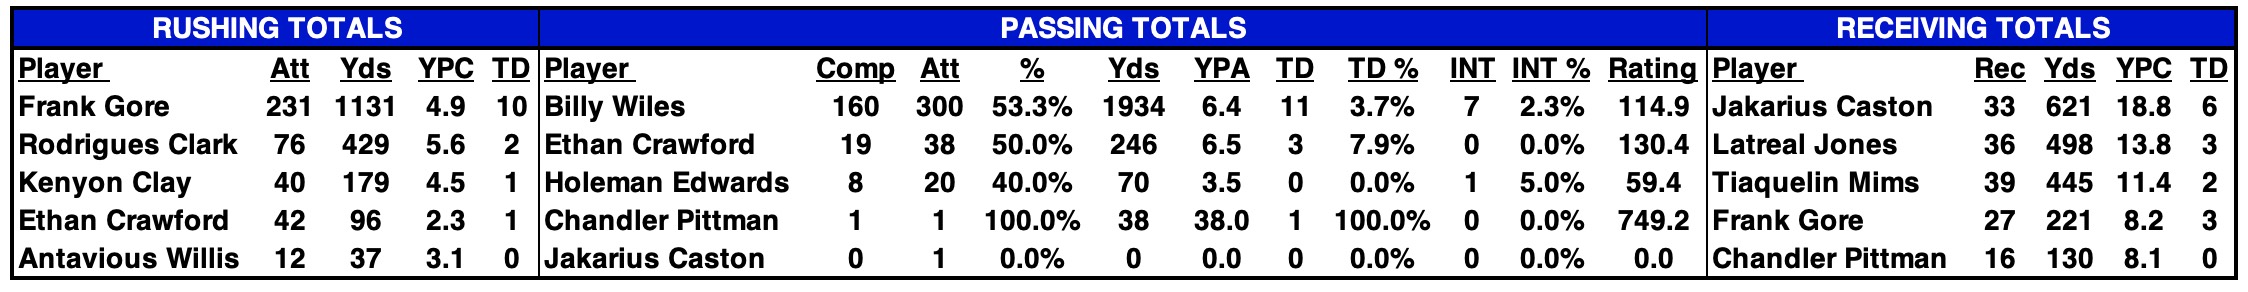
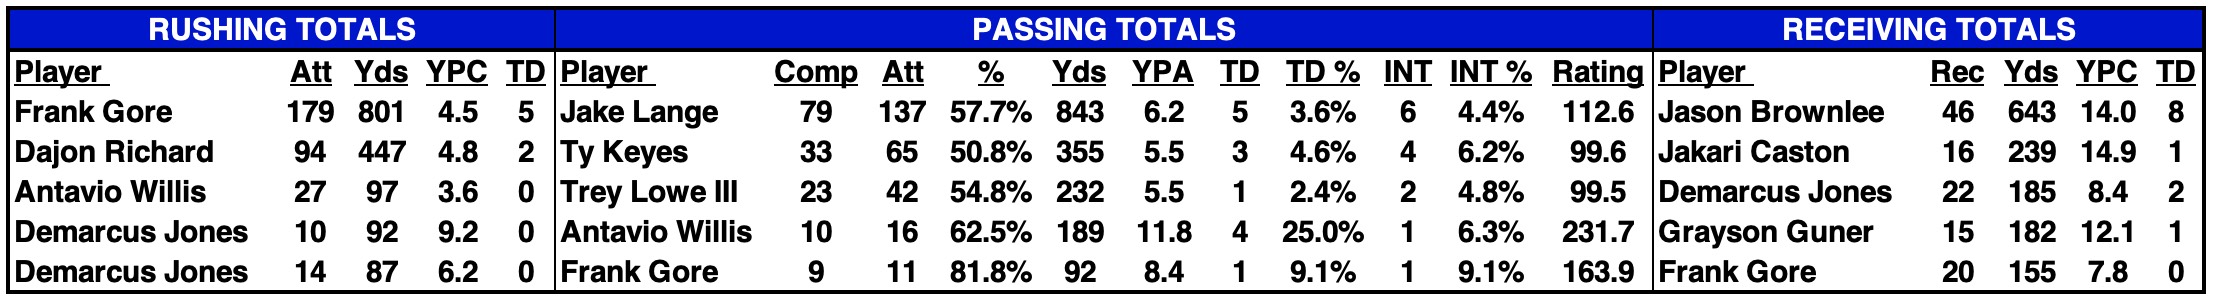
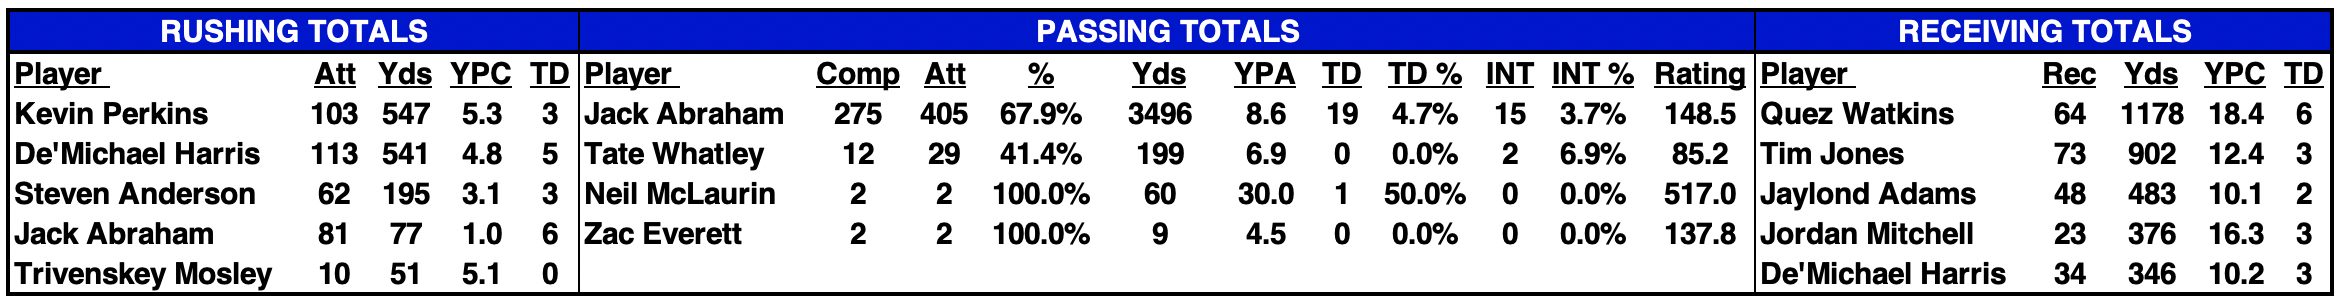
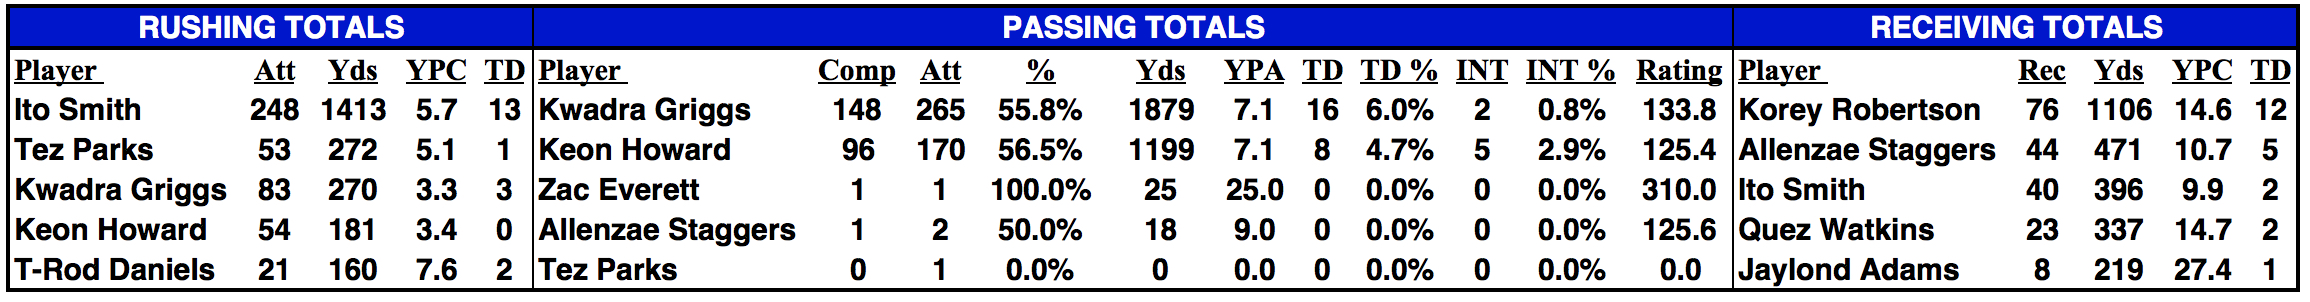
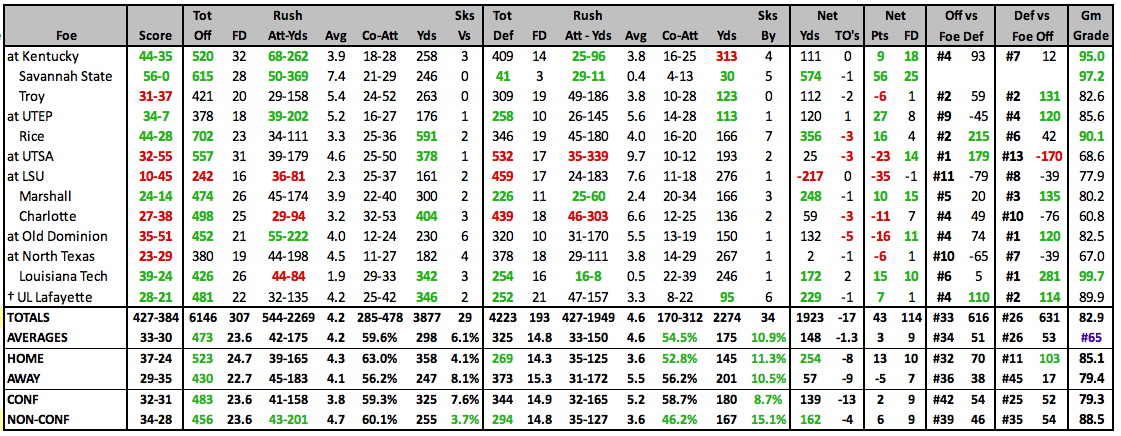
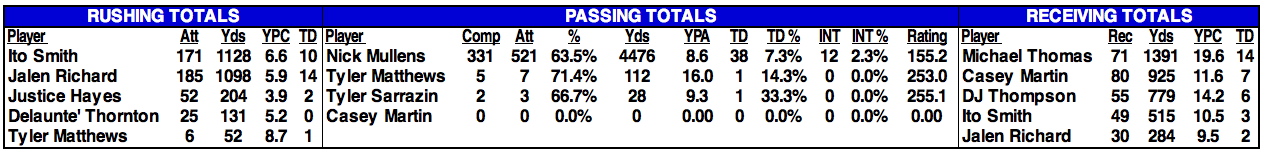
| 2025 STATISTICAL LEADERS |
|---|
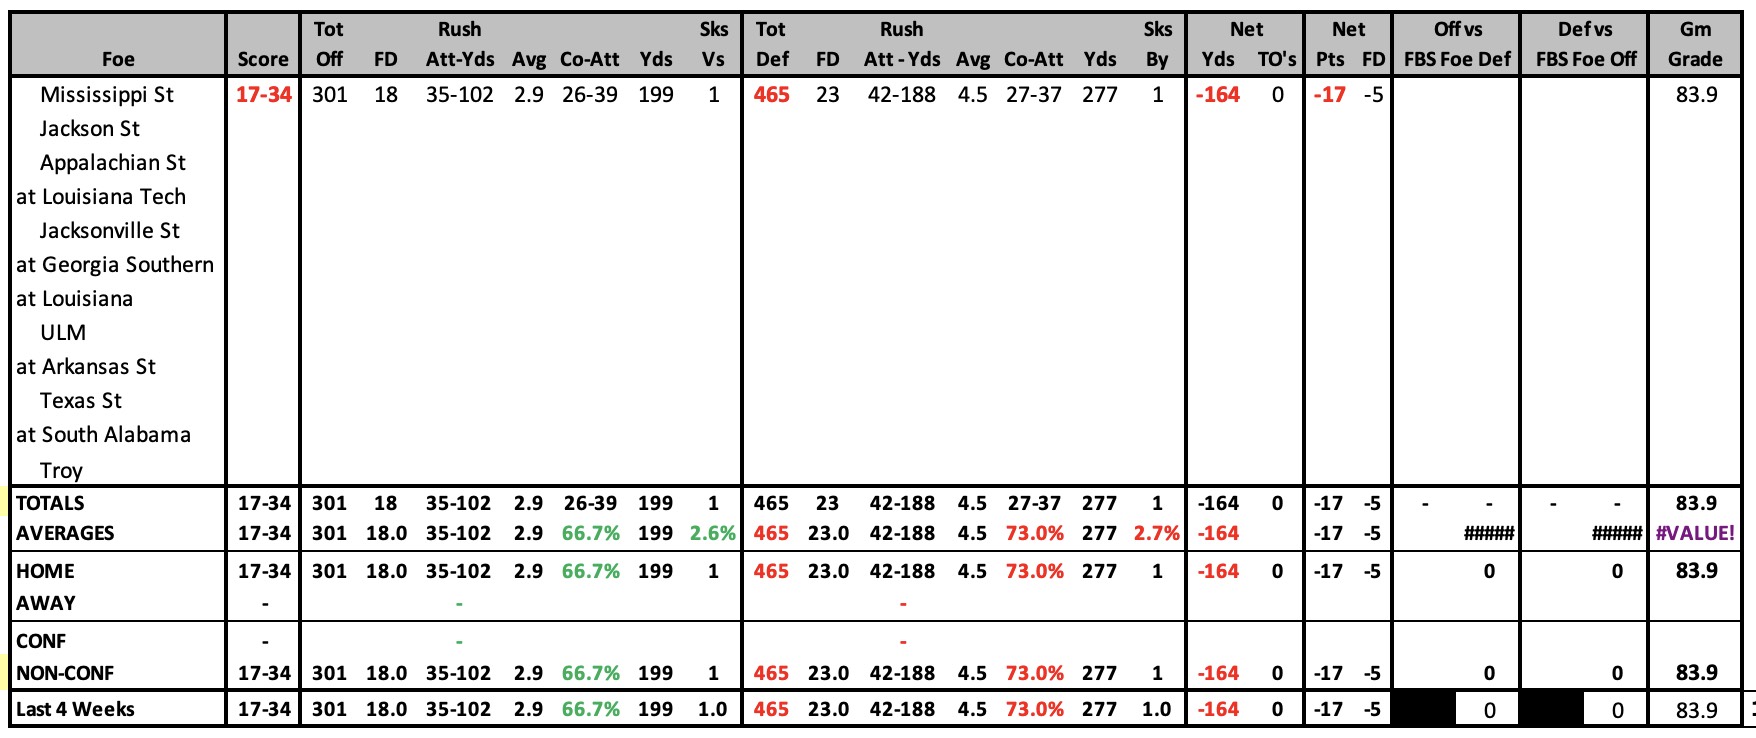
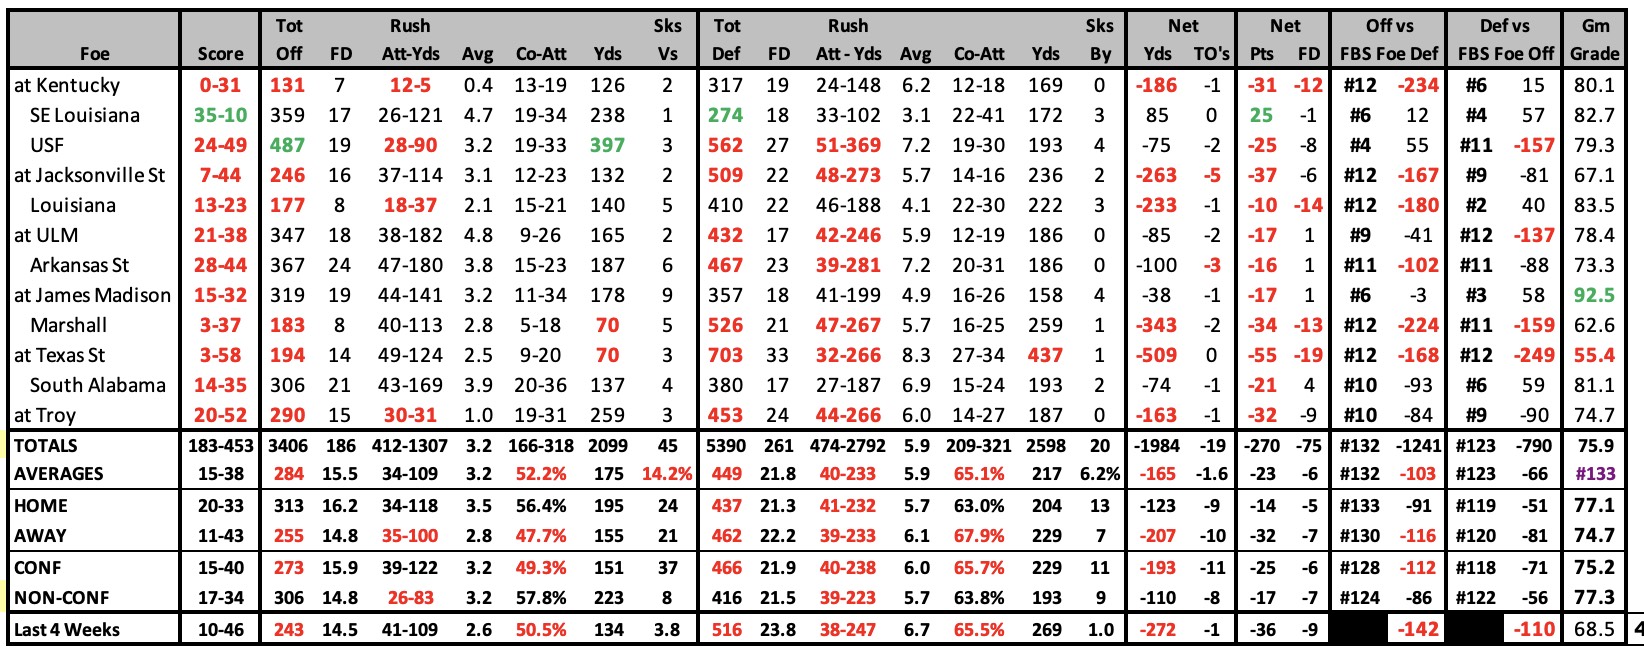
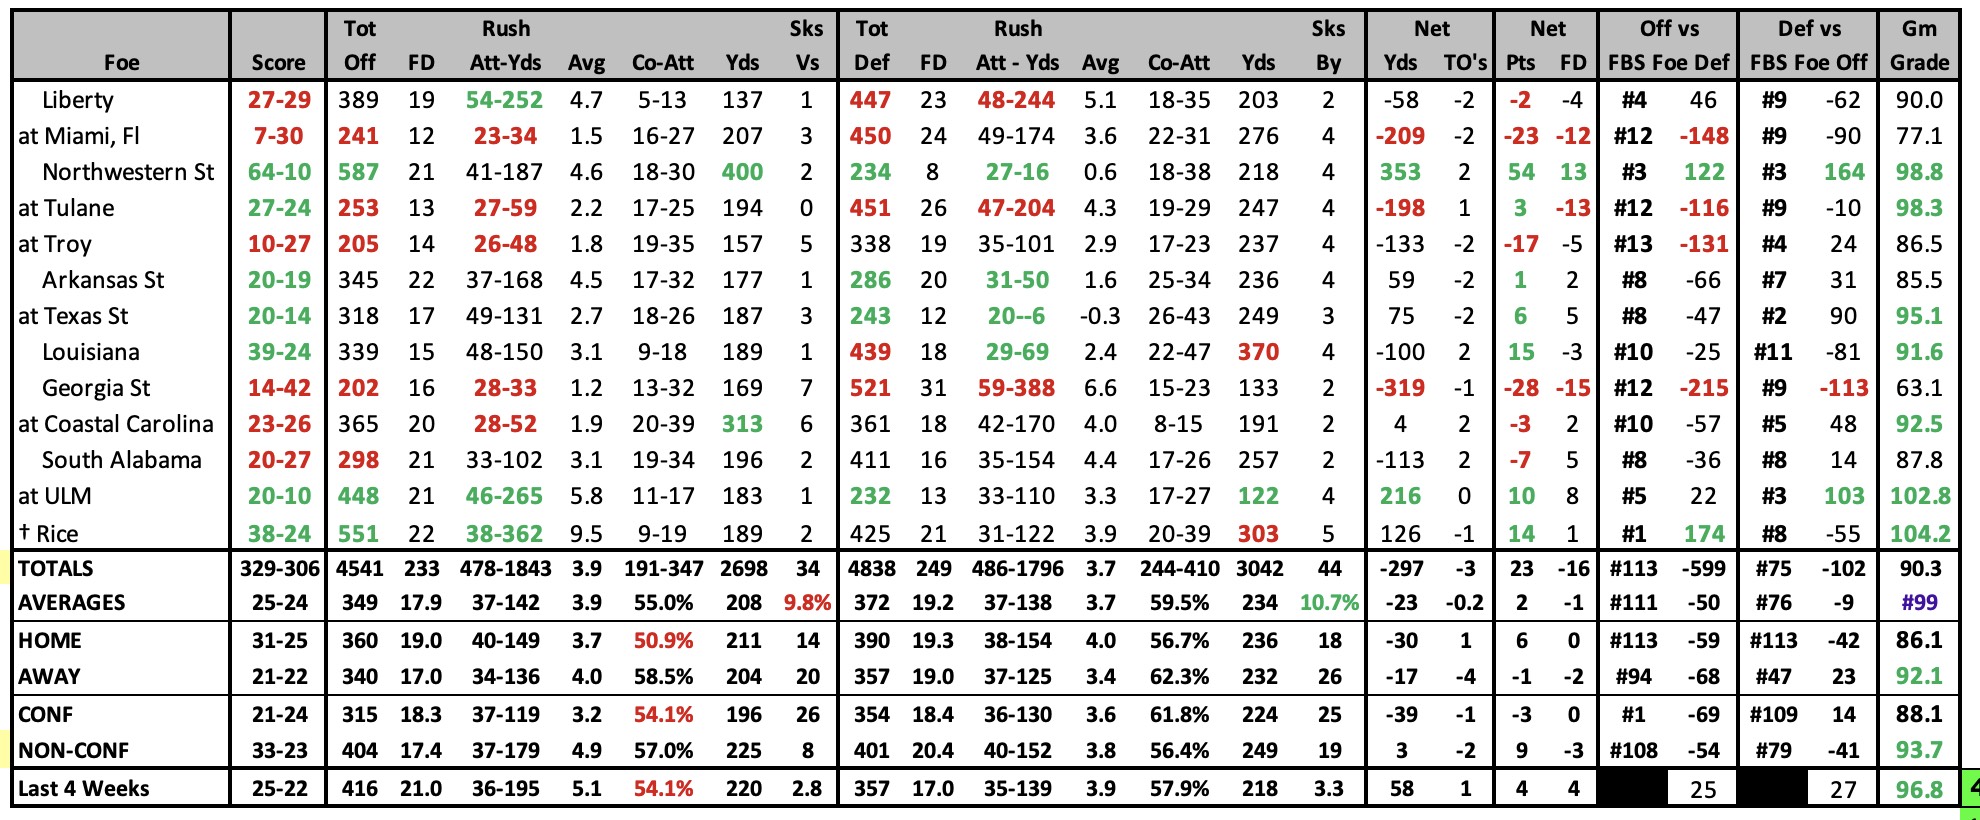
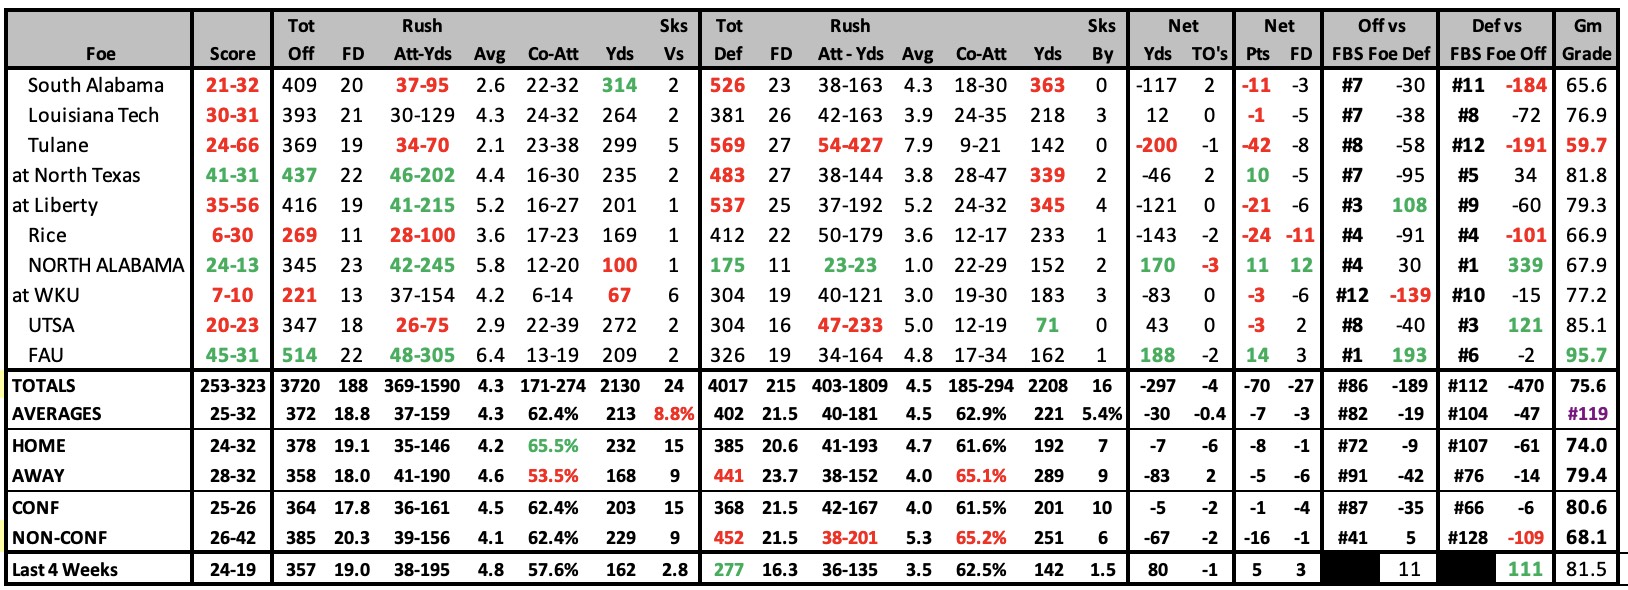
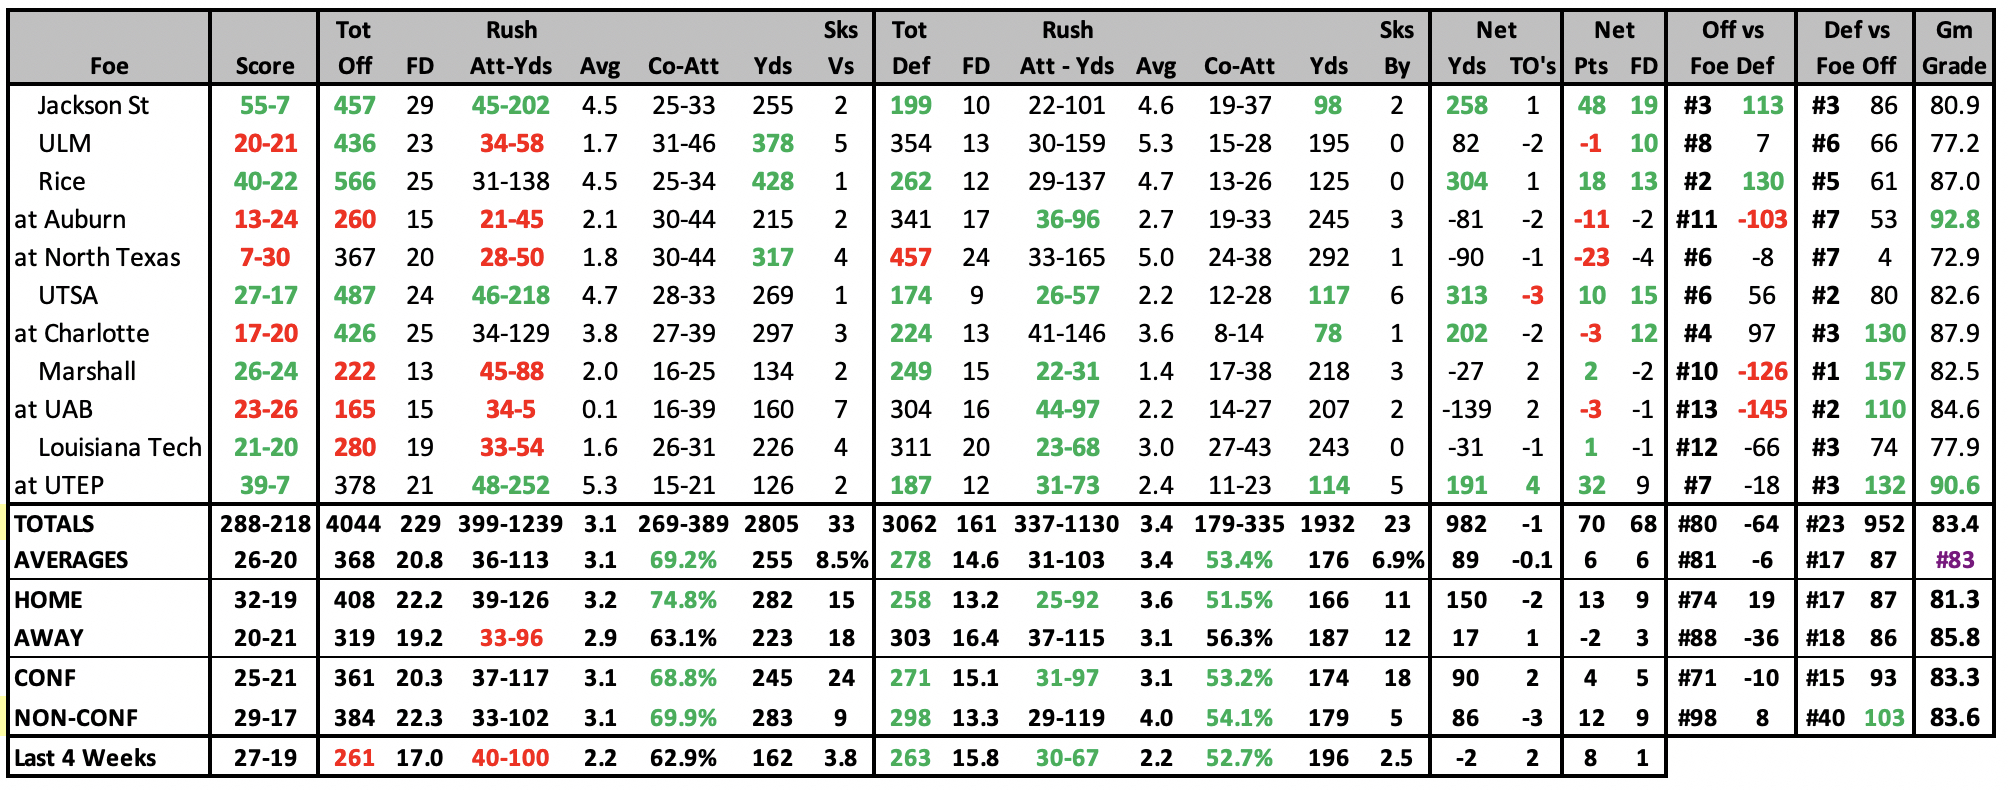
| 2025 GAME BY GAME STATS |
|---|
 |
2025 SCHEDULE |
2024 RESULTS |
||||||||||||||||||||||||||||||||||||||||||||||||||||||||||||||||||||||||||||||||||||||||||||||||||||||||||||||||||||||||||||||||||||||||||||||||||||||||||||||||||||||||||||||||||||||||||||||||||||||
|
|
||||||||||||||||||||||||||||||||||||||||||||||||||||||||||||||||||||||||||||||||||||||||||||||||||||||||||||||||||||||||||||||||||||||||||||||||||||||||||||||||||||||||||||||||||||||||||||||||||||||
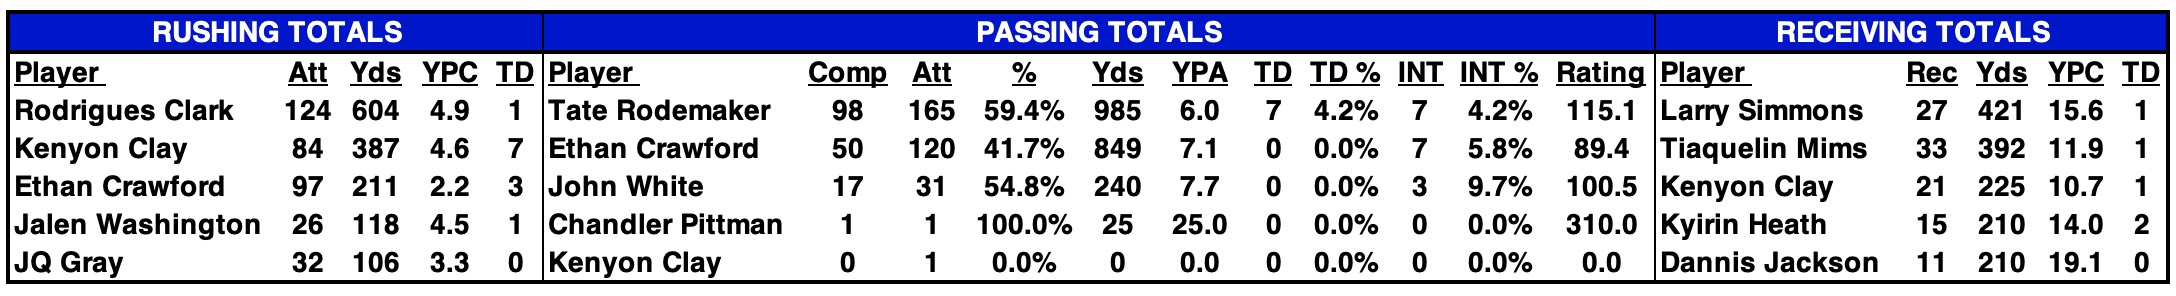
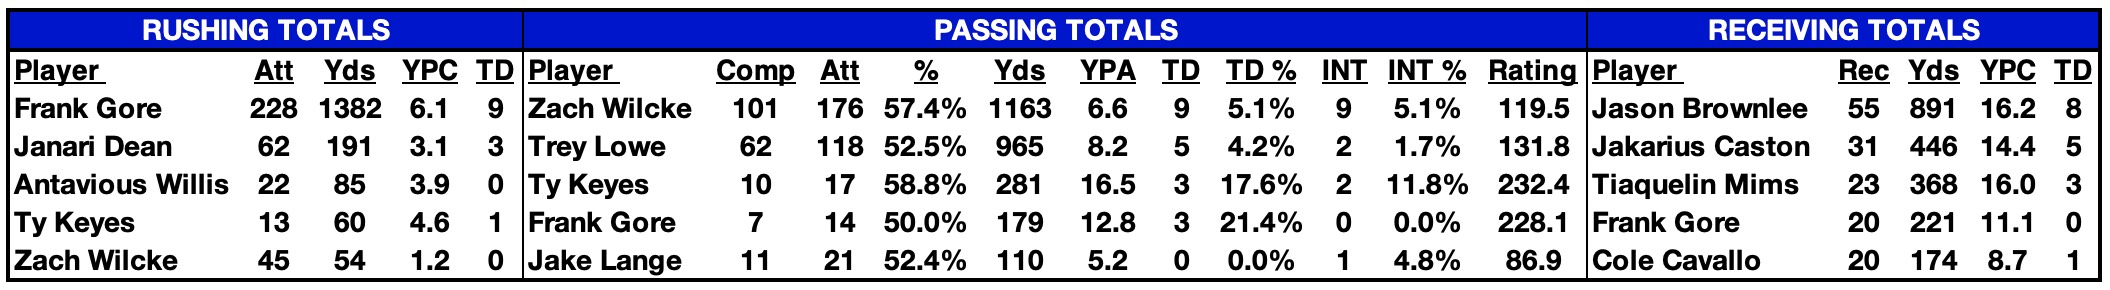
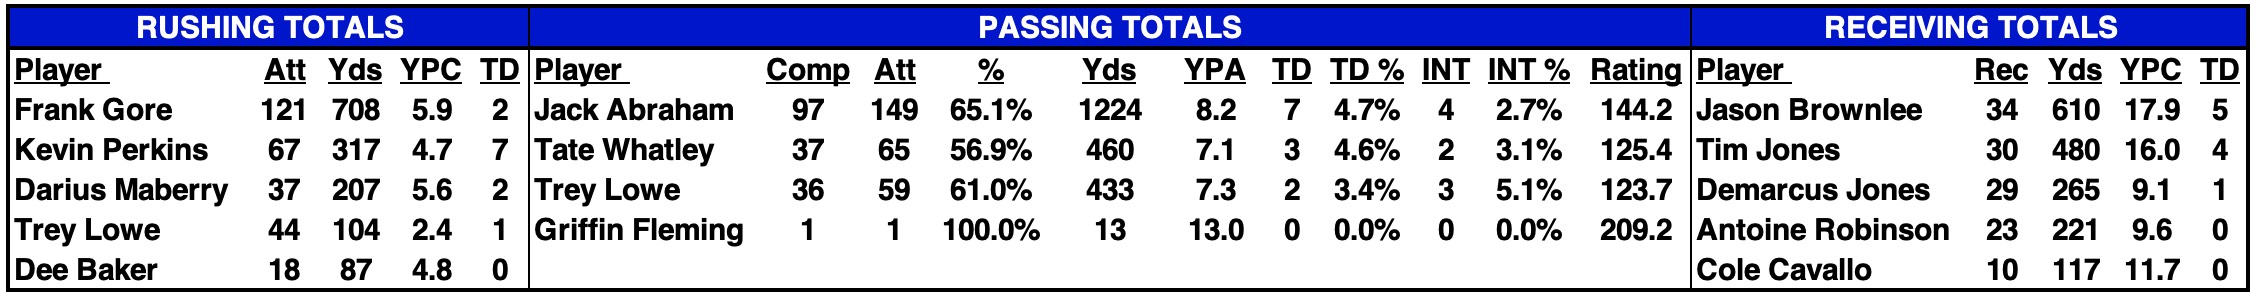
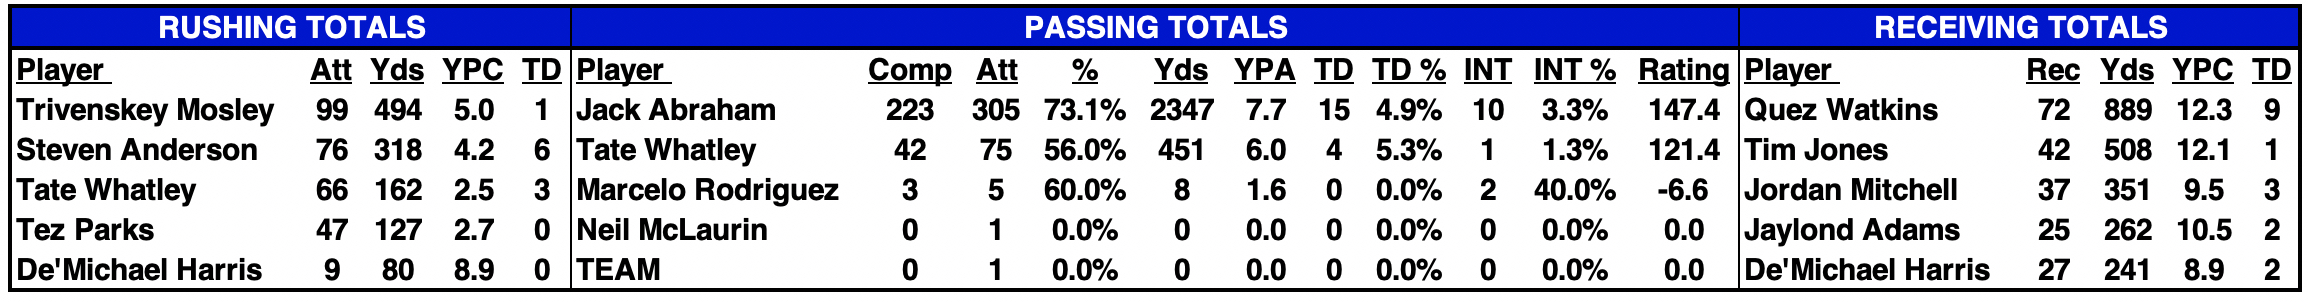
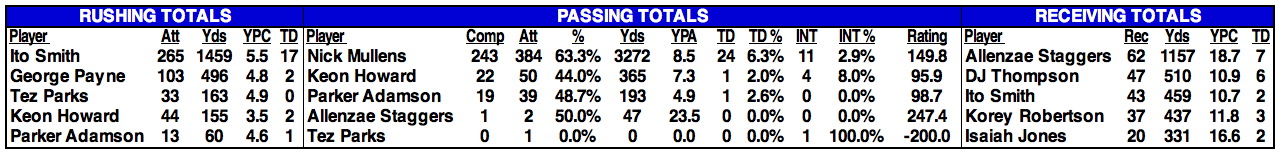
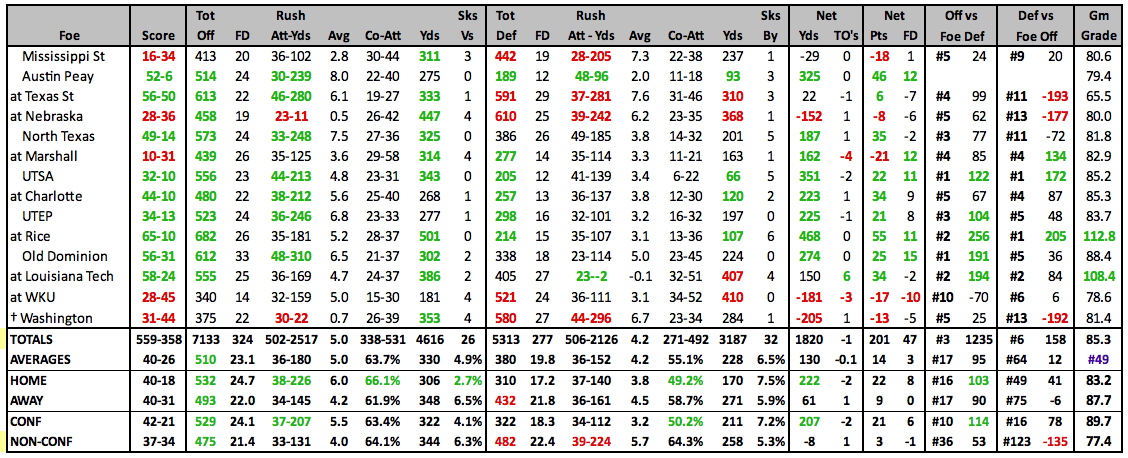
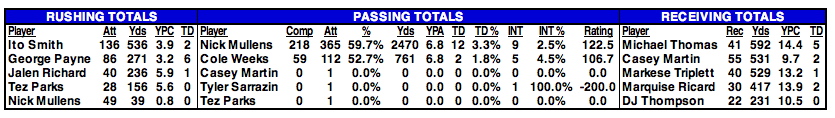
| 2024 STATISTICAL LEADERS |
|---|
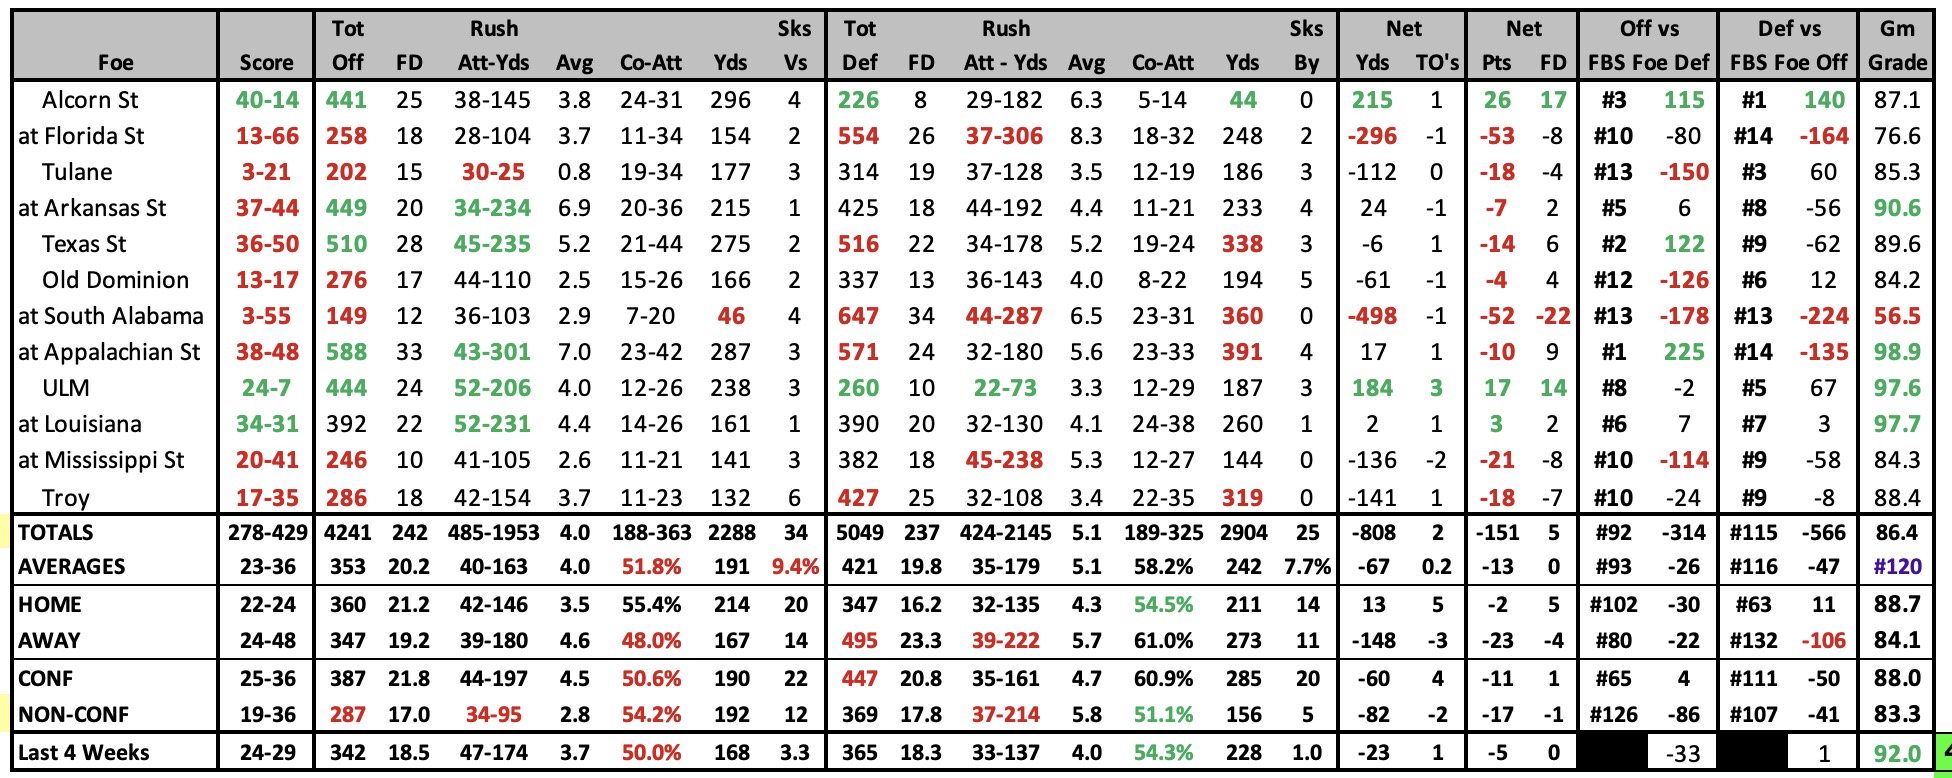
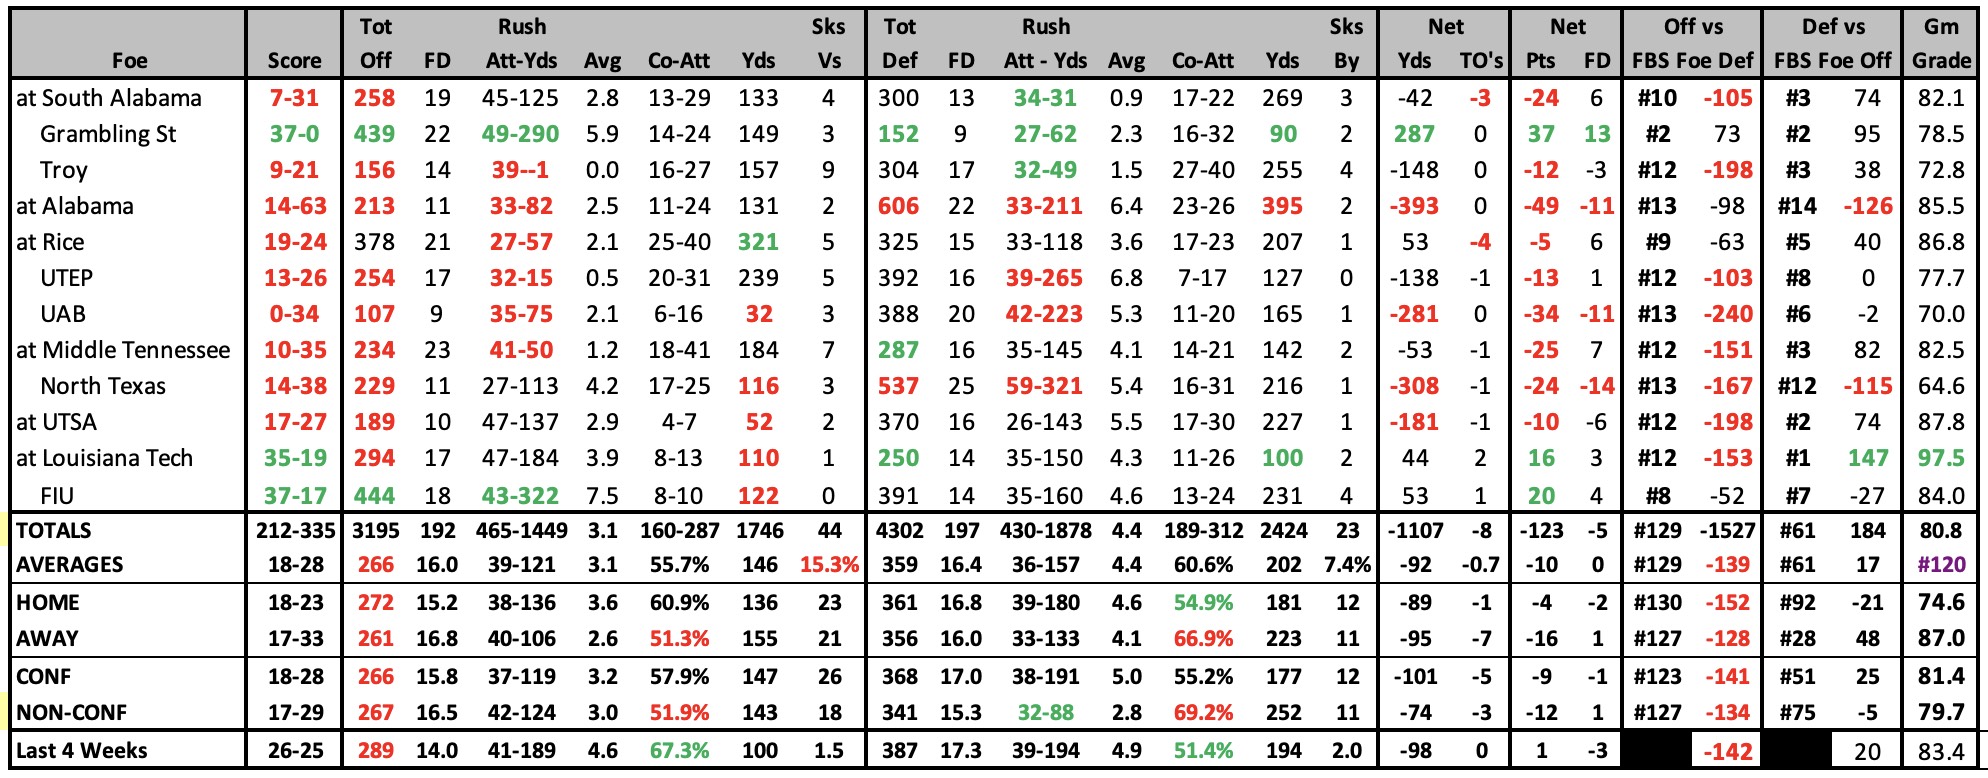
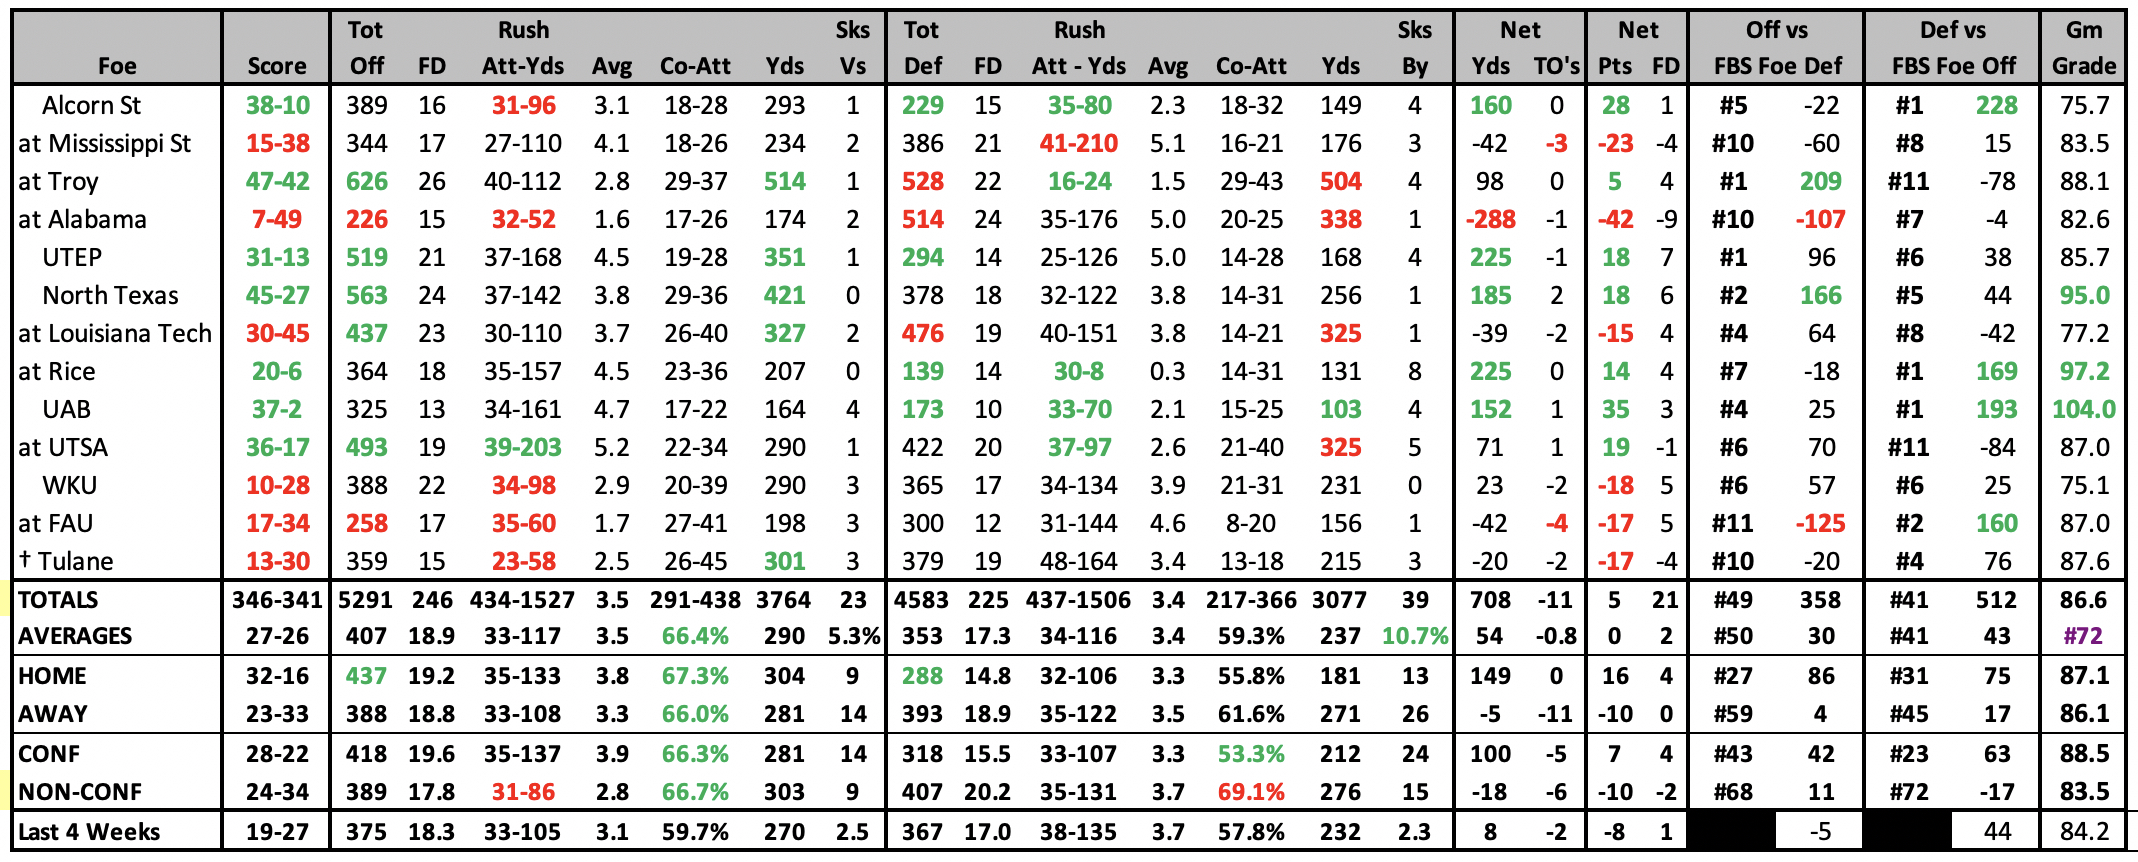
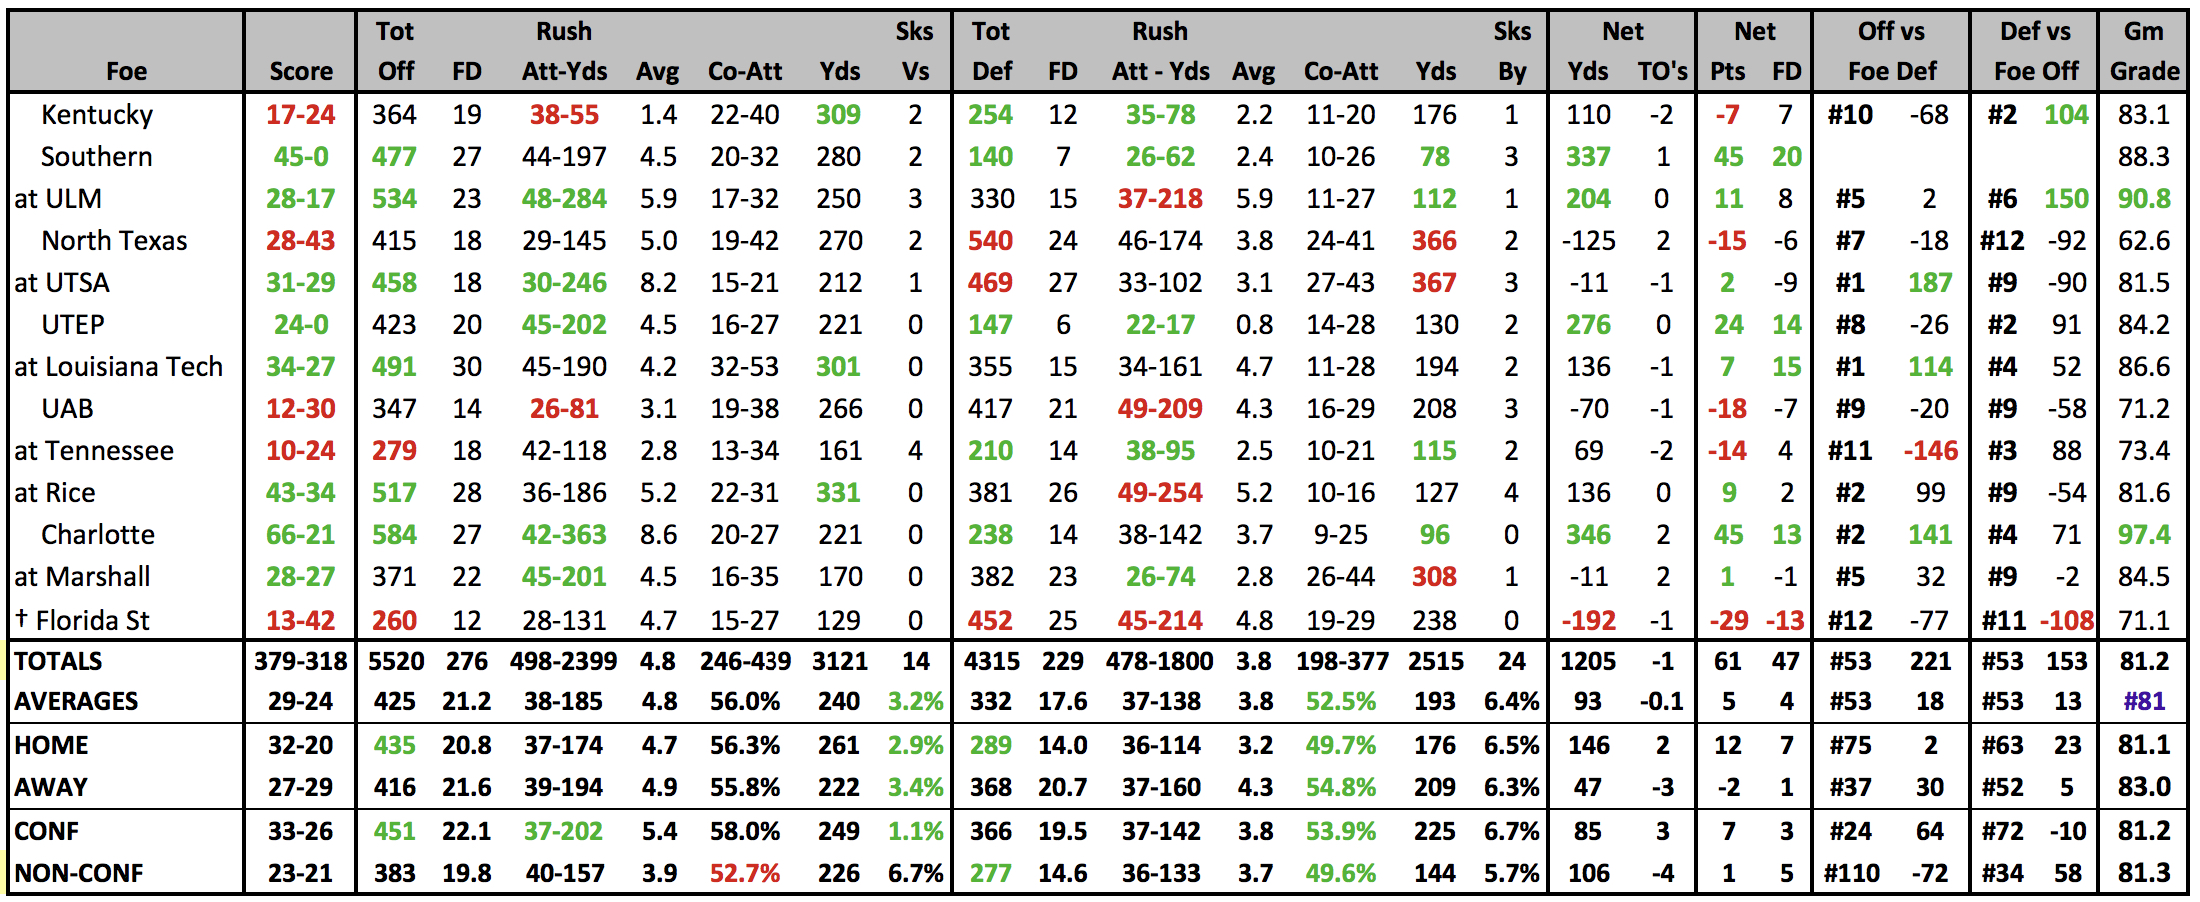
| 2024 GAME BY GAME STATS |
|---|
 |
2024 SCHEDULE |
2023 RESULTS |
||||||||||||||||||||||||||||||||||||||||||||||||||||||||||||||||||||||||||||||||||||||||||||||||||||||||||||||||||||||||||||||||||||||||||||||||||||||||||||||||||||||||||||||||||||||||||||||||
|
|
| 2023 STATISTICAL LEADERS |
|---|
| 2023 GAME BY GAME STATS |
|---|
 |
2023 SCHEDULE |
2022 RESULTS |
||||||||||||||||||||||||||||||||||||||||||||||||||||||||||||||||||||||||||||||||||||||||||||||||||||||||||||||||||||||||||||||||||||||||||||||||||||||||||||||||||||||||||||||||||||||||||||||||||||||
|
|
||||||||||||||||||||||||||||||||||||||||||||||||||||||||||||||||||||||||||||||||||||||||||||||||||||||||||||||||||||||||||||||||||||||||||||||||||||||||||||||||||||||||||||||||||||||||||||||||||||||
| 2022 STATISTICAL LEADERS |
|---|
| 2022 GAME BY GAME STATS |
|---|
 |
2022 SCHEDULE |
2021 RESULTS |
||||||||||||||||||||||||||||||||||||||||||||||||||||||||||||||||||||||||||||||||||||||||||||||||||||||||||||||||||||||||||||||||||||||||||||||||||||||||||||||||||||||||||||||||||||||||||||||||
Lendingtree Bowl
|
|
||||||||||||||||||||||||||||||||||||||||||||||||||||||||||||||||||||||||||||||||||||||||||||||||||||||||||||||||||||||||||||||||||||||||||||||||||||||||||||||||||||||||||||||||||||||||||||||||
| 2021 STATISTICAL LEADERS |
|---|
| 2021 GAME BY GAME STATS |
|---|
 |
2021 SCHEDULE |
2020 RESULTS |
||||||||||||||||||||||||||||||||||||||||||||||||||||||||||||||||||||||||||||||||||||||||||||||||||||||||||||||||||||||||||||||||||||||||||||||||||||||||||||||||||||||||||||||||||||
|
|
| 2020 STATISTICAL LEADERS |
|---|
| 2020 GAME BY GAME STATS |
|---|
 |
2020 SCHEDULE |
2019 RESULTS |
||||||||||||||||||||||||||||||||||||||||||||||||||||||||||||||||||||||||||||||||||||||||||||||||||||||||||||||||||||||||||||||||||||||||||||||||||||||||||||||||||||||||||||||||||||||||||||||||||||||
|
|
||||||||||||||||||||||||||||||||||||||||||||||||||||||||||||||||||||||||||||||||||||||||||||||||||||||||||||||||||||||||||||||||||||||||||||||||||||||||||||||||||||||||||||||||||||||||||||||||||||||
| 2019 STATISTICAL LEADERS |
|---|
| 2019 GAME BY GAME STATS |
|---|
 |
2019 SCHEDULE |
2018 RESULTS |
|||||||||||||||||||||||||||||||||||||||||||||||||||||||||||||||||||||||||||||||||||||||||||||||||||||||||||||||||||||||||||||||||||||||||||||||||||||||||||||||||||||||||||||||||||||||||||||||||||||||||||||||||||||
|
|
|||||||||||||||||||||||||||||||||||||||||||||||||||||||||||||||||||||||||||||||||||||||||||||||||||||||||||||||||||||||||||||||||||||||||||||||||||||||||||||||||||||||||||||||||||||||||||||||||||||||||||||||||||||
| 2018 STATISTICAL LEADERS |
|---|
| 2018 GAME BY GAME STATS |
|---|
 |
2018 SCHEDULE |
2017 RESULTS |
||||||||||||||||||||||||||||||||||||||||||||||||||||||||||||||||||||||||||||||||||||||||||||||||||||||||||||||||||||||||||||||||||||||||||||||||||||||||||||||||||||||||||||||||||||||||||||||||||||||||||||||||||||||||||||||||
|
|
||||||||||||||||||||||||||||||||||||||||||||||||||||||||||||||||||||||||||||||||||||||||||||||||||||||||||||||||||||||||||||||||||||||||||||||||||||||||||||||||||||||||||||||||||||||||||||||||||||||||||||||||||||||||||||||||
| 2017 STATISTICAL LEADERS |
|---|
| 2017 GAME BY GAME STATS |
|---|
 |
2017 SCHEDULE |
2016 RESULTS |
||||||||||||||||||||||||||||||||||||||||||||||||||||||||||||||||||||||||||||||||||||||||||||||||||||||||||||||||||||||||||||||||||||||||||||||||||||||||||||||||||||||||||||||||||||||||||||||||||||||||||||||||||||||||||||||||||||||||||||||
|
|
||||||||||||||||||||||||||||||||||||||||||||||||||||||||||||||||||||||||||||||||||||||||||||||||||||||||||||||||||||||||||||||||||||||||||||||||||||||||||||||||||||||||||||||||||||||||||||||||||||||||||||||||||||||||||||||||||||||||||||||
| 2016 STATISTICAL LEADERS |
|---|
| 2016 GAME BY GAME STATS |
|---|
 |
| 2015 STATISTICAL LEADERS |
|---|
| 2015 GAME BY GAME STATS |
|---|
 |
2015 SCHEDULE |
2014 RESULTS |
|||||||||||||||||||||||||||||||||||||||||||||||||||||||||||||||||||||||||||||||||||||||||||||||||||||||||||||||||||||||||||||||||||||||||||||||||||||||||||||||||||||||||||||||||||||||||||||||||||||||||||||||||||||||||||||||||||||||
|
|
|||||||||||||||||||||||||||||||||||||||||||||||||||||||||||||||||||||||||||||||||||||||||||||||||||||||||||||||||||||||||||||||||||||||||||||||||||||||||||||||||||||||||||||||||||||||||||||||||||||||||||||||||||||||||||||||||||||||
| 2014 STATISTICAL LEADERS |
|---|
| 2014 GAME BY GAME STATS |
|---|
 |
| 2013 STATISTICAL LEADERS |
|---|
| Player | Att | Yds | YPC | TD | Player | Comp | Att | % | Yds | YPA | TD | INT | Rating | Player | Rec | Yds | YPC | TD |
| Kendrick Hardy | 93 | 417 | 4.5 | 2 | Nick Mullens | 136 | 276 | 49.3% | 1776 | 6.4 | 13 | 14 | 108.7 | Markese Triplett | 33 | 558 | 16.9 | 4 |
| Jalen Richard | 84 | 318 | 3.8 | 0 | Allan Bridgford | 112 | 207 | 54.1% | 1133 | 5.5 | 6 | 11 | 99.0 | Tyre'oune Holmes | 51 | 387 | 7.6 | 2 |
| George Payne | 43 | 173 | 4.0 | 1 | Matthew Moseley | 1 | 1 | 100.0% | 2 | 2.0 | 0 | 0 | 116.8 | Marquise Ricard | 27 | 351 | 13.0 | 3 |
| 2013 GAME BY GAME STATS |
|---|
 |
2013 RESULTS |
2012 RESULTS |
|||||||||||||||||||||||||||||||||||||||||||||||||||||||||||||||||||||||||||||||||||||||||||||||||||||||||||||||||||||||||||||||||||||||||||||||||||||||||||||||||||||||||||||||||||||||||||||||||||||||||||||||||||||||||||||||||||||||||||||||||||||||
|
|
|||||||||||||||||||||||||||||||||||||||||||||||||||||||||||||||||||||||||||||||||||||||||||||||||||||||||||||||||||||||||||||||||||||||||||||||||||||||||||||||||||||||||||||||||||||||||||||||||||||||||||||||||||||||||||||||||||||||||||||||||||||||
| 2012 STATISTICAL LEADERS |
|---|
| Player | Att | Yds | YPC | TD | Player | Comp | Att | % | Yds | YPA | TD | INT | Rating | Player | Rec | Yds | YPC | TD | ||
| Desmond Johnson | 82 | 460 | 5.6 | 2 | Anthony Alford | 57 | 127 | 44.9% | 664 | 5.2 | 2 | 4 | 87.7 | Dominique Sullivan | 19 | 331 | 17.4 | 3 | ||
| Anthony Alford | 121 | 388 | 3.2 | 7 | Arsenio Favor | 37 | 67 | 55.2% | 650 | 9.7 | 3 | 3 | 142.5 | Tracy Lampley | 25 | 330 | 13.2 | 0 | ||
| Jalen Richard | 80 | 382 | 4.8 | 4 | Chris Campbell | 27 | 55 | 49.1% | 322 | 5.9 | 3 | 2 | 109.0 | Justin Sims | 20 | 294 | 14.7 | 0 |
| 2012 Individual Player Stats • 2012 Start Chart/ Starters Lost |
|---|
| 2012 GAME BY GAME STATS |
|---|
 |
| 2011 STATISTICAL LEADERS |
|---|
| Player | Att | Yds | YPC | TD | Player | Comp | Att | % | Yds | YPA | TD | INT | Rating | Player | Rec | Yds | YPC | TD | ||
| Jamal Woodyard | 110 | 731 | 6.6 | 3 | Austin Davis | 286 | 475 | 60.2% | 3496 | 7.4 | 30 | 11 | 138.2 | Ryan Balentine | 49 | 742 | 15.1 | 8 | ||
| Tracy Lampley | 91 | 465 | 5.1 | 3 | Quentin Pierce | 3 | 7 | 42.9% | 45 | 6.4 | 1 | 1 | 115.4 | Kelvin Bolden | 58 | 671 | 11.6 | 7 | ||
| Kendrick Hardy | 72 | 426 | 5.9 | 2 | Peter Boehme | 2 | 2 | 100.0% | 38 | 19.0 | 1 | 0 | 424.6 | Tracy Lampley | 47 | 574 | 12.2 | 4 |
| 2011 Individual Player Stats • 2011 Start Chart/ Starters Lost |
|---|
| 2011 GAME BY GAME STATS |
|---|
2011 RESULTS |
2010 RESULTS |
||||||||||||||||||||||||||||||||||||||||||||||||||||||||||||||||||||||||||||||||||||||||||||||||||||||||||||||||||||||||||||||||||||||||||||||||||||||||||||||||||||||||||||||||||||||||||||||||||||||||||||||||
|
|
||||||||||||||||||||||||||||||||||||||||||||||||||||||||||||||||||||||||||||||||||||||||||||||||||||||||||||||||||||||||||||||||||||||||||||||||||||||||||||||||||||||||||||||||||||||||||||||||||||||||||||||||
| 2010 STATISTICAL LEADERS |
|---|
| Player | Att | Yds | YPC | TD | Player | Comp | Att | % | Yds | YPA | TD | INT | Rating | Player | Rec | Yds | YPC | TD | ||
| Kendrick Hardy | 139 | 903 | 6.50 | 7 | Austin Davis | 278 | 442 | 62.9% | 3103 | 7.0 | 20 | 6 | 134.1 | Kelvin Bolden | 46 | 722 | 15.7 | 6 | ||
| Desmond Johnson | 115 | 611 | 5.31 | 8 | Martevious Young | 12 | 23 | 52.2% | 132 | 5.7 | 1 | 1 | 106.0 | Johdrick Morris | 50 | 684 | 13.7 | 4 | ||
| Austen Davis | 145 | 452 | 3.12 | 10 | Quentin Pierce | 2 | 2 | 100.0% | 43 | 21.5 | 2 | 0 | 610.6 | Quentin Pierce | 38 | 454 | 11.9 | 4 |
| 2010 GAME BY GAME STATS |
|---|
| 2009 STATISTICAL LEADERS |
|---|
| Player | Att | Yds | YPC | TD | Player | Comp | Att | % | Yds | YPA | TD | INT | Rating | Player | Rec | Yds | YPC | TD | ||
| Damion Fletcher | 202 | 937 | 4.64 | 8 | Martevious Young | 114 | 196 | 58.2% | 1590 | 8.1 | 13 | 1 | 147.2 | Deandre Brown | 43 | 720 | 16.7 | 7 | ||
| Tory Harrison | 95 | 626 | 6.59 | 9 | Austin Davis | 108 | 156 | 69.2% | 1165 | 7.5 | 10 | 2 | 150.6 | Gerald Baptiste | 34 | 441 | 13.0 | 5 | ||
| Martevious Young | 64 | 270 | 4.22 | 1 | Tory Harrison | 1 | 2 | 50.0% | 26 | 13.0 | 0 | 1 | 59.2 | Leroy Banks | 25 | 343 | 13.7 | 3 |
| 2009 Individual Player Stats |
|---|
| 2009 GAME BY GAME STATS |
|---|
2009 RESULTS |
2008 RESULTS |
|||||||||||||||||||||||||||||||||||||||||||||||||||||||||||||||||||||||||||||||||||||||||||||||||||||||||||||||||||||||||||||||||||||||||||||||||||||||||||
|
|
|||||||||||||||||||||||||||||||||||||||||||||||||||||||||||||||||||||||||||||||||||||||||||||||||||||||||||||||||||||||||||||||||||||||||||||||||||||||||||
| 2008 Individual Player Stats • 2007 Individual Player Stats |
|---|
OTHER INFORMATION |
||||||||||||||||||||||||||||||||||||||||||||||||||||
|
||||||||||||||||||||||||||||||||||||||||||||||||||||