| AUBURN TIGERS |
|---|
|
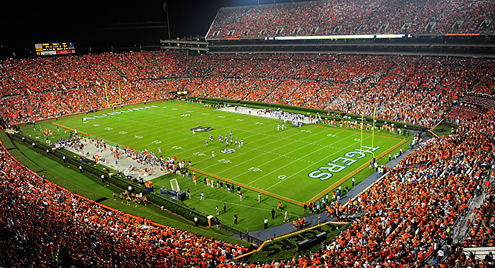
STADIUM: Jordan-Hare Stadium |
 |
|
| LOCATION: Auburn, Alabama | |
| FOUNDED: 1856 | |
| ENROLLMENT: 29,779 | |
| COLORS: Burnt Orange & Navy Blue | |
| MASCOT: Auble | |
| CONFERENCE: SEC | |
| HEAD COACH: Hugh Freeze | |
| YEARS WITH TEAM: 3rd | |
| OVERALL RECORD: 94-56 | |
| RECORD WITH TEAM: 11-14 | |
| 2025 Individual Player Stats |
2025 Start Chart |
Last 40+ Years Results |
Last 20 Years - Leaders |
Draft History |
|---|
| 2025 STATISTICAL LEADERS |
|---|

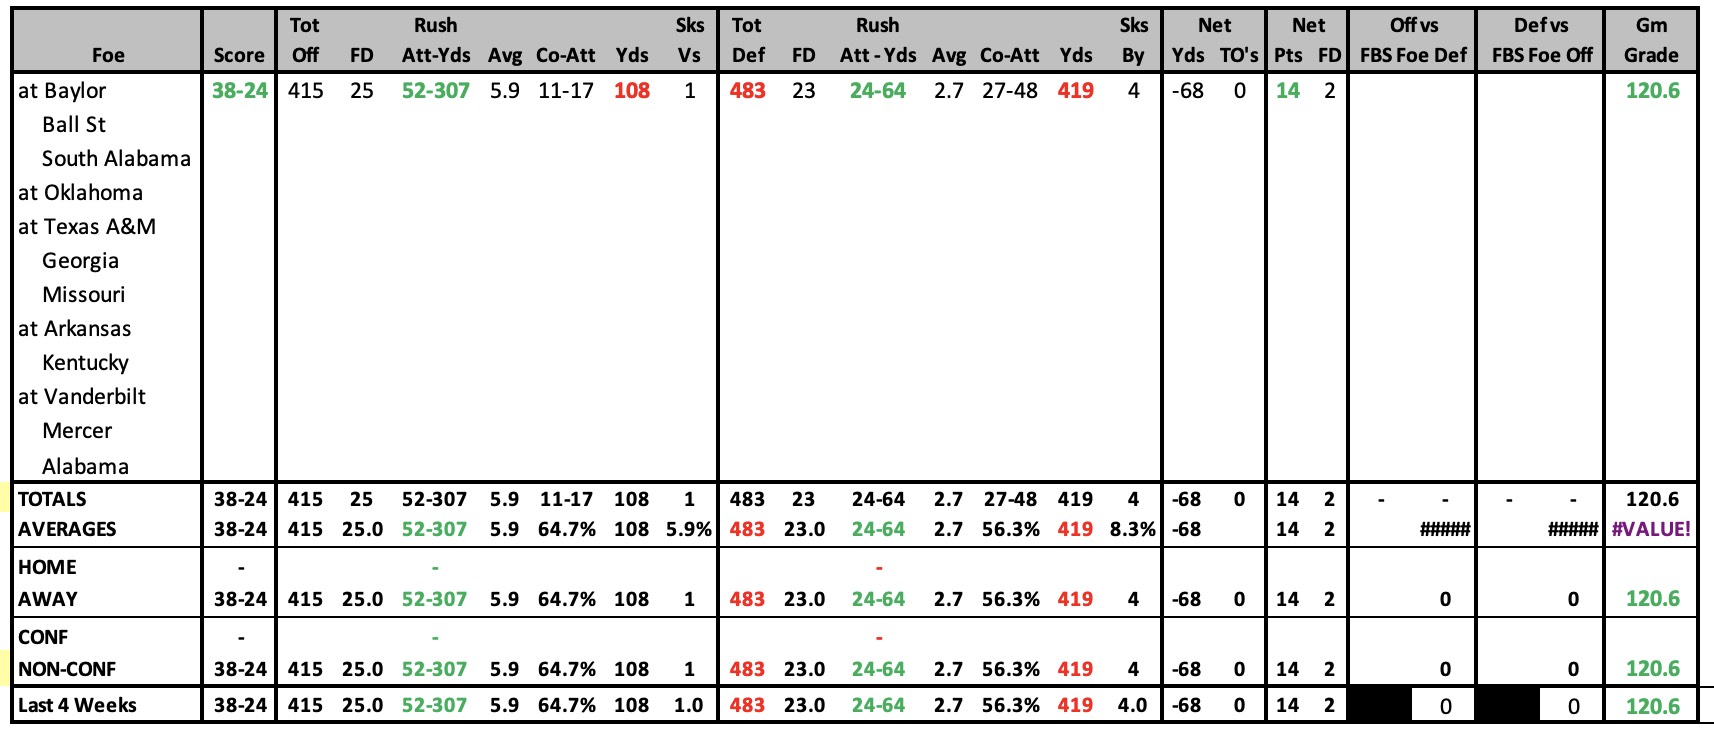
| 2025 GAME-BY-GAME STATS | |||
|---|---|---|---|
 |
2025 SCHEDULE |
2024 RESULTS |
||||||||||||||||||||||||||||||||||||||||||||||||||||||||||||||||||||||||||||||||||||||||||||||||||||||||||||||||||||||||||||||||||||||||||||||||||||||||||||||||||||||||||||||||||||||||||||||||
|
|
| 2024 STATISTICAL LEADERS |
|---|

| 2024 Individual Player Stats |
2024 Start Chart |
|---|
| 2024 GAME-BY-GAME STATS | |||
|---|---|---|---|
 |
2024 SCHEDULE |
2023 RESULTS |
||||||||||||||||||||||||||||||||||||||||||||||||||||||||||||||||||||||||||||||||||||||||||||||||||||||||||||||||||||||||||||||||||||||||||||||||||||||||||||||||||||||||||||||||||||||||||||||||
|
|
||||||||||||||||||||||||||||||||||||||||||||||||||||||||||||||||||||||||||||||||||||||||||||||||||||||||||||||||||||||||||||||||||||||||||||||||||||||||||||||||||||||||||||||||||||||||||||||||
| 2023 STATISTICAL LEADERS |
|---|

| 2023 Individual Player Stats |
2023 Start Chart |
|---|
| 2023 GAME-BY-GAME STATS | |||
|---|---|---|---|
 |
2023 SCHEDULE |
2022 RESULTS |
||||||||||||||||||||||||||||||||||||||||||||||||||||||||||||||||||||||||||||||||||||||||||||||||||||||||||||||||||||||||||||||||||||||||||||||||||||||||||||||||||||||||||||||||||||||||||||||||
|
|
||||||||||||||||||||||||||||||||||||||||||||||||||||||||||||||||||||||||||||||||||||||||||||||||||||||||||||||||||||||||||||||||||||||||||||||||||||||||||||||||||||||||||||||||||||||||||||||||
| 2022 STATISTICAL LEADERS |
|---|

| 2022 Individual Player Stats |
2022 Start Chart |
|---|
| 2022 GAME-BY-GAME STATS | |||
|---|---|---|---|
 |
2022 SCHEDULE |
2021 RESULTS |
||||||||||||||||||||||||||||||||||||||||||||||||||||||||||||||||||||||||||||||||||||||||||||||||||||||||||||||||||||||||||||||||||||||||||||||||||||||||||||||||||||||||||||||||||||||||||||||||
|
|
||||||||||||||||||||||||||||||||||||||||||||||||||||||||||||||||||||||||||||||||||||||||||||||||||||||||||||||||||||||||||||||||||||||||||||||||||||||||||||||||||||||||||||||||||||||||||||||||
| 2021 STATISTICAL LEADERS |
|---|

| 2021 Individual Player Stats |
2021 Start Chart |
|---|
| 2021 GAME-BY-GAME STATS | |||
|---|---|---|---|
 |
2021 SCHEDULE |
2020 RESULTS |
||||||||||||||||||||||||||||||||||||||||||||||||||||||||||||||||||||||||||||||||||||||||||||||||||||||||||||||||||||||||||||||||||||||||||||||||||||||||||||||||||||||||||||||||||||||||||||||||
|
|
||||||||||||||||||||||||||||||||||||||||||||||||||||||||||||||||||||||||||||||||||||||||||||||||||||||||||||||||||||||||||||||||||||||||||||||||||||||||||||||||||||||||||||||||||||||||||||||||
| 2020 STATISTICAL LEADERS |
|---|

| 2020 Individual Player Stats |
2020 Start Chart |
|---|
| 2020 GAME-BY-GAME STATS | |||
|---|---|---|---|
 |
2020 SCHEDULE |
2019 RESULTS |
||||||||||||||||||||||||||||||||||||||||||||||||||||||||||||||||||||||||||||||||||||||||||||||||||||||||||||||||||||||||||||||||||||||||||||||||||||||||||||||||||||||||||||||||||||||||||||||||||||||||||||
|
|
||||||||||||||||||||||||||||||||||||||||||||||||||||||||||||||||||||||||||||||||||||||||||||||||||||||||||||||||||||||||||||||||||||||||||||||||||||||||||||||||||||||||||||||||||||||||||||||||||||||||||||
| 2019 STATISTICAL LEADERS |
|---|

| 2019 Individual Player Stats |
2019 Start Chart |
|---|
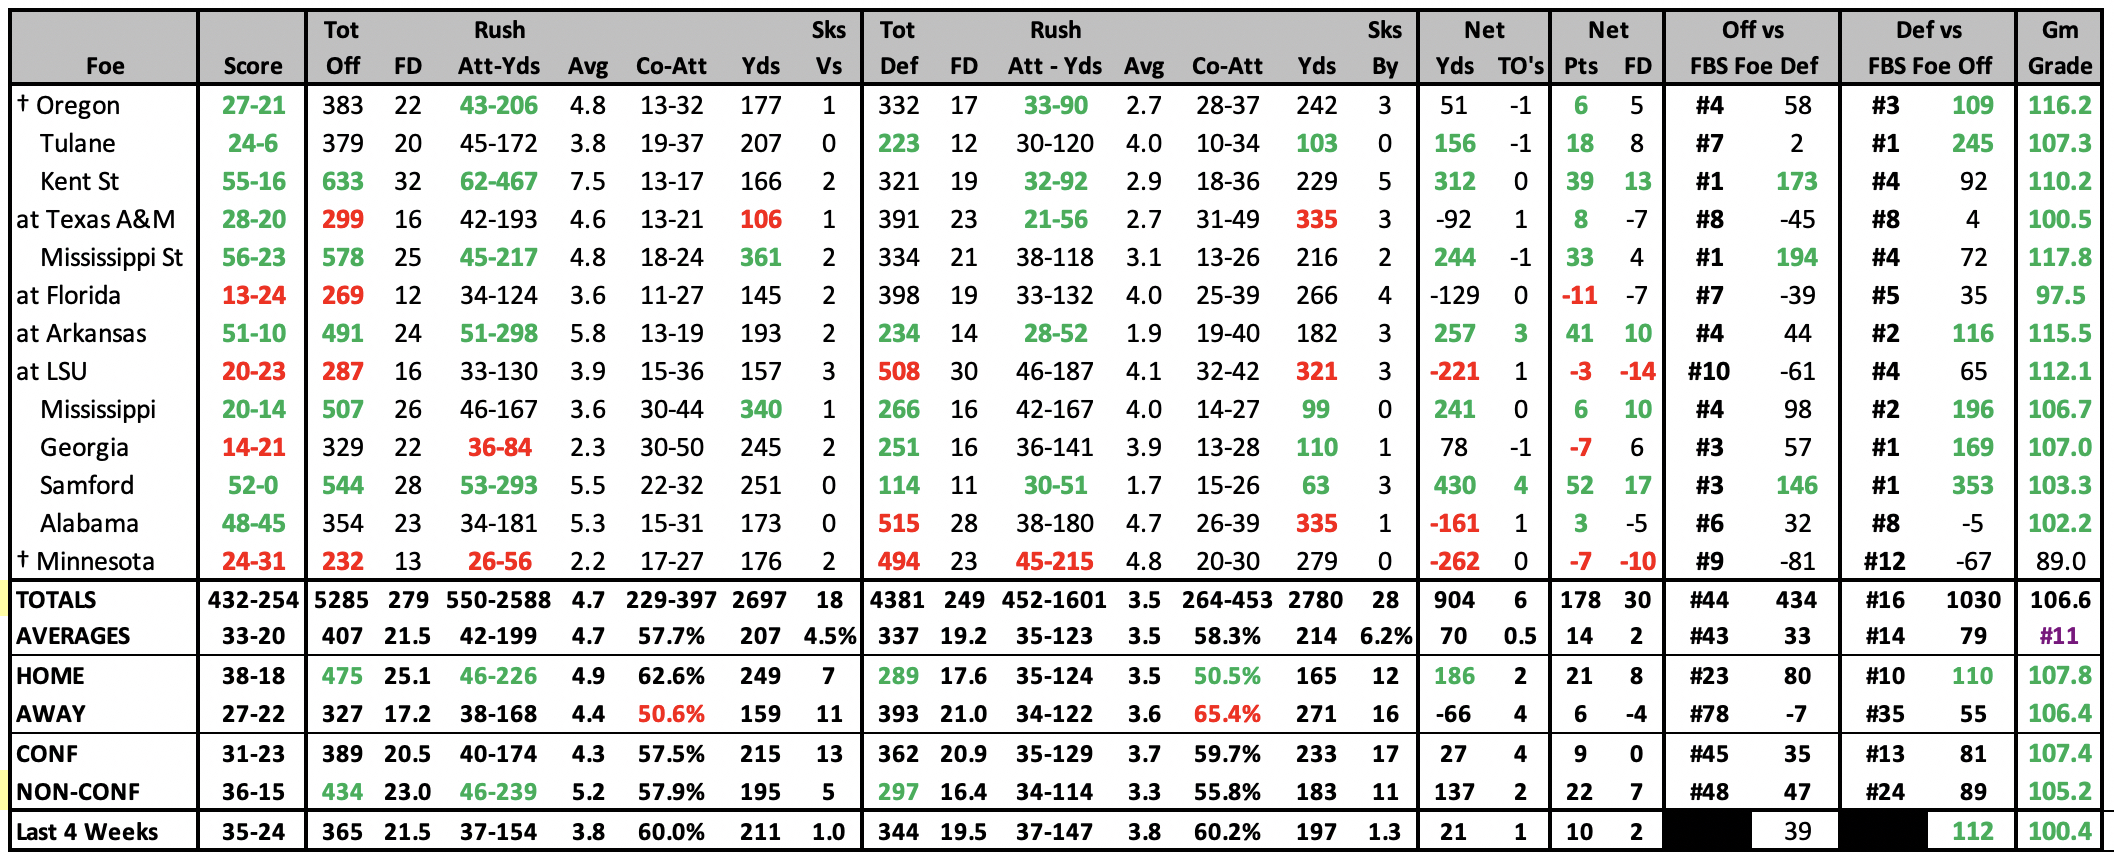
| 2019 GAME-BY-GAME STATS | |||
|---|---|---|---|
 |
2019 SCHEDULE |
2018 RESULTS |
||||||||||||||||||||||||||||||||||||||||||||||||||||||||||||||||||||||||||||||||||||||||||||||||||||||||||||||||||||||||||||||||||||||||||||||||||||||||||||||||||||||||||||||||||||||||||||||||||||||||||||||||||||||||||||
|
|
||||||||||||||||||||||||||||||||||||||||||||||||||||||||||||||||||||||||||||||||||||||||||||||||||||||||||||||||||||||||||||||||||||||||||||||||||||||||||||||||||||||||||||||||||||||||||||||||||||||||||||||||||||||||||||
| 2018 STATISTICAL LEADERS |
|---|

| 2018 Individual Player Stats |
2018 Start Chart |
|---|
| 2018 GAME-BY-GAME STATS | |||
|---|---|---|---|
 |
2018 SCHEDULE |
2017 RESULTS |
||||||||||||||||||||||||||||||||||||||||||||||||||||||||||||||||||||||||||||||||||||||||||||||||||||||||||||||||||||||||||||||||||||||||||||||||||||||||||||||||||||||||||||||||||||||||||||||||||||||||||||||||||||||||||||||||||||||||||||||
|
|
||||||||||||||||||||||||||||||||||||||||||||||||||||||||||||||||||||||||||||||||||||||||||||||||||||||||||||||||||||||||||||||||||||||||||||||||||||||||||||||||||||||||||||||||||||||||||||||||||||||||||||||||||||||||||||||||||||||||||||||
| 2017 STATISTICAL LEADERS |
|---|

| 2017 Individual Player Stats |
2017 Start Chart |
|---|
| 2017 GAME-BY-GAME STATS | |||
|---|---|---|---|
 |
2017 SCHEDULE |
2016 RESULTS |
|||||||||||||||||||||||||||||||||||||||||||||||||||||||||||||||||||||||||||||||||||||||||||||||||||||||||||||||||||||||||||||||||||||||||||||||||||||||||||||||||||||||||||||||||||||||||||||||||||||||||||||||||||||||||||||||||||||||||||||||||||||
|
|
|||||||||||||||||||||||||||||||||||||||||||||||||||||||||||||||||||||||||||||||||||||||||||||||||||||||||||||||||||||||||||||||||||||||||||||||||||||||||||||||||||||||||||||||||||||||||||||||||||||||||||||||||||||||||||||||||||||||||||||||||||||
| 2016 STATISTICAL LEADERS |
|---|

| 2016 Individual Player Stats |
2016 Start Chart |
|---|
| 2016 GAME-BY-GAME STATS | |||
|---|---|---|---|
 |
| 2015 STATISTICAL LEADERS |
|---|

| 2015 Individual Player Stats |
2015 Start Chart |
|---|
| 2015 GAME-BY-GAME STATS | |||
|---|---|---|---|
 |
2015 RESULTS |
2014 RESULTS |
||||||||||||||||||||||||||||||||||||||||||||||||||||||||||||||||||||||||||||||||||||||||||||||||||||||||||||||||||||||||||||||||||||||||||||||||||||||||||||||||||||||||||||||||||||||||||||||||||||||||||||||||||||||||||||||||||||||||||||||||||||||||||||
|
|
||||||||||||||||||||||||||||||||||||||||||||||||||||||||||||||||||||||||||||||||||||||||||||||||||||||||||||||||||||||||||||||||||||||||||||||||||||||||||||||||||||||||||||||||||||||||||||||||||||||||||||||||||||||||||||||||||||||||||||||||||||||||||||
| 2014 STATISTICAL LEADERS |
|---|

| 2014 Individual Player Stats |
2014 Start Chart |
|---|
| 2014 GAME-BY-GAME STATS | |||
|---|---|---|---|
 |
| 2013 STATISTICAL LEADERS |
|---|
| Player | Att | Yds | YPC | TD | Player | Comp | Att | % | Yds | YPA | TD | INT | Rating | Player | Rec | Yds | YPC | TD |
| Tre Mason | 318 | 1831 | 5.8 | 23 | Nick Marshall | 142 | 239 | 59.4% | 1976 | 8.3 | 14 | 6 | 143.2 | Sammie Coates | 42 | 902 | 21.5 | 7 |
| Nick Marshall | 172 | 1068 | 6.2 | 12 | Jeremy Johnson | 29 | 41 | 70.7% | 422 | 10.3 | 6 | 2 | 195.7 | Ricardo Louis | 28 | 325 | 11.6 | 2 |
| Corey Grant | 65 | 631 | 9.7 | 6 | Jonathan Wallace | 2 | 4 | 50.0% | 24 | 6.0 | 0 | 0 | 100.4 | Marcus Davis | 23 | 217 | 9.4 | 1 |
| 2013 Individual Player Stats |
2013 Start Chart/ Starters Lost |
|---|
| 2013 GAME-BY-GAME STATS | |||
|---|---|---|---|
 |
2013 RESULTS |
2012 RESULTS |
|||||||||||||||||||||||||||||||||||||||||||||||||||||||||||||||||||||||||||||||||||||||||||||||||||||||||||||||||||||||||||||||||||||||||||||||||||||||||||||||||||||||||||||||||||||||||||||||||||||||||||||||||||||||||||||||||||||||||||||||||||||||||||||||||||||||||||||||||||
|
|
|||||||||||||||||||||||||||||||||||||||||||||||||||||||||||||||||||||||||||||||||||||||||||||||||||||||||||||||||||||||||||||||||||||||||||||||||||||||||||||||||||||||||||||||||||||||||||||||||||||||||||||||||||||||||||||||||||||||||||||||||||||||||||||||||||||||||||||||||||
| 2012 STATISTICAL LEADERS |
|---|
| Player | Att | Yds | YPC | TD | Player | Comp | Att | % | Yds | YPA | TD | INT | Rating | Player | Rec | Yds | YPC | TD | ||
| Tre Mason | 178 | 1033 | 5.8 | 8 | Kiehl Frazier | 62 | 116 | 53.4% | 753 | 6.5 | 2 | 8 | 99.9 | Emory Blake | 50 | 793 | 15.9 | 3 | ||
| Onterio McCalebb | 94 | 570 | 6.1 | 6 | Jonathan Wallace | 46 | 80 | 57.5% | 724 | 9.1 | 4 | 4 | 140.0 | Phillip Lutzenkirchen | 15 | 139 | 9.3 | 0 | ||
| Mike Blakely | 33 | 153 | 4.6 | 0 | Clint Moseley | 38 | 60 | 63.3% | 373 | 6.2 | 1 | 3 | 111.1 | CJ Uzomah | 7 | 136 | 19.4 | 1 |
| 2012 Individual Player Stats • 2012 Start Chart/Starters Lost |
|---|
| 2012 GAME-BY-GAME STATS | |||
|---|---|---|---|
 |
| 2011 STATISTICAL LEADERS |
|---|
| Player | Att | Yds | YPC | TD | Player | Comp | Att | % | Yds | YPA | TD | INT | Rating | Player | Rec | Yds | YPC | TD | ||
| Michael Dyer | 242 | 1241 | 5.1 | 10 | Barrett Trotter | 92 | 167 | 55.1% | 1184 | 7.1 | 11 | 6 | 129.2 | Emory Blake | 36 | 613 | 17.0 | 5 | ||
| Onterio McCalebb | 112 | 641 | 5.7 | 5 | Clint Moseley | 66 | 106 | 62.3% | 801 | 7.6 | 5 | 2 | 137.5 | Onterio McCalebb | 32 | 344 | 10.8 | 2 | ||
| Kiehl Frazier | 76 | 326 | 4.3 | 3 | Kiehl Frazier | 5 | 14 | 35.7% | 34 | 2.4 | 0 | 3 | 13.3 | Phillip Lutzenkirchen | 24 | 238 | 9.9 | 7 |
| 2011 Individual Player Stats • 2011 START CHART/STARTERS LOST |
|---|
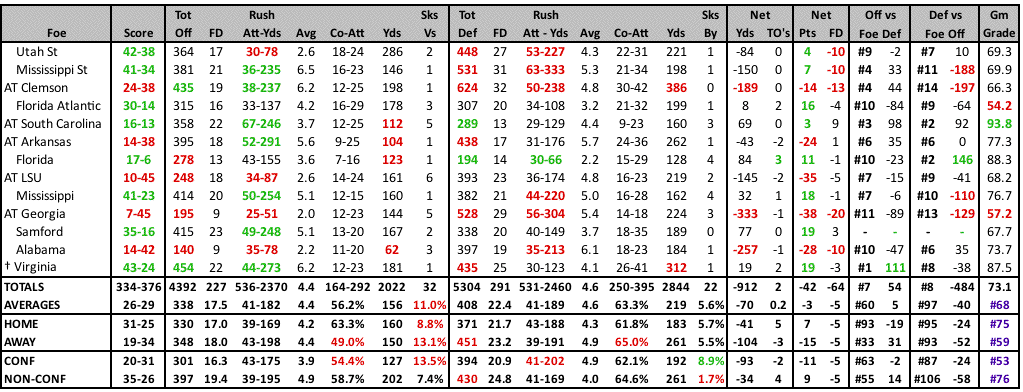
| 2011 GAME-BY-GAME STATS |
|---|
2011 RESULTS |
2010 RESULTS |
|||||||||||||||||||||||||||||||||||||||||||||||||||||||||||||||||||||||||||||||||||||||||||||||||||||||||||||||||||||||||||||||||||||||||||||||||||||||||||||||||||||||||||||||||||||||||||||||||||
|
|
|||||||||||||||||||||||||||||||||||||||||||||||||||||||||||||||||||||||||||||||||||||||||||||||||||||||||||||||||||||||||||||||||||||||||||||||||||||||||||||||||||||||||||||||||||||||||||||||||||
| 2010 STATISTICAL LEADERS |
|---|
| Player | Att | Yds | YPC | TD | Player | Comp | Att | % | Yds | YPA | TD | INT | Rating | Player | Rec | Yds | YPC | TD | ||
| Cameron Newton | 264 | 1473 | 5.6 | 20 | Cameron Newton | 185 | 280 | 66.1% | 2854 | 10.2 | 30 | 7 | 182.0 | Darvin Adams | 52 | 963 | 18.5 | 7 | ||
| Michael Dyer | 182 | 1093 | 6.0 | 5 | Barrett Trotter | 6 | 9 | 66.7% | 64 | 7.1 | 0 | 0 | 126.4 | Terrell Zachery | 43 | 605 | 14.1 | 4 | ||
| Onterio McCalebb | 95 | 810 | 8.5 | 9 | Neil Caudle | 1 | 1 | 100.0% | 42 | 42.0 | 0 | 0 | 452.8 | Emory Blake | 33 | 554 | 16.8 | 8 |
| 2010 Individual Player Stats |
|---|
| 2010 GAME-BY-GAME STATS |
|---|
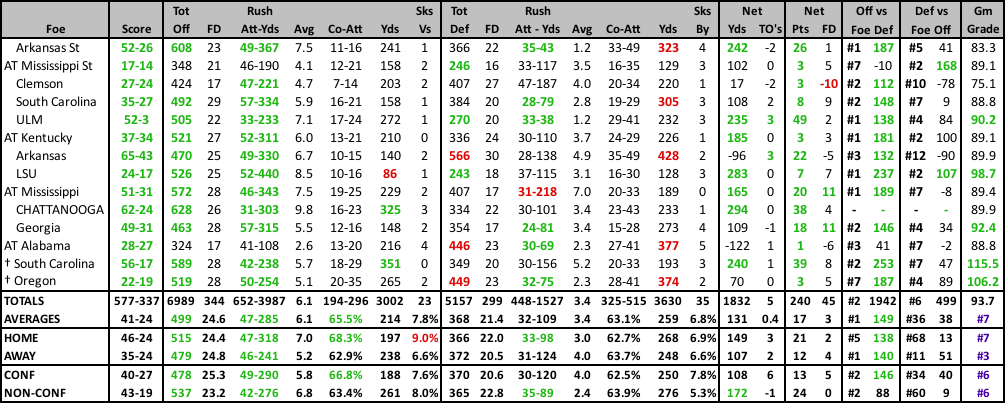
| 2009 STATISTICAL LEADERS |
|---|
| Player | Att | Yds | YPC | TD | Player | Comp | Att | % | Yds | YPA | TD | INT | Rating | Player | Rec | Yds | YPC | TD | ||
| Ben Tate | 225 | 1209 | 5.4 | 8 | Chris Todd | 163 | 272 | 59.9% | 2196 | 8.1 | 19 | 5 | 147.1 | Darvin Adams | 44 | 717 | 16.3 | 9 | ||
| Onterio McCalebb | 94 | 524 | 5.6 | 4 | Neil Caudle | 15 | 20 | 75.0% | 170 | 8.5 | 1 | 1 | 152.9 | Terrell Zachery | 23 | 468 | 20.3 | 5 | ||
| Mario Fannin | 31 | 257 | 8.3 | 0 | Kodi Burns | 5 | 12 | 41.7% | 75 | 6.3 | 2 | 0 | 149.2 | Mario Fannin | 35 | 383 | 10.9 | 3 |
| 2009 Individual Player Stats |
|---|
| 2009 GAME-BY-GAME STATS |
|---|
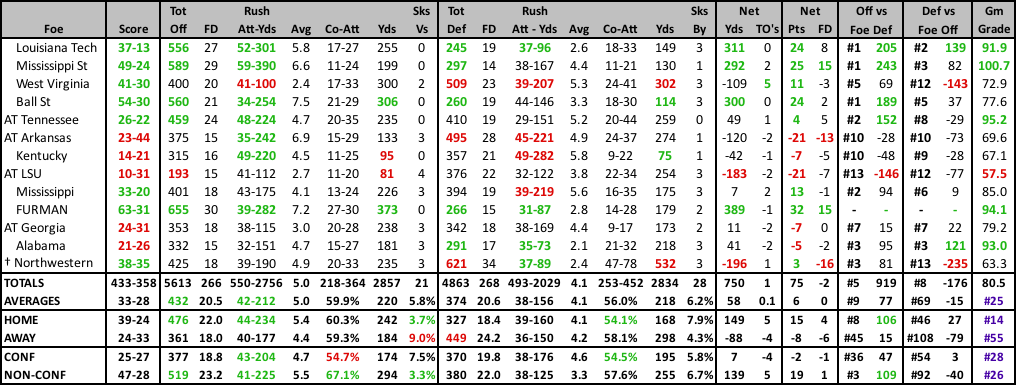
2009 RESULTS |
2008 RESULTS |
|||||||||||||||||||||||||||||||||||||||||||||||||||||||||||||||||||||||||||||||||||||||||||||||||||||||||||||||||||||||||||||||||||||||||||||||||
|
|
|||||||||||||||||||||||||||||||||||||||||||||||||||||||||||||||||||||||||||||||||||||||||||||||||||||||||||||||||||||||||||||||||||||||||||||||||

