
| KENTUCKY WILDCATS |
|---|
|
STADIUM: Kroger Field |
|
 |
||
KENTUCKY QUICK FACTS |
||
| LOCATION: Lexington, KY | ||
| FOUNDED: 1865 | ||
| ENROLLMENT: 33,885 | ||
| COLORS: Blue & White | ||
| MASCOT: Scratch | ||
| CONFERENCE: SEC | ||
| HEAD COACH: Mark Stoops | ||
| YEARS WITH TEAM: 13th | ||
| OVERALL RECORD: 77-73 | ||
| RECORD WITH TM: 77-73 | ||
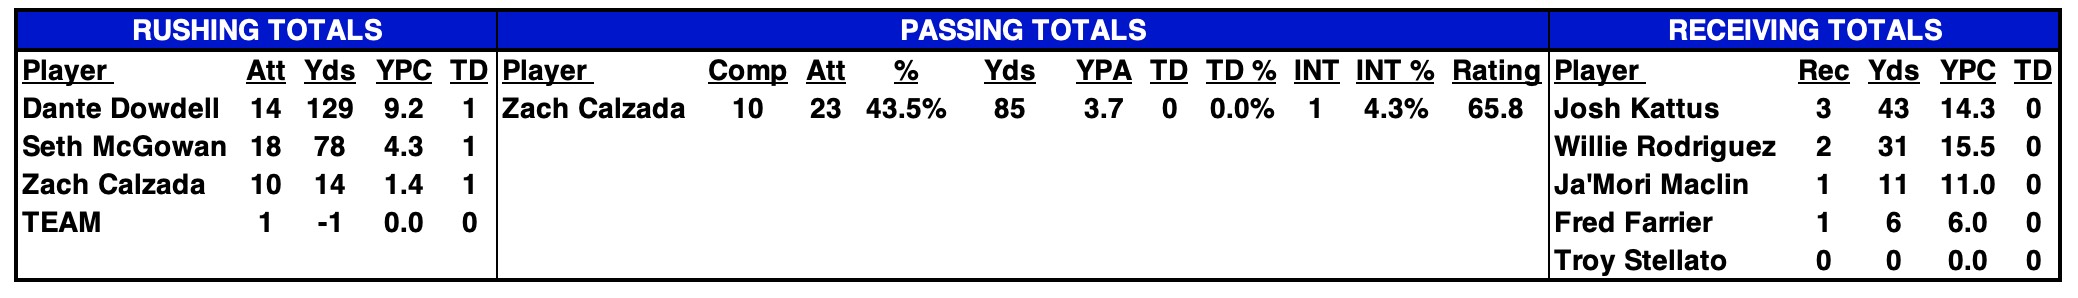
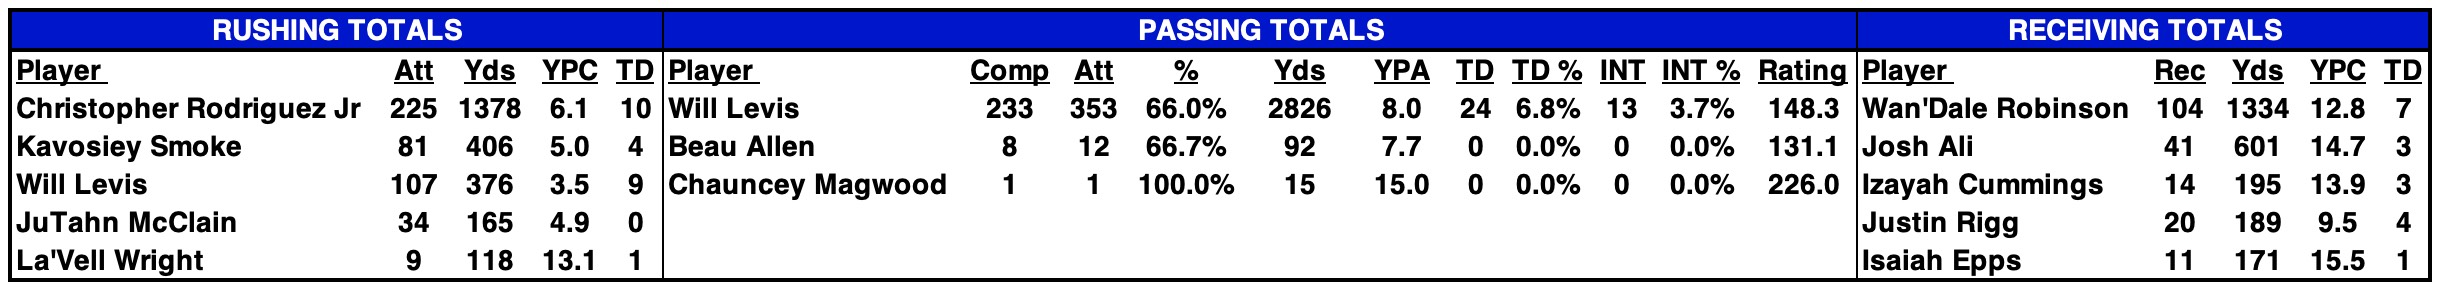
| 2025 STATISTICAL LEADERS |
|---|
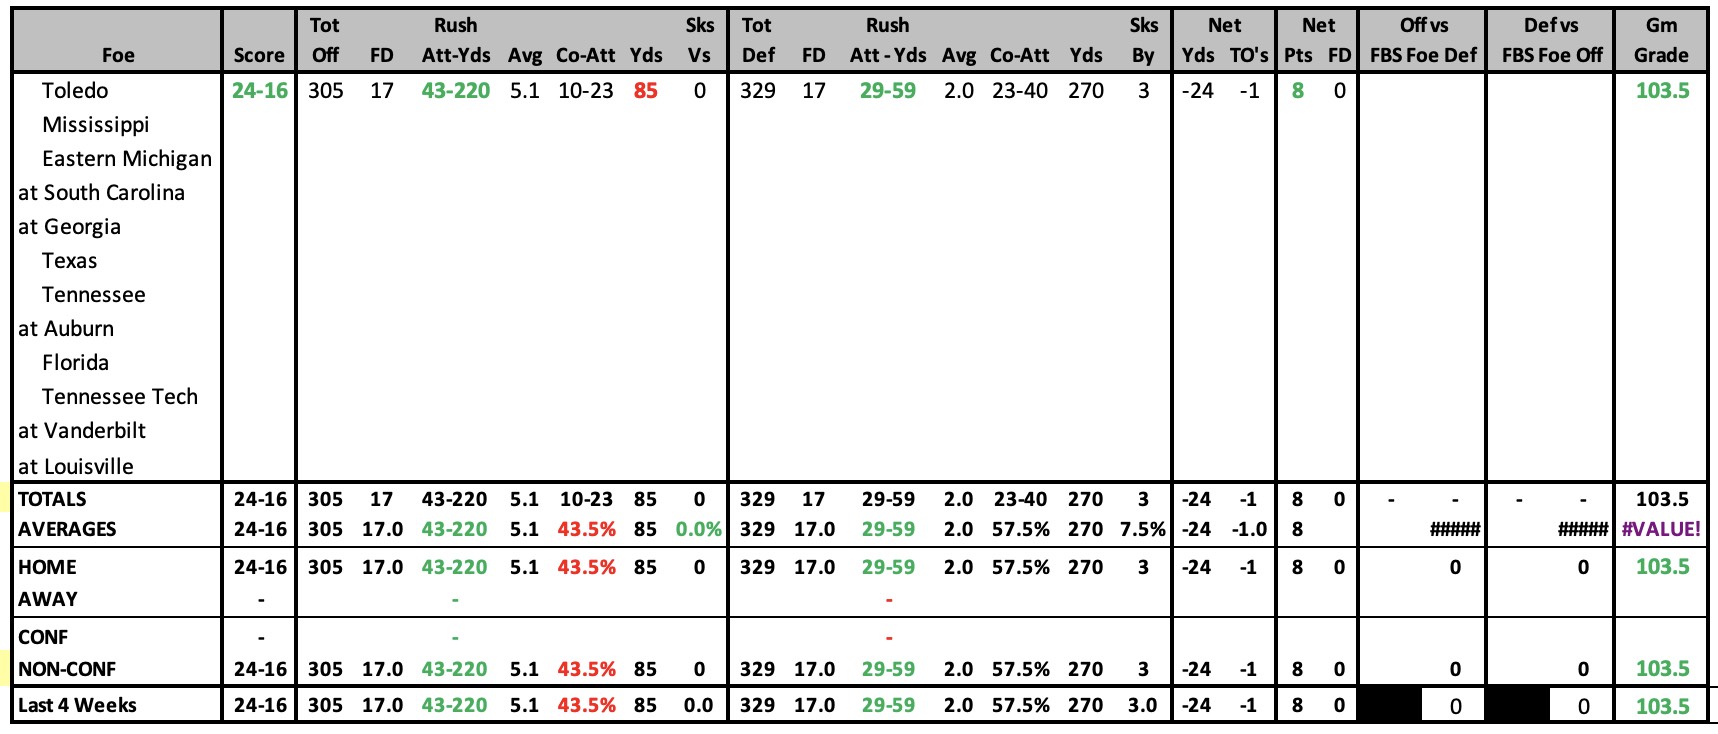
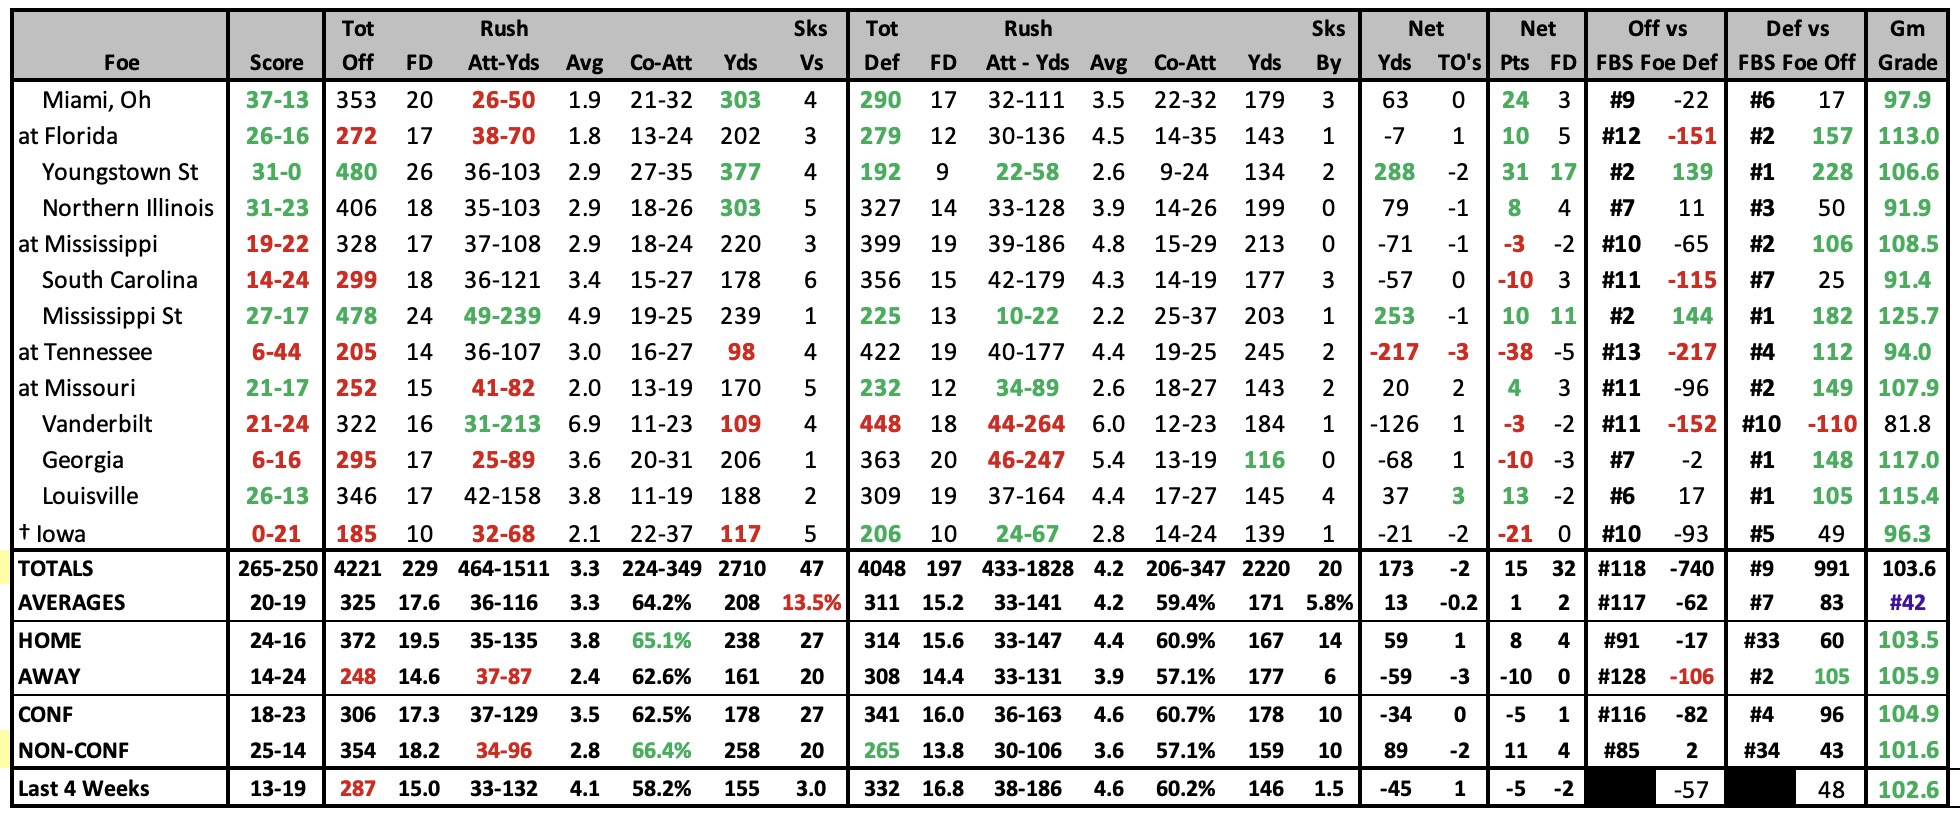
| 2025 GAME-BY-GAME STATS |
|---|
 |
2025 SCHEDULE |
2024 RESULTS |
||||||||||||||||||||||||||||||||||||||||||||||||||||||||||||||||||||||||||||||||||||||||||||||||||||||||||||||||||||||||||||||||||||||||||||||||||||||||||||||||||||||||||||||||||||||||||||||||
|
|
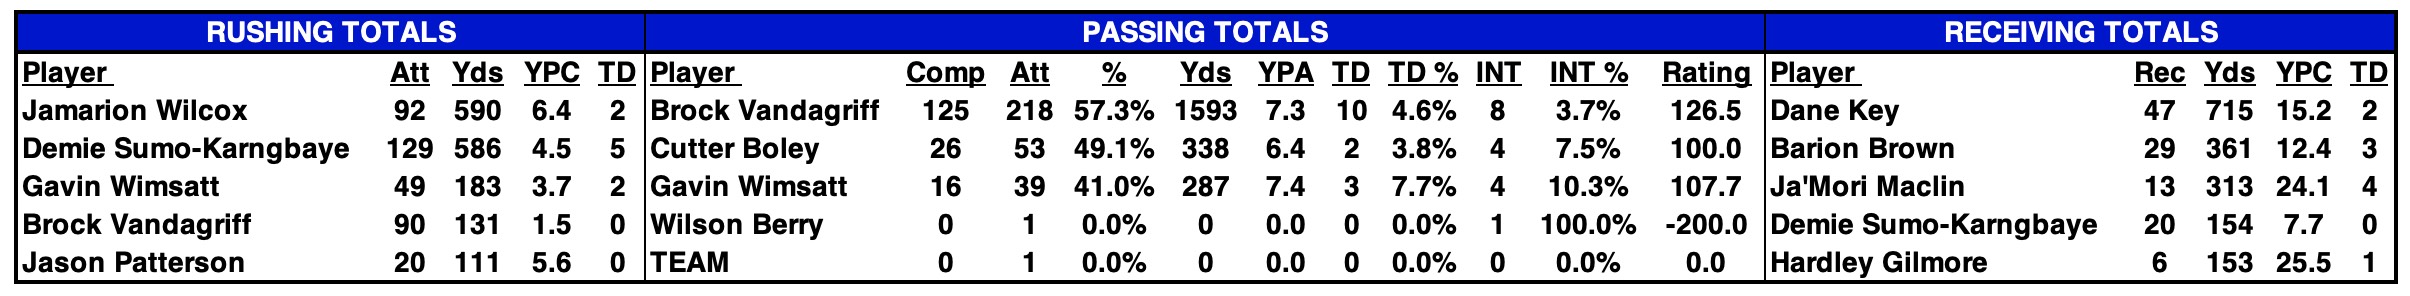
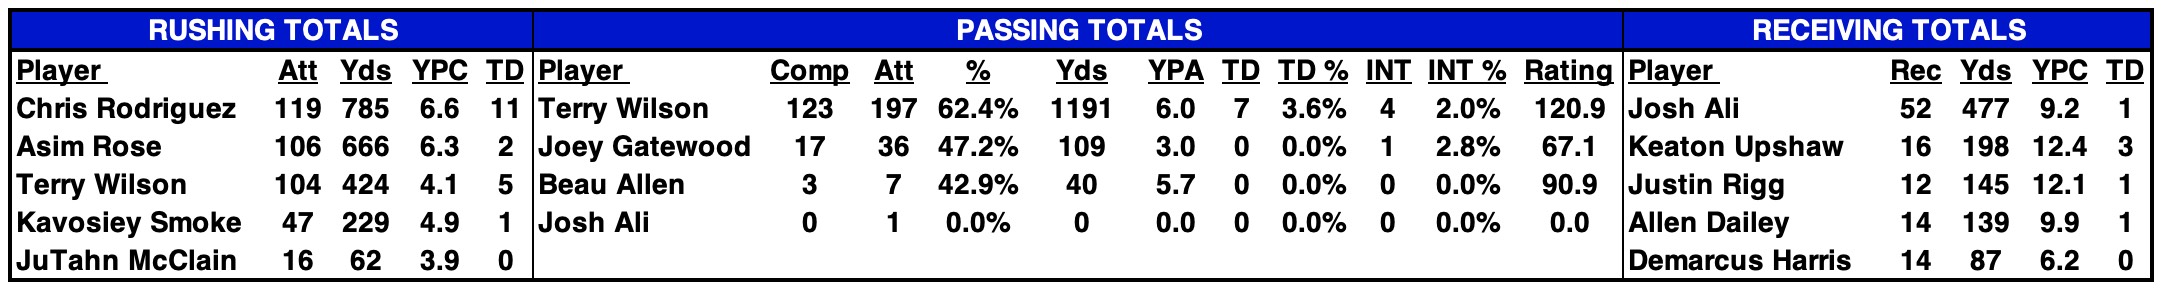
| 2024 STATISTICAL LEADERS |
|---|
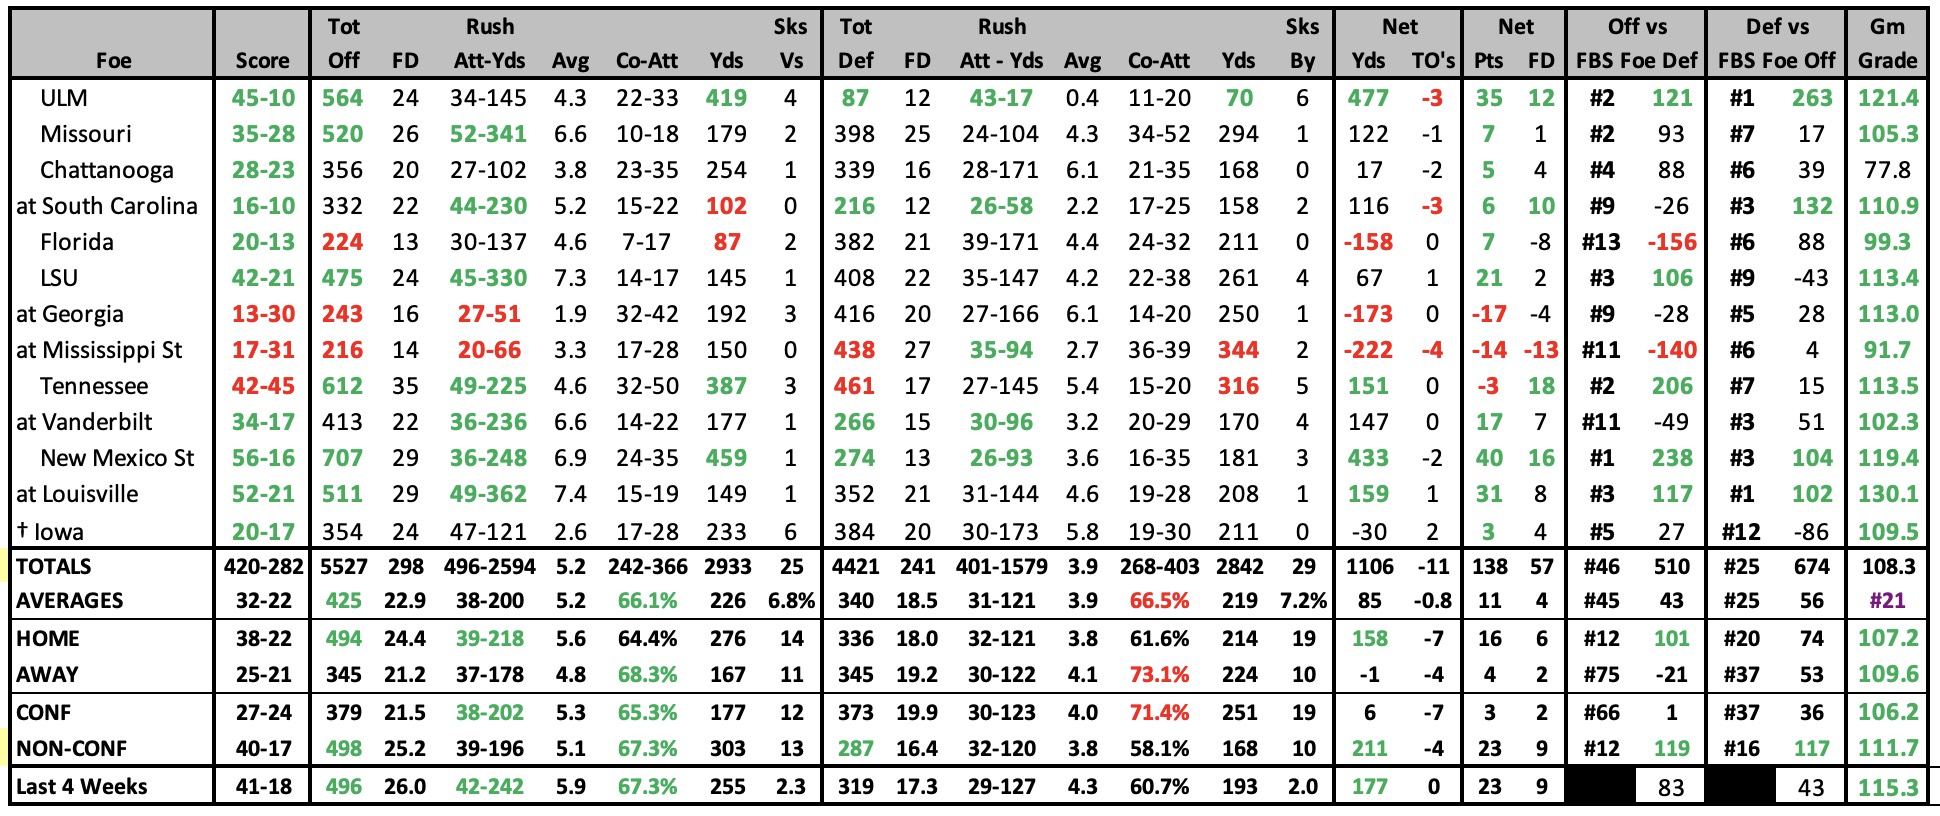
| 2024 GAME-BY-GAME STATS |
|---|
 |
2024 SCHEDULE |
2023 RESULTS |
||||||||||||||||||||||||||||||||||||||||||||||||||||||||||||||||||||||||||||||||||||||||||||||||||||||||||||||||||||||||||||||||||||||||||||||||||||||||||||||||||||||||||||||||||||||||||||||||
|
|
||||||||||||||||||||||||||||||||||||||||||||||||||||||||||||||||||||||||||||||||||||||||||||||||||||||||||||||||||||||||||||||||||||||||||||||||||||||||||||||||||||||||||||||||||||||||||||||||
| 2023 STATISTICAL LEADERS |
|---|
| 2023 GAME-BY-GAME STATS |
|---|
 |
2023 SCHEDULE |
2022 RESULTS |
||||||||||||||||||||||||||||||||||||||||||||||||||||||||||||||||||||||||||||||||||||||||||||||||||||||||||||||||||||||||||||||||||||||||||||||||||||||||||||||||||||||||||||||||||||||||||||||||||||||
|
|
||||||||||||||||||||||||||||||||||||||||||||||||||||||||||||||||||||||||||||||||||||||||||||||||||||||||||||||||||||||||||||||||||||||||||||||||||||||||||||||||||||||||||||||||||||||||||||||||||||||
| 2022 STATISTICAL LEADERS |
|---|
| 2022 GAME-BY-GAME STATS |
|---|
 |
2022 SCHEDULE |
2021 RESULTS |
||||||||||||||||||||||||||||||||||||||||||||||||||||||||||||||||||||||||||||||||||||||||||||||||||||||||||||||||||||||||||||||||||||||||||||||||||||||||||||||||||||||||||||||||||||||||||||||||||||||
|
|
||||||||||||||||||||||||||||||||||||||||||||||||||||||||||||||||||||||||||||||||||||||||||||||||||||||||||||||||||||||||||||||||||||||||||||||||||||||||||||||||||||||||||||||||||||||||||||||||||||||
| 2021 STATISTICAL LEADERS |
|---|
| 2021 GAME-BY-GAME STATS |
|---|
 |
2021 SCHEDULE |
2020 RESULTS |
||||||||||||||||||||||||||||||||||||||||||||||||||||||||||||||||||||||||||||||||||||||||||||||||||||||||||||||||||||||||||||||||||||||||||||||||||||||||||||||||||||||||||||||||||||||||||||||||
|
|
||||||||||||||||||||||||||||||||||||||||||||||||||||||||||||||||||||||||||||||||||||||||||||||||||||||||||||||||||||||||||||||||||||||||||||||||||||||||||||||||||||||||||||||||||||||||||||||||
| 2020 STATISTICAL LEADERS |
|---|
| 2020 GAME-BY-GAME STATS |
|---|
 |
2020 SCHEDULE |
2019 RESULTS |
||||||||||||||||||||||||||||||||||||||||||||||||||||||||||||||||||||||||||||||||||||||||||||||||||||||||||||||||||||||||||||||||||||||||||||||||||||||||||||||||||||||||||||||||||||||||||||||||||||||||||||
|
|
||||||||||||||||||||||||||||||||||||||||||||||||||||||||||||||||||||||||||||||||||||||||||||||||||||||||||||||||||||||||||||||||||||||||||||||||||||||||||||||||||||||||||||||||||||||||||||||||||||||||||||
| 2019 STATISTICAL LEADERS |
|---|
| 2019 GAME-BY-GAME STATS |
|---|
 |
2019 SCHEDULE |
2018 RESULTS |
||||||||||||||||||||||||||||||||||||||||||||||||||||||||||||||||||||||||||||||||||||||||||||||||||||||||||||||||||||||||||||||||||||||||||||||||||||||||||||||||||||||||||||||||||||||||||||||||||||||||||||||||||||||||||||
|
|
||||||||||||||||||||||||||||||||||||||||||||||||||||||||||||||||||||||||||||||||||||||||||||||||||||||||||||||||||||||||||||||||||||||||||||||||||||||||||||||||||||||||||||||||||||||||||||||||||||||||||||||||||||||||||||
| 2018 STATISTICAL LEADERS |
|---|
| 2018 GAME-BY-GAME STATS |
|---|
 |
2018 SCHEDULE |
2017 RESULTS |
|||||||||||||||||||||||||||||||||||||||||||||||||||||||||||||||||||||||||||||||||||||||||||||||||||||||||||||||||||||||||||||||||||||||||||||||||||||||||||||||||||||||||||||||||||||||||||||||||||||||||||||||||||||||||||||||||||||||
|
|
|||||||||||||||||||||||||||||||||||||||||||||||||||||||||||||||||||||||||||||||||||||||||||||||||||||||||||||||||||||||||||||||||||||||||||||||||||||||||||||||||||||||||||||||||||||||||||||||||||||||||||||||||||||||||||||||||||||||
| 2017 STATISTICAL LEADERS |
|---|
| 2017 GAME-BY-GAME STATS |
|---|
 |
2017 SCHEDULE |
2016 RESULTS |
||||||||||||||||||||||||||||||||||||||||||||||||||||||||||||||||||||||||||||||||||||||||||||||||||||||||||||||||||||||||||||||||||||||||||||||||||||||||||||||||||||||||||||||||||||||||||||||||||||||||||||||||||||||||||||||||||||||||||||||
|
|
||||||||||||||||||||||||||||||||||||||||||||||||||||||||||||||||||||||||||||||||||||||||||||||||||||||||||||||||||||||||||||||||||||||||||||||||||||||||||||||||||||||||||||||||||||||||||||||||||||||||||||||||||||||||||||||||||||||||||||||
| 2016 STATISTICAL LEADERS |
|---|
| 2016 GAME-BY-GAME STATS |
|---|
 |
| 2015 STATISTICAL LEADERS |
|---|
| 2015 GAME-BY-GAME STATS |
|---|
 |
2015 SCHEDULE |
2014 RESULTS |
||||||||||||||||||||||||||||||||||||||||||||||||||||||||||||||||||||||||||||||||||||||||||||||||||||||||||||||||||||||||||||||||||||||||||||||||||||||||||||||||||||||||||||||||||||||||||||||||||||||||||||||||||||||||||||||||||||||||||||||
|
|
||||||||||||||||||||||||||||||||||||||||||||||||||||||||||||||||||||||||||||||||||||||||||||||||||||||||||||||||||||||||||||||||||||||||||||||||||||||||||||||||||||||||||||||||||||||||||||||||||||||||||||||||||||||||||||||||||||||||||||||
| 2014 STATISTICAL LEADERS |
|---|
| 2014 GAME-BY-GAME STATS |
|---|
 |
| 2013 STATISTICAL LEADERS |
|---|
| Player | Att | Yds | YPC | TD | Player | Comp | Att | % | Yds | YPA | TD | INT | Rating | Player | Rec | Yds | YPC | TD |
| Jojo Kemp | 100 | 482 | 4.8 | 3 | Maxwell Smith | 105 | 183 | 57.4% | 1276 | 7.0 | 9 | 1 | 131.1 | Javess Blue | 43 | 586 | 13.6 | 4 |
| Raymond Sanders III | 107 | 464 | 4.3 | 3 | Jalen Whitlow | 98 | 159 | 61.6% | 1035 | 6.5 | 5 | 5 | 120.4 | Ryan Timmons | 32 | 338 | 10.6 | 2 |
| Jalen Whitlow | 107 | 457 | 4.3 | 6 | Demarco Robinson | 1 | 1 | 100.0% | 10 | 10.0 | 0 | 0 | 184.0 | Jeff Badet | 21 | 262 | 12.5 | 1 |
| 2013 GAME-BY-GAME STATS |
|---|
 |
2013 RESULTS |
2012 RESULTS |
||||||||||||||||||||||||||||||||||||||||||||||||||||||||||||||||||||||||||||||||||||||||||||||||||||||||||||||||||||||||||||||||||||||||||||||||||||||||||||||||||||||||||||||||||||||||||||||||||||||||||||||||||||||||||||||||||||||||||||||||||||||||||||||
|
|
||||||||||||||||||||||||||||||||||||||||||||||||||||||||||||||||||||||||||||||||||||||||||||||||||||||||||||||||||||||||||||||||||||||||||||||||||||||||||||||||||||||||||||||||||||||||||||||||||||||||||||||||||||||||||||||||||||||||||||||||||||||||||||||
| 2012 STATISTICAL LEADERS |
|---|
| Player | Att | Yds | YPC | TD | Player | Comp | Att | % | Yds | YPA | TD | INT | Rating | Player | Rec | Yds | YPC | TD | ||
| Raymond Sanders | 125 | 669 | 5.4 | 5 | Maxwell Smith | 103 | 150 | 68.7% | 975 | 6.5 | 8 | 4 | 135.5 | La'Rod King | 48 | 488 | 10.2 | 4 | ||
| Jonathan George | 108 | 505 | 4.7 | 4 | Jalen Whitlow | 87 | 161 | 54.0% | 800 | 5.0 | 3 | 2 | 99.4 | Demarco Robinson | 26 | 279 | 10.7 | 0 | ||
| Jalen Whitlow | 68 | 206 | 3.0 | 3 | Patrick Towles | 19 | 40 | 47.5% | 233 | 5.8 | 1 | 1 | 99.7 | Aaron Boyd | 24 | 233 | 9.7 | 2 |
| 2012 Individual Player Stats • 2012 Start Chart/Starters Lost |
|---|
| 2012 GAME-BY-GAME STATS |
|---|
 |
| 2011 STATISTICAL LEADERS |
|---|
| Player | Att | Yds | YPC | TD | Player | Comp | Att | % | Yds | YPA | TD | INT | Rating | Player | Rec | Yds | YPC | TD | ||
| CoShik Williams | 118 | 486 | 4.1 | 3 | Maxwell Smith | 84 | 154 | 54.5% | 819 | 5.3 | 4 | 4 | 102.6 | La'Rod King | 40 | 598 | 15.0 | 7 | ||
| Josh Clemons | 65 | 279 | 4.3 | 2 | Morgan Newton | 83 | 173 | 48.0% | 793 | 4.6 | 8 | 7 | 93.6 | Matt Roark | 36 | 349 | 9.7 | 1 | ||
| Morgan Newton | 78 | 272 | 3.5 | 2 | Matt Roark | 4 | 7 | 57.1% | 15 | 2.1 | 0 | 0 | 75.1 | Nick Melillo | 17 | 186 | 10.9 | 1 |
| 2011 Individual Player Stats • 2011 START CHART/STARTERS LOST |
|---|
| 2011 GAME-BY-GAME STATS |
|---|
2011 RESULTS |
2010 RESULTS |
|||||||||||||||||||||||||||||||||||||||||||||||||||||||||||||||||||||||||||||||||||||||||||||||||||||||||||||||||||||||||||||||||||||||||||||||||||||||||||||||||||||||||||||||||||||||||||||||||||
|
|
|||||||||||||||||||||||||||||||||||||||||||||||||||||||||||||||||||||||||||||||||||||||||||||||||||||||||||||||||||||||||||||||||||||||||||||||||||||||||||||||||||||||||||||||||||||||||||||||||||
| 2010 STATISTICAL LEADERS |
|---|
| Player | Att | Yds | YPC | TD | Player | Comp | Att | % | Yds | YPA | TD | INT | Rating | Player | Rec | Yds | YPC | TD | ||
| Derrick Locke | 166 | 887 | 5.3 | 10 | Mike Hartline | 268 | 405 | 66.2% | 3178 | 7.8 | 23 | 9 | 146.4 | Randall Cobb | 84 | 1017 | 12.1 | 7 | ||
| Randall Cobb | 55 | 424 | 7.7 | 5 | Morgan Newton | 25 | 43 | 58.1% | 265 | 6.2 | 0 | 0 | 109.9 | Chris Matthews | 61 | 925 | 15.2 | 9 | ||
| Donald Russell | 64 | 293 | 4.6 | 2 | Randall Cobb | 5 | 10 | 50.0% | 58 | 5.8 | 3 | 0 | 197.7 | La'Rod King | 36 | 478 | 13.3 | 5 |
| 2010 Individual Player Stats |
|---|
| 2010 GAME-BY-GAME STATS |
|---|
| 2009 STATISTICAL LEADERS |
|---|
| Player | Att | Yds | YPC | TD | Player | Comp | Att | % | Yds | YPA | TD | INT | Rating | Player | Rec | Yds | YPC | TD | ||
| Derrick Locke | 166 | 821 | 4.9 | 5 | Mike Hartline | 79 | 133 | 59.4% | 802 | 6.0 | 6 | 7 | 114.4 | Randall Cobb | 33 | 403 | 12.2 | 4 | ||
| Randall Cobb | 66 | 436 | 6.6 | 9 | M Newton | 52 | 90 | 57.8% | 539 | 6.0 | 5 | 3 | 119.8 | Chris Matthews | 29 | 299 | 10.3 | 2 | ||
| Alfonso Smith | 60 | 245 | 4.1 | 2 | Will Fidler | 20 | 41 | 48.8% | 186 | 4.5 | 1 | 1 | 90.1 | Derrick Locke | 22 | 221 | 10.0 | 2 |
| 2009 Individual Player Stats |
|---|
| 2009 GAME-BY-GAME STATS |
|---|
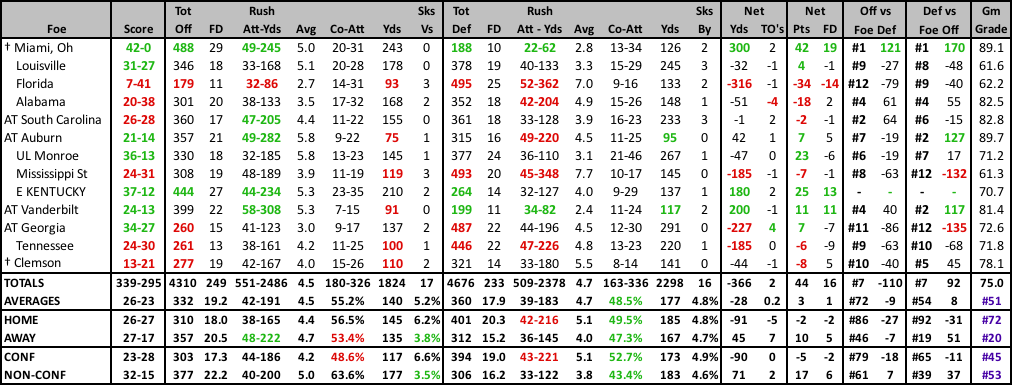
2009 RESULTS |
| KENTUCKY 2009 | score | Box | ||
|---|---|---|---|---|
9/5 |
† | Miami OH | 42-0 | |
9/12 |
|
|||
9/19 |
31-27 | |||
9/26 |
7-41 | |||
10/3 |
20-38 | |||
10/10 |
at |
26-28 | ||
10/17 |
at |
21-14 | ||
10/24 |
13-36 | |||
10/31 |
24-31 | |||
11/7 |
37-12 | |||
11/14 |
at |
24-13 | ||
11/21 |
at |
34-27 | ||
11/28 |
24-30 | |||
| 12/27 | Music City Bowl | 13-21 | Box | |