| TENNESSEE VOLUNTEERS |
|---|
|
STADIUM: Neyland Stadium |
 |
|
TENNESSEE QUICK FACTS: |
|
| LOCATION: Knoxville, Tenn | |
| FOUNDED: 1794 | |
| ENROLLMENT: 22,815 | |
| COLORS: Orange & White | |
| MASCOT: Smokey | |
| CONFERENCE: SEC | |
| HEAD COACH: Josh Heupel | |
YEARS WITH TEAM: 5th |
|
| OVERALL RECORD: 65-23 | |
| RECORD WITH TM: 37-15 | |
| 2025 Individual Player Stats |
2025 Start Chart |
Last 40+ Years Results |
Last 20 Years - Leaders |
Draft History |
|---|
| 2025 STATISTICAL LEADERS |
|---|

| 2025 GAME BY GAME STATS |
|---|
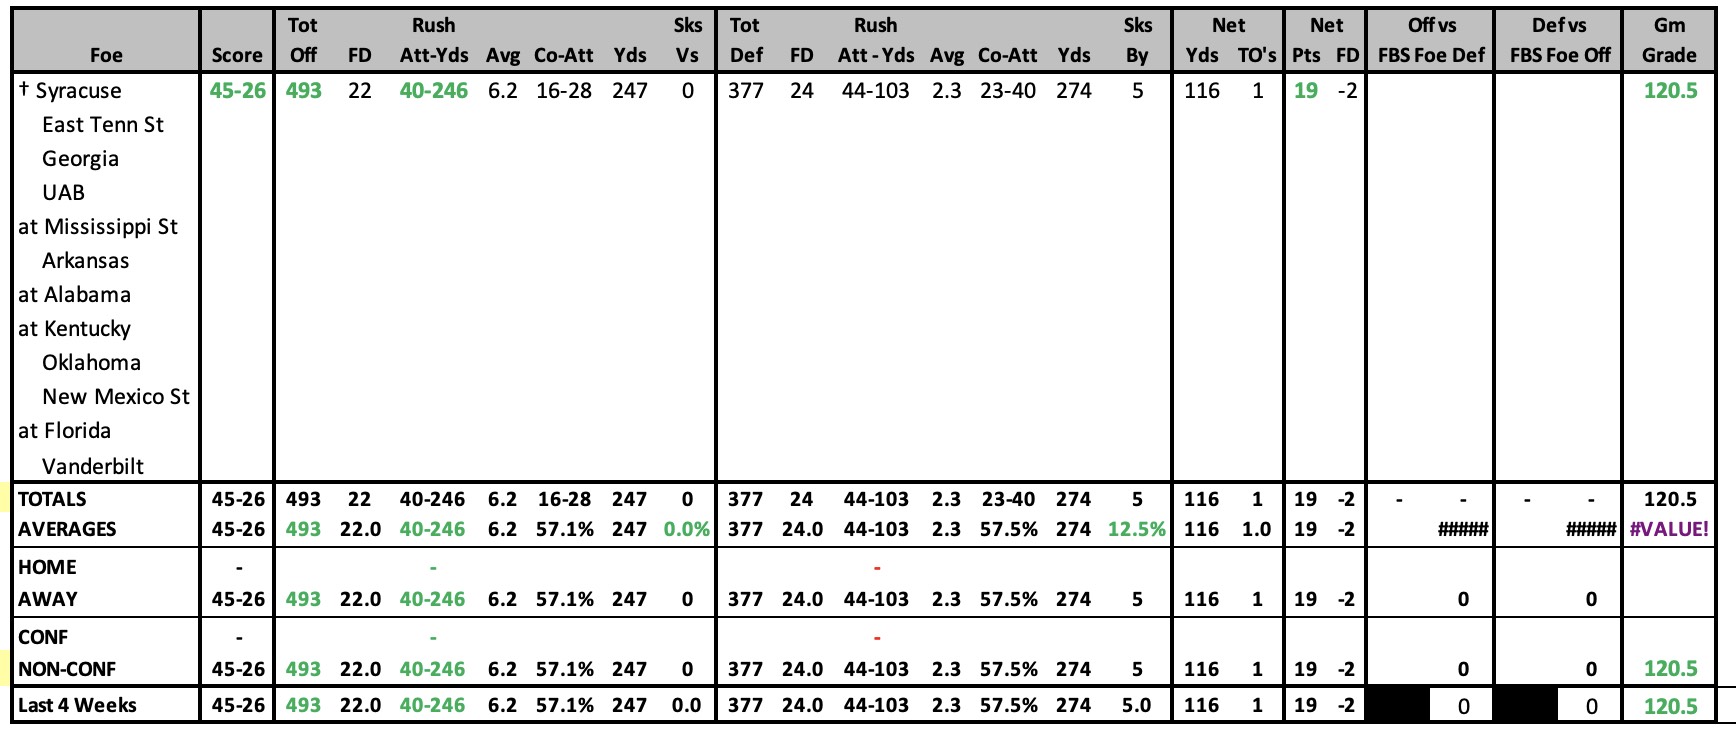 |
2025 SCHEDULE |
2024 RESULTS |
||||||||||||||||||||||||||||||||||||||||||||||||||||||||||||||||||||||||||||||||||||||||||||||||||||||||||||||||||||||||||||||||||||||||||||||||||||||||||||||||||||||||||||||||||||||||||||||||||||||||||||
|
|
||||||||||||||||||||||||||||||||||||||||||||||||||||||||||||||||||||||||||||||||||||||||||||||||||||||||||||||||||||||||||||||||||||||||||||||||||||||||||||||||||||||||||||||||||||||||||||||||||||||||||||
| 2024 STATISTICAL LEADERS |
|---|

| 2024 Individual Player Stats |
2024 Start Chart |
|---|
| 2024 GAME BY GAME STATS |
|---|
 |
2024 SCHEDULE |
2023 RESULTS |
||||||||||||||||||||||||||||||||||||||||||||||||||||||||||||||||||||||||||||||||||||||||||||||||||||||||||||||||||||||||||||||||||||||||||||||||||||||||||||||||||||||||||||||||||||||||||||||||||||||||||||
|
|
||||||||||||||||||||||||||||||||||||||||||||||||||||||||||||||||||||||||||||||||||||||||||||||||||||||||||||||||||||||||||||||||||||||||||||||||||||||||||||||||||||||||||||||||||||||||||||||||||||||||||||
| 2023 STATISTICAL LEADERS |
|---|

| 2023 Individual Player Stats |
2023 Start Chart |
|---|
| 2023 GAME BY GAME STATS |
|---|
 |
2023 SCHEDULE |
2022 RESULTS |
||||||||||||||||||||||||||||||||||||||||||||||||||||||||||||||||||||||||||||||||||||||||||||||||||||||||||||||||||||||||||||||||||||||||||||||||||||||||||||||||||||||||||||||||||||||||||||||||||||||
|
|
||||||||||||||||||||||||||||||||||||||||||||||||||||||||||||||||||||||||||||||||||||||||||||||||||||||||||||||||||||||||||||||||||||||||||||||||||||||||||||||||||||||||||||||||||||||||||||||||||||||
| 2022 STATISTICAL LEADERS |
|---|

| 2022 Individual Player Stats |
2022 Start Chart |
|---|
| 2022 GAME BY GAME STATS |
|---|
 |
2022 SCHEDULE |
2021 RESULTS |
||||||||||||||||||||||||||||||||||||||||||||||||||||||||||||||||||||||||||||||||||||||||||||||||||||||||||||||||||||||||||||||||||||||||||||||||||||||||||||||||||||||||||||||||||||||||||||||||||||||
|
|
||||||||||||||||||||||||||||||||||||||||||||||||||||||||||||||||||||||||||||||||||||||||||||||||||||||||||||||||||||||||||||||||||||||||||||||||||||||||||||||||||||||||||||||||||||||||||||||||||||||
| 2021 STATISTICAL LEADERS |
|---|

| 2021 Individual Player Stats |
2021 Start Chart |
|---|
| 2021 GAME BY GAME STATS |
|---|
 |
2021 SCHEDULE |
2020 RESULTS |
||||||||||||||||||||||||||||||||||||||||||||||||||||||||||||||||||||||||||||||||||||||||||||||||||||||||||||||||||||||||||||||||||||||||||||||||||||||||||||||||||||||||||||||||||||||||||||||||
|
|
||||||||||||||||||||||||||||||||||||||||||||||||||||||||||||||||||||||||||||||||||||||||||||||||||||||||||||||||||||||||||||||||||||||||||||||||||||||||||||||||||||||||||||||||||||||||||||||||
| 2020 STATISTICAL LEADERS |
|---|

| 2020 Individual Player Stats |
2020 Start Chart |
|---|
| 2020 GAME BY GAME STATS |
|---|
 |
2020 SCHEDULE |
2019 RESULTS |
||||||||||||||||||||||||||||||||||||||||||||||||||||||||||||||||||||||||||||||||||||||||||||||||||||||||||||||||||||||||||||||||||||||||||||||||||||||||||||||||||||||||||||||||||||||||||||||||||||||||||||
|
|
||||||||||||||||||||||||||||||||||||||||||||||||||||||||||||||||||||||||||||||||||||||||||||||||||||||||||||||||||||||||||||||||||||||||||||||||||||||||||||||||||||||||||||||||||||||||||||||||||||||||||||
| 2019 STATISTICAL LEADERS |
|---|

| 2019 Individual Player Stats |
2019 Start Chart |
|---|
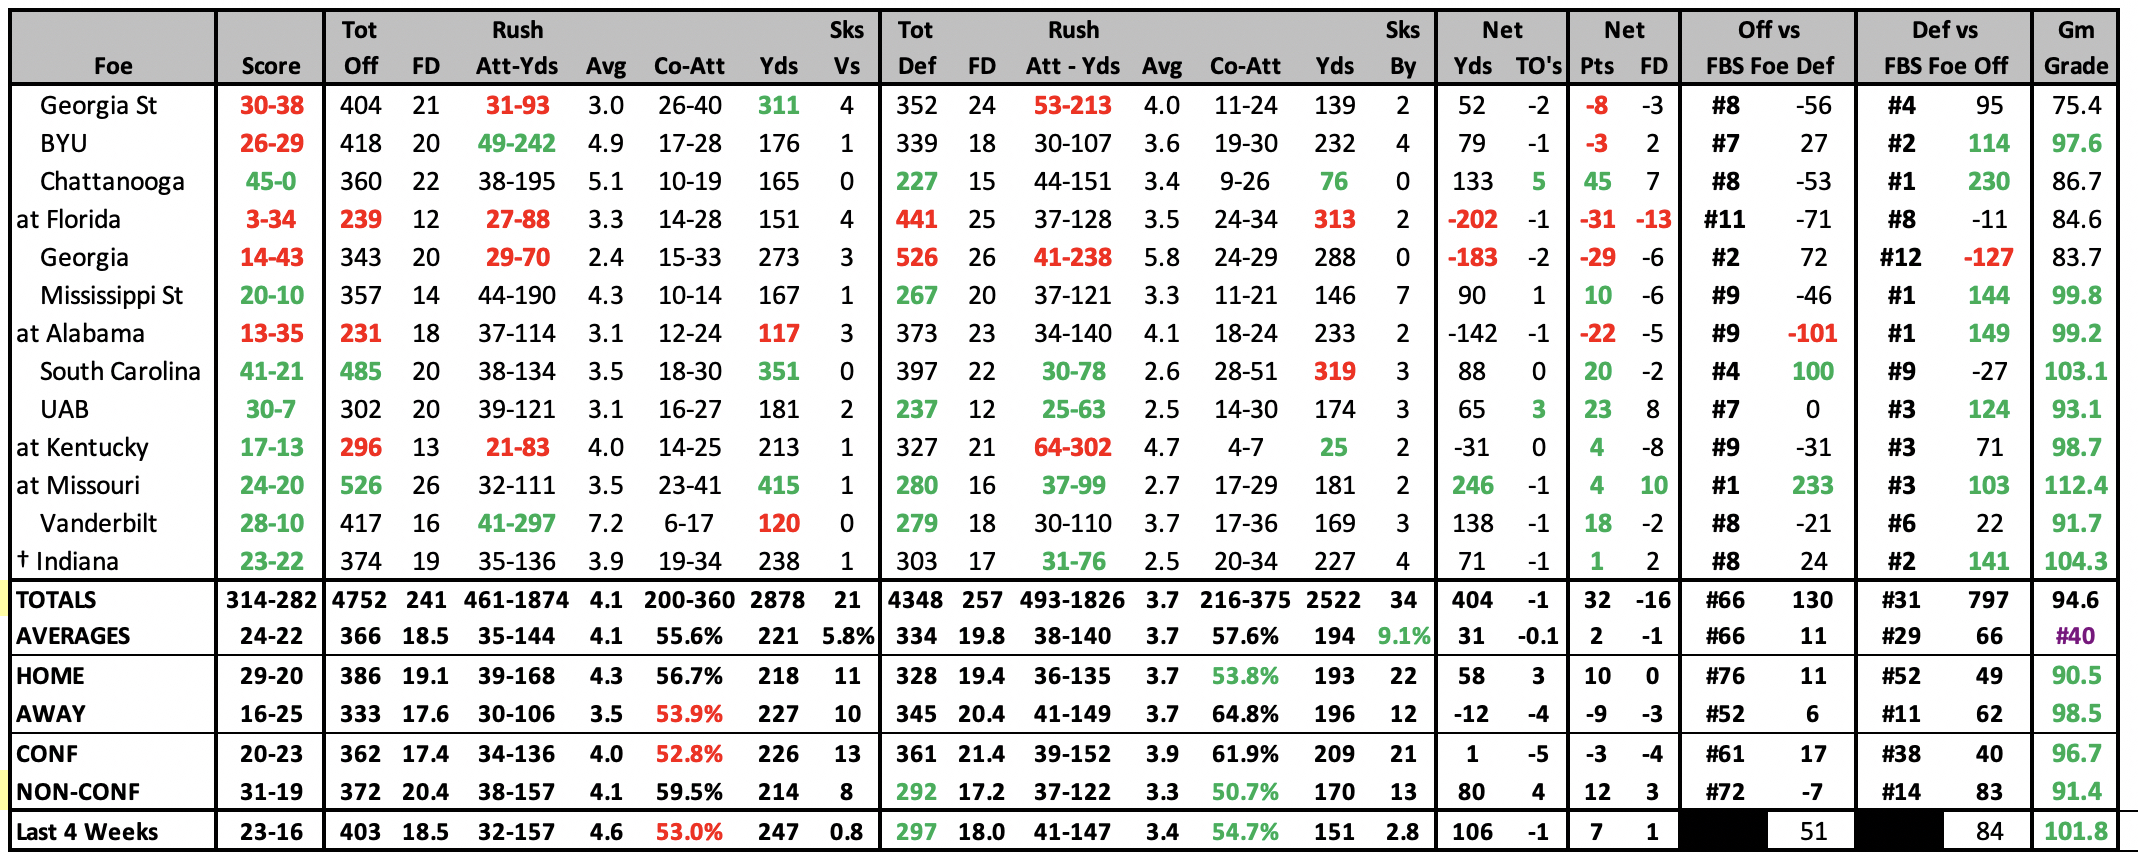
| 2019 GAME BY GAME STATS |
|---|
 |
2019 SCHEDULE |
2018 RESULTS |
|||||||||||||||||||||||||||||||||||||||||||||||||||||||||||||||||||||||||||||||||||||||||||||||||||||||||||||||||||||||||||||||||||||||||||||||||||||||||||||||||||||||||||||||||||||||||||||||||||||||||||||||||||||
|
|
|||||||||||||||||||||||||||||||||||||||||||||||||||||||||||||||||||||||||||||||||||||||||||||||||||||||||||||||||||||||||||||||||||||||||||||||||||||||||||||||||||||||||||||||||||||||||||||||||||||||||||||||||||||
| 2018 STATISTICAL LEADERS |
|---|

| 2018 Individual Player Stats |
2018 Start Chart |
|---|
| 2018 GAME BY GAME STATS |
|---|
 |
2018 SCHEDULE |
2017 RESULTS |
||||||||||||||||||||||||||||||||||||||||||||||||||||||||||||||||||||||||||||||||||||||||||||||||||||||||||||||||||||||||||||||||||||||||||||||||||||||||||||||||||||||||||||||||||||||||||||||||||||||||||||||||||
|
|
||||||||||||||||||||||||||||||||||||||||||||||||||||||||||||||||||||||||||||||||||||||||||||||||||||||||||||||||||||||||||||||||||||||||||||||||||||||||||||||||||||||||||||||||||||||||||||||||||||||||||||||||||
| 2017 STATISTICAL LEADERS |
|---|

| 2017 Individual Player Stats |
2017 Start Chart |
|---|
| 2017 GAME BY GAME STATS |
|---|
 |
2017 SCHEDULE |
2016 RESULTS |
||||||||||||||||||||||||||||||||||||||||||||||||||||||||||||||||||||||||||||||||||||||||||||||||||||||||||||||||||||||||||||||||||||||||||||||||||||||||||||||||||||||||||||||||||||||||||||||||||||||||||||||||||||||||||||||||
|
|
||||||||||||||||||||||||||||||||||||||||||||||||||||||||||||||||||||||||||||||||||||||||||||||||||||||||||||||||||||||||||||||||||||||||||||||||||||||||||||||||||||||||||||||||||||||||||||||||||||||||||||||||||||||||||||||||
| 2016 STATISTICAL LEADERS |
|---|

| 2016 Individual Player Stats |
2016 Start Chart |
|---|
| 2016 GAME BY GAME STATS |
|---|
 |
| 2015 STATISTICAL LEADERS |
|---|

| 2015 Individual Player Stats |
2015 Start Chart |
|---|
| 2015 GAME BY GAME STATS |
|---|
 |
2015 SCHEDULE |
2014 RESULTS |
||||||||||||||||||||||||||||||||||||||||||||||||||||||||||||||||||||||||||||||||||||||||||||||||||||||||||||||||||||||||||||||||||||||||||||||||||||||||||||||||||||||||||||||||||||||||||||||||||||||||||||||||||||||||||||||||||||||||||||||
|
|
||||||||||||||||||||||||||||||||||||||||||||||||||||||||||||||||||||||||||||||||||||||||||||||||||||||||||||||||||||||||||||||||||||||||||||||||||||||||||||||||||||||||||||||||||||||||||||||||||||||||||||||||||||||||||||||||||||||||||||||
| 2014 STATISTICAL LEADERS |
|---|

| 2014 Individual Player Stats |
2014 Start Chart |
|---|
| 2014 GAME BY GAME STATS |
|---|
 |
| 2013 STATISTICAL LEADERS |
|---|
| Player | Att | Yds | YPC | TD | Player | Comp | Att | % | Yds | YPA | TD | INT | Rating | Player | Rec | Yds | YPC | TD |
| Rajion Neal | 215 | 1024 | 4.8 | 12 | Justin Worley | 109 | 196 | 55.6% | 1239 | 6.3 | 10 | 8 | 117.4 | Marquez North | 38 | 496 | 13.1 | 1 |
| Marlin Lane Jr | 101 | 534 | 5.3 | 4 | Joshua Dobbs | 72 | 121 | 59.5% | 695 | 5.7 | 2 | 6 | 103.3 | Alton Howard | 44 | 388 | 8.8 | 3 |
| Joshua Dobbs | 38 | 189 | 5.0 | 1 | Nathan Peterman | 10 | 23 | 43.5% | 45 | 2.0 | 0 | 2 | 42.5 | Jason Croom | 18 | 269 | 14.9 | 2 |
| 2013 Individual Player Stats |
2013 Start Chart/ Starters Lost |
|---|
| 2013 GAME BY GAME STATS |
|---|
 |
2013 RESULTS |
2012 RESULTS |
|||||||||||||||||||||||||||||||||||||||||||||||||||||||||||||||||||||||||||||||||||||||||||||||||||||||||||||||||||||||||||||||||||||||||||||||||||||||||||||||||||||||||||||||||||||||||||||||||||||||||||||||||||||||||||||||||||||||||||||||||||||||
|
|
|||||||||||||||||||||||||||||||||||||||||||||||||||||||||||||||||||||||||||||||||||||||||||||||||||||||||||||||||||||||||||||||||||||||||||||||||||||||||||||||||||||||||||||||||||||||||||||||||||||||||||||||||||||||||||||||||||||||||||||||||||||||
| 2012 STATISTICAL LEADERS |
|---|
| Player | Att | Yds | YPC | TD | Player | Comp | Att | % | Yds | YPA | TD | INT | Rating | Player | Rec | Yds | YPC | TD | ||
| Rajion Neal | 156 | 708 | 4.5 | 5 | Tyler Bray | 267 | 450 | 59.3% | 3610 | 8.0 | 34 | 12 | 146.3 | Justin Hunter | 73 | 1084 | 14.8 | 9 | ||
| Marlin Lane | 120 | 659 | 5.5 | 2 | Justin Worley | 15 | 23 | 65.2% | 134 | 5.8 | 0 | 2 | 96.8 | Cordarrelle Patterson | 45 | 774 | 17.2 | 5 | ||
| C Patterson | 26 | 313 | 12.0 | 3 | Cordarrelle Patterson | 1 | 1 | 100.0% | 28 | 28.0 | 0 | 0 | 335.2 | Mychal Rivera | 36 | 562 | 15.6 | 5 |
| 2012 Individual Player Stats • 2012 Start Chart/Starters Lost |
|---|
| 2012 GAME BY GAME STATS |
|---|
 |
| 2011 STATISTICAL LEADERS |
|---|
| Player | Att | Yds | YPC | TD | Player | Comp | Att | % | Yds | YPA | TD | INT | Rating | Player | Rec | Yds | YPC | TD | ||
| Tauren Poole | 187 | 693 | 3.7 | 5 | Tyler Bray | 147 | 247 | 59.5% | 1983 | 8.0 | 17 | 6 | 144.8 | Da'Rick Rodgers | 67 | 1040 | 15.5 | 9 | ||
| Marlin Lane | 75 | 280 | 3.7 | 2 | Justin Worley | 48 | 87 | 55.2% | 604 | 6.9 | 1 | 3 | 110.4 | Mychal Rivera | 29 | 344 | 11.9 | 1 | ||
| Rajion Neal | 27 | 134 | 5.0 | 2 | Matt Simms | 27 | 62 | 43.5% | 319 | 5.1 | 0 | 3 | 77.1 | Justin Hunter | 17 | 314 | 18.5 | 2 |
| 2011 Individual Player Stats • 2011 START CHART/STARTERS LOST |
|---|
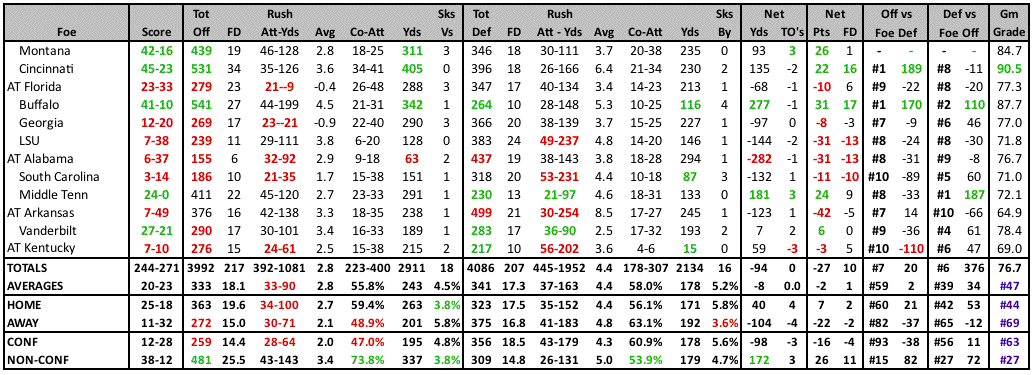
| 2011 GAME BY GAME STATS |
|---|
2011 RESULTS |
2010 RESULTS |
|||||||||||||||||||||||||||||||||||||||||||||||||||||||||||||||||||||||||||||||||||||||||||||||||||||||||||||||||||||||||||||||||||||||||||||||||||||||||||||||||||||||||||||||||||||||||||||||||||
|
|
|||||||||||||||||||||||||||||||||||||||||||||||||||||||||||||||||||||||||||||||||||||||||||||||||||||||||||||||||||||||||||||||||||||||||||||||||||||||||||||||||||||||||||||||||||||||||||||||||||
| 2010 STATISTICAL LEADERS |
|---|
| Player | Att | Yds | YPC | TD | Player | Comp | Att | % | Yds | YPA | TD | INT | Rating | Player | Rec | Yds | YPC | TD | ||
| Tauren Poole | 204 | 1034 | 5.1 | 11 | Tyler Bray | 125 | 224 | 55.8% | 1849 | 8.3 | 18 | 10 | 142.7 | Denarius Moore | 47 | 981 | 20.9 | 9 | ||
| Rajion Neal | 46 | 197 | 4.3 | 0 | Matt Simms | 113 | 195 | 57.9% | 1460 | 7.5 | 8 | 5 | 129.3 | Gerald Jones | 55 | 596 | 10.8 | 4 | ||
| David Oku | 42 | 174 | 4.1 | 1 | Luke Stocker | 39 | 417 | 10.7 | 2 |
| 2010 Individual Player Stats |
|---|
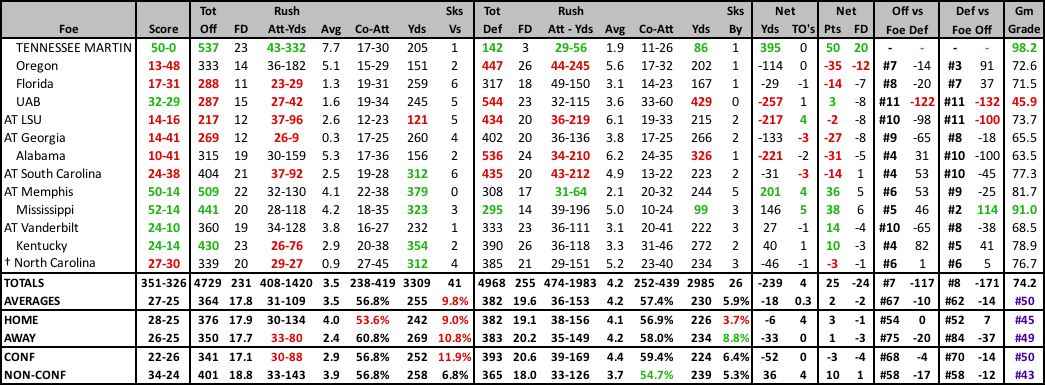
| 2010 GAME BY GAME STATS |
|---|
| 2009 STATISTICAL LEADERS |
|---|
| Player | Att | Yds | YPC | TD | Player | Comp | Att | % | Yds | YPA | TD | INT | Rating | Player | Rec | Yds | YPC | TD | ||
| Montario Hardesty | 225 | 1127 | 5.0 | 9 | Jonathan Crompton | 196 | 335 | 58.5% | 2345 | 7.0 | 25 | 11 | 135.4 | Gerald Jones | 36 | 497 | 13.8 | 4 | ||
| Bryce Brown | 98 | 452 | 4.6 | 3 | Nick Stephens | 9 | 13 | 69.2% | 142 | 10.9 | 1 | 1 | 171.0 | Denarius Moore | 35 | 455 | 13.0 | 6 | ||
| David Oku | 23 | 94 | 4.1 | 2 | Team | 0 | 2 | 0.0% | 0 | 0.0 | 0 | 0 | 0.0 | Quintin Hancock | 27 | 298 | 11.0 | 2 |
| 2009 Individual Player Stats |
|---|
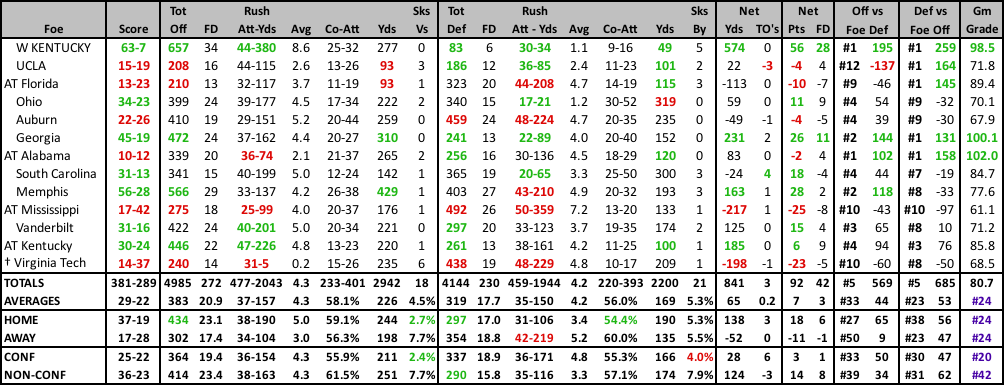
| 2009 GAME BY GAME STATS |
|---|
2009 RESULTS |
2008 RESULTS |
|||||||||||||||||||||||||||||||||||||||||||||||||||||||||||||||||||||||||||||||||||||||||||||||||||||||||||||||||||||||||||||||||||||||||||||||||
|
|
|||||||||||||||||||||||||||||||||||||||||||||||||||||||||||||||||||||||||||||||||||||||||||||||||||||||||||||||||||||||||||||||||||||||||||||||||
| 2008 Individual Player Stats • 2007 Individual Player Stats |
|---|

