TEXAS A&M AGGIES |
|
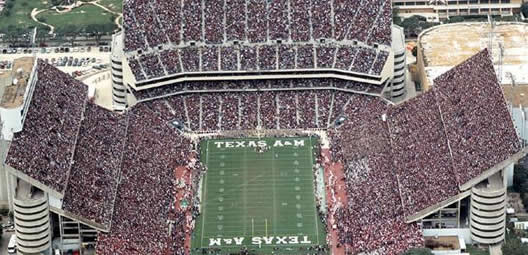
STADIUM: Kyle Field PLAYING SURFACE: Grass • CAPACITY: 102,733 STARTERS RETURNING (O/D): 8*/7 LETTERMAN RETURNING: 41 (17,20,4) • LETTERMAN LOST: 37 (20,15,2) |
 |
|
| LOCATION: College Station, TX | |
| FOUNDED: 1871 | |
| ENROLLMENT: 53,876 | |
| COLORS: Maroon & White | |
| MASCOT: Reveille VII, American Collie |
|
| CONFERENCE: SEC | |
| HEAD COACH: Mike Elko | |
| YEARS WITH TM: 2nd | |
| OVERALL RECORD: 24-14 | |
| RECORD WITH TM: 8-5 |
2025 STATISTICAL LEADERS |

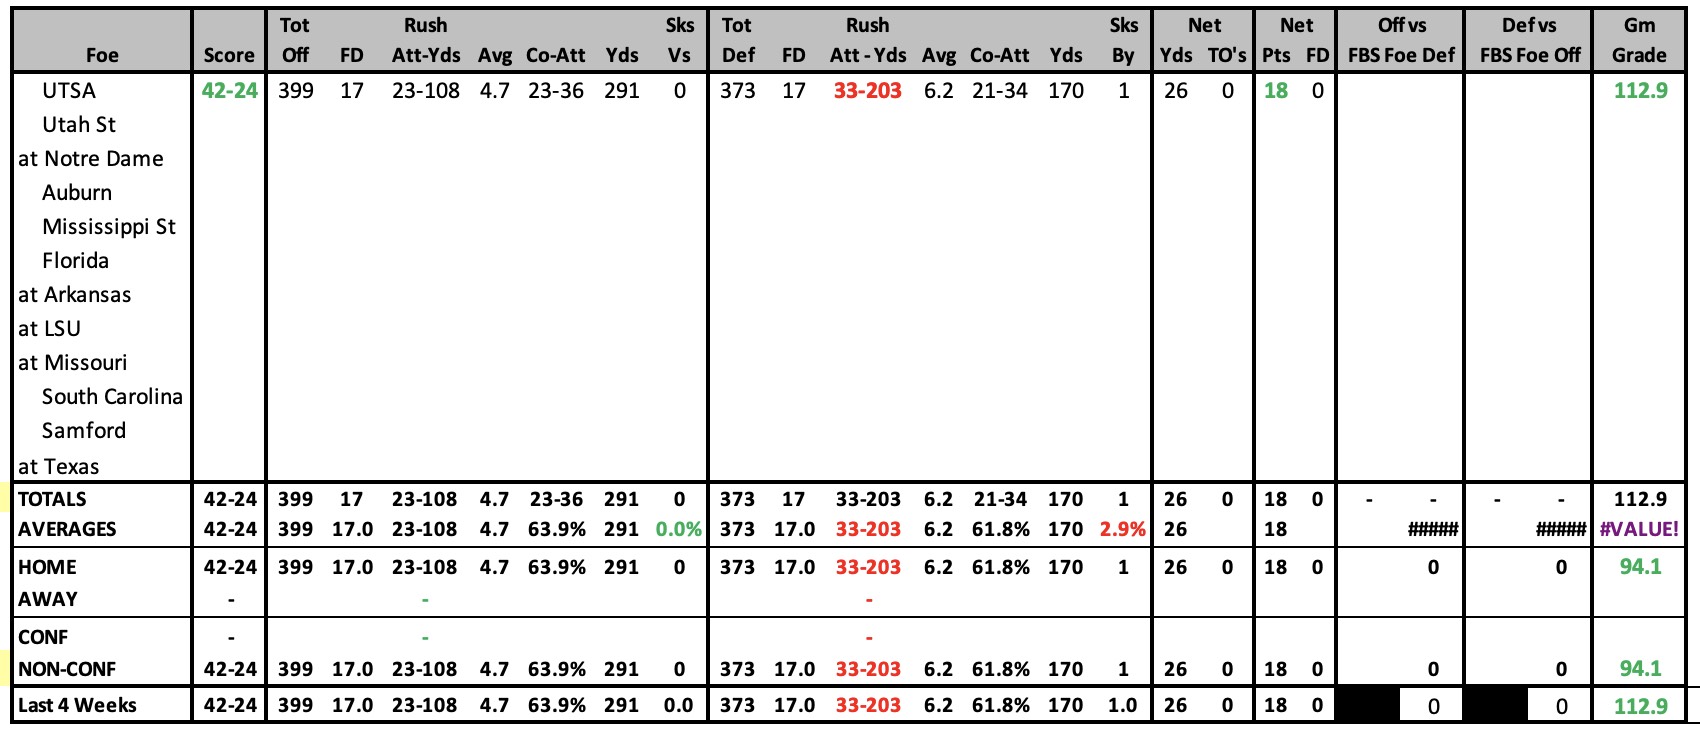
2025 GAME BY GAME STATS |
 |
2025 SCHEDULE |
2024 RESULTS |
||||||||||||||||||||||||||||||||||||||||||||||||||||||||||||||||||||||||||||||||||||||||||||||||||||||||||||||||||||||||||||||||||||||||||||||||||||||||||||||||||||||||||||||||||||||||||||||||||||||||||||
|
|
||||||||||||||||||||||||||||||||||||||||||||||||||||||||||||||||||||||||||||||||||||||||||||||||||||||||||||||||||||||||||||||||||||||||||||||||||||||||||||||||||||||||||||||||||||||||||||||||||||||||||||
2024 STATISTICAL LEADERS |

2024 GAME BY GAME STATS |
 |
2024 SCHEDULE |
2023 RESULTS |
||||||||||||||||||||||||||||||||||||||||||||||||||||||||||||||||||||||||||||||||||||||||||||||||||||||||||||||||||||||||||||||||||||||||||||||||||||||||||||||||||||||||||||||||||||||||||||||||||||||||||||
|
|
||||||||||||||||||||||||||||||||||||||||||||||||||||||||||||||||||||||||||||||||||||||||||||||||||||||||||||||||||||||||||||||||||||||||||||||||||||||||||||||||||||||||||||||||||||||||||||||||||||||||||||
2023 STATISTICAL LEADERS |

2023 GAME BY GAME STATS |
 |
2023 SCHEDULE |
2022 RESULTS |
||||||||||||||||||||||||||||||||||||||||||||||||||||||||||||||||||||||||||||||||||||||||||||||||||||||||||||||||||||||||||||||||||||||||||||||||||||||||||||||||||||||||||||||||||||||||||||||||
|
|
||||||||||||||||||||||||||||||||||||||||||||||||||||||||||||||||||||||||||||||||||||||||||||||||||||||||||||||||||||||||||||||||||||||||||||||||||||||||||||||||||||||||||||||||||||||||||||||||
2022 STATISTICAL LEADERS |

2022 GAME BY GAME STATS |
 |
2022 SCHEDULE |
2021 RESULTS |
||||||||||||||||||||||||||||||||||||||||||||||||||||||||||||||||||||||||||||||||||||||||||||||||||||||||||||||||||||||||||||||||||||||||||||||||||||||||||||||||||||||||||||||||||||
|
|
2021 STATISTICAL LEADERS |

2021 GAME BY GAME STATS |
 |
2021 SCHEDULE |
2020 RESULTS |
||||||||||||||||||||||||||||||||||||||||||||||||||||||||||||||||||||||||||||||||||||||||||||||||||||||||||||||||||||||||||||||||||||||||||||||||||||||||||||||||||||||||||||||||||||
|
|
||||||||||||||||||||||||||||||||||||||||||||||||||||||||||||||||||||||||||||||||||||||||||||||||||||||||||||||||||||||||||||||||||||||||||||||||||||||||||||||||||||||||||||||||||||
2020 STATISTICAL LEADERS |

2020 GAME BY GAME STATS |
 |
2020 SCHEDULE |
2019 RESULTS |
||||||||||||||||||||||||||||||||||||||||||||||||||||||||||||||||||||||||||||||||||||||||||||||||||||||||||||||||||||||||||||||||||||||||||||||||||||||||||||||||||||||||||||||||||||||||||||||||||||||||||||
|
|
||||||||||||||||||||||||||||||||||||||||||||||||||||||||||||||||||||||||||||||||||||||||||||||||||||||||||||||||||||||||||||||||||||||||||||||||||||||||||||||||||||||||||||||||||||||||||||||||||||||||||||
2019 STATISTICAL LEADERS |

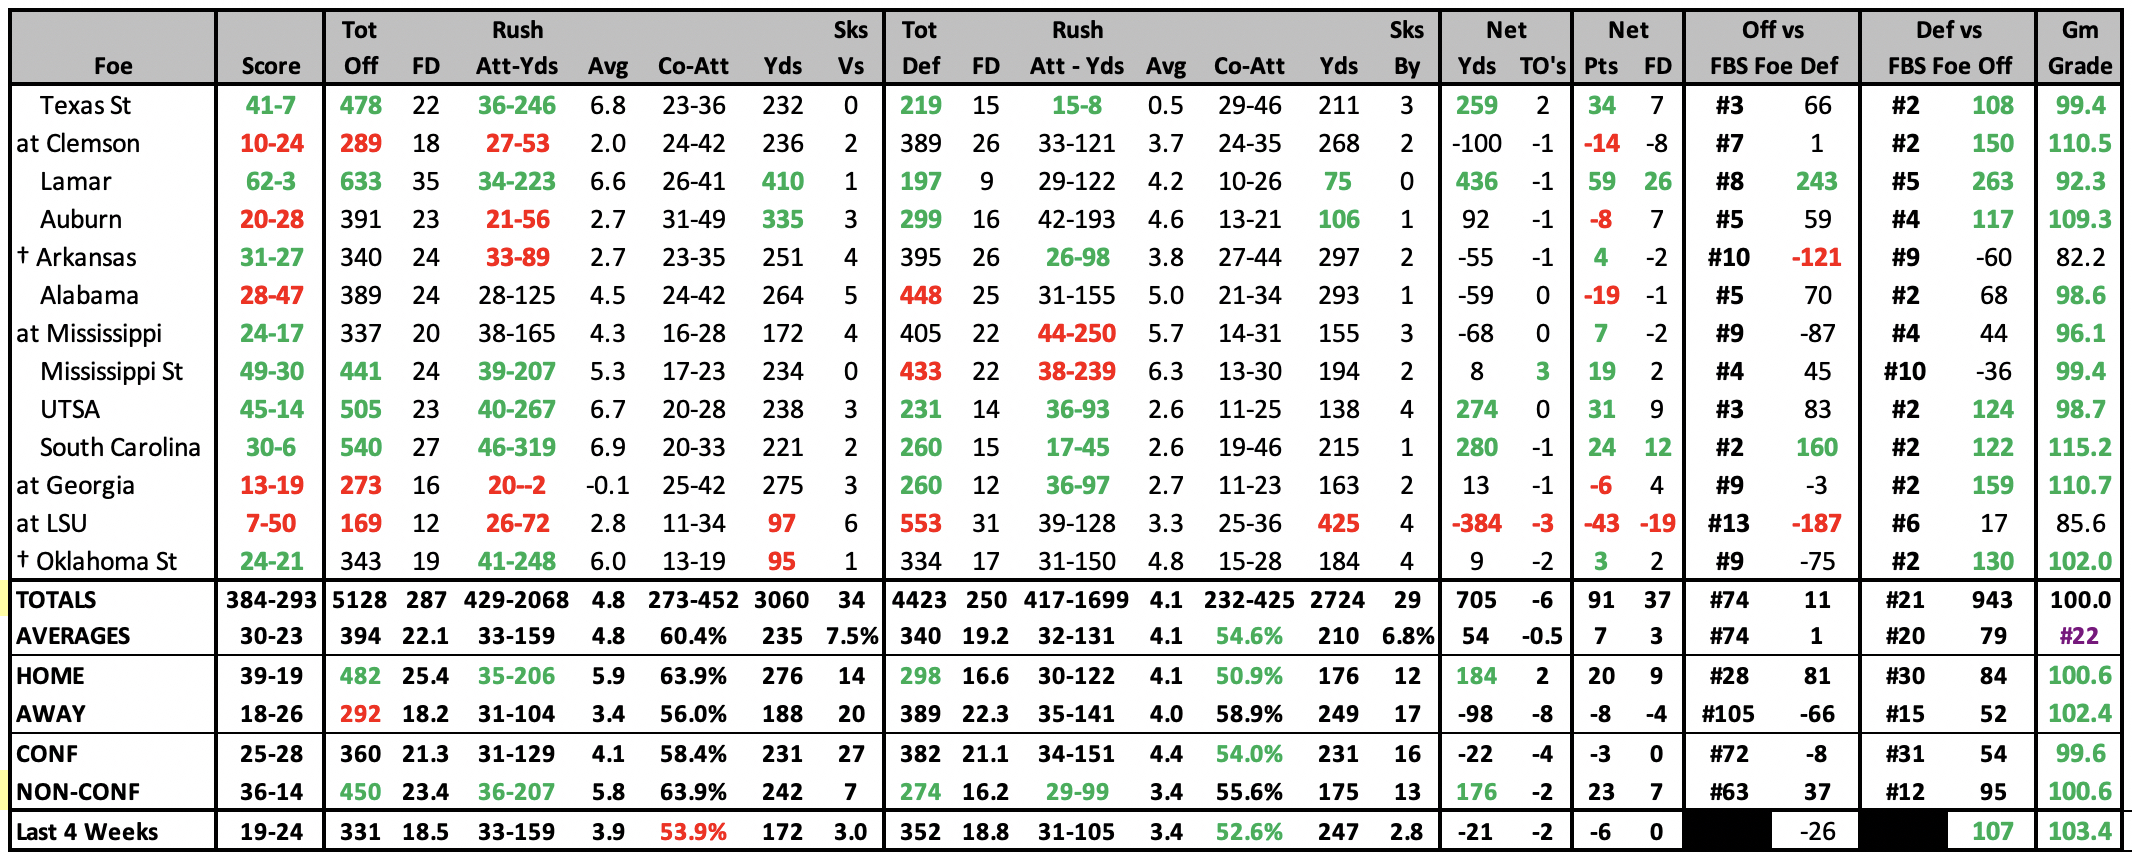
2019 GAME BY GAME STATS |
 |
2019 SCHEDULE |
2018 RESULTS |
||||||||||||||||||||||||||||||||||||||||||||||||||||||||||||||||||||||||||||||||||||||||||||||||||||||||||||||||||||||||||||||||||||||||||||||||||||||||||||||||||||||||||||||||||||||||||||||||||||||||||||||||||||||||||||
|
|
||||||||||||||||||||||||||||||||||||||||||||||||||||||||||||||||||||||||||||||||||||||||||||||||||||||||||||||||||||||||||||||||||||||||||||||||||||||||||||||||||||||||||||||||||||||||||||||||||||||||||||||||||||||||||||
2018 STATISTICAL LEADERS |

2018 GAME BY GAME STATS |
 |
2018 SCHEDULE |
2017 RESULTS |
|||||||||||||||||||||||||||||||||||||||||||||||||||||||||||||||||||||||||||||||||||||||||||||||||||||||||||||||||||||||||||||||||||||||||||||||||||||||||||||||||||||||||||||||||||||||||||||||||||||||||||||||||||||||||||||||||||||||
|
|
|||||||||||||||||||||||||||||||||||||||||||||||||||||||||||||||||||||||||||||||||||||||||||||||||||||||||||||||||||||||||||||||||||||||||||||||||||||||||||||||||||||||||||||||||||||||||||||||||||||||||||||||||||||||||||||||||||||||
2017 STATISTICAL LEADERS |

2017 GAME BY GAME STATS |
 |
2017 SCHEDULE |
2016 RESULTS |
||||||||||||||||||||||||||||||||||||||||||||||||||||||||||||||||||||||||||||||||||||||||||||||||||||||||||||||||||||||||||||||||||||||||||||||||||||||||||||||||||||||||||||||||||||||||||||||||||||||||||||||||||||||||||||||||||||||||||||||
|
|
||||||||||||||||||||||||||||||||||||||||||||||||||||||||||||||||||||||||||||||||||||||||||||||||||||||||||||||||||||||||||||||||||||||||||||||||||||||||||||||||||||||||||||||||||||||||||||||||||||||||||||||||||||||||||||||||||||||||||||||
2016 STATISTICAL LEADERS |

2016 GAME BY GAME STATS |
 |
2015 STATISTICAL LEADERS |

2015 GAME BY GAME STATS |
 |
2015 SCHEDULE |
2014 RESULTS |
||||||||||||||||||||||||||||||||||||||||||||||||||||||||||||||||||||||||||||||||||||||||||||||||||||||||||||||||||||||||||||||||||||||||||||||||||||||||||||||||||||||||||||||||||||||||||||||||||||||||||||||||||||||||||||||||||||||||||||||||||||||||||||
|
|
||||||||||||||||||||||||||||||||||||||||||||||||||||||||||||||||||||||||||||||||||||||||||||||||||||||||||||||||||||||||||||||||||||||||||||||||||||||||||||||||||||||||||||||||||||||||||||||||||||||||||||||||||||||||||||||||||||||||||||||||||||||||||||
2014 STATISTICAL LEADERS |

2014 GAME BY GAME STATS |
 |
2013 STATISTICAL LEADERS |
| Player | Att | Yds | YPC | TD | Player | Comp | Att | % | Yds | YPA | TD | INT | Rating | Player | Rec | Yds | YPC | TD |
| Johnny Manziel | 143 | 748 | 5.2 | 9 | Johnny Manziel | 300 | 429 | 69.9% | 4114 | 9.6 | 37 | 13 | 172.9 | Mike Evans | 69 | 1394 | 20.2 | 12 |
| Ben Malena | 115 | 562 | 4.9 | 10 | Matt Joeckel | 22 | 37 | 59.5% | 293 | 7.9 | 2 | 0 | 143.8 | Derel Walker | 51 | 818 | 16.0 | 5 |
| Trey Williams | 58 | 407 | 7.0 | 6 | Kenny Hill | 16 | 22 | 72.7% | 183 | 8.3 | 1 | 0 | 157.6 | Malcome Kennedy | 60 | 658 | 11.0 | 7 |
2013 GAME BY GAME STATS |
 |
2013 RESULTS |
2012 RESULTS |
|||||||||||||||||||||||||||||||||||||||||||||||||||||||||||||||||||||||||||||||||||||||||||||||||||||||||||||||||||||||||||||||||||||||||||||||||||||||||||||||||||||||||||||||||||||||||||||||||||||||||||||||||||||||||||||||||||||||||||||||||||||||||||||||||||||||||||||||||||||
|
|
|||||||||||||||||||||||||||||||||||||||||||||||||||||||||||||||||||||||||||||||||||||||||||||||||||||||||||||||||||||||||||||||||||||||||||||||||||||||||||||||||||||||||||||||||||||||||||||||||||||||||||||||||||||||||||||||||||||||||||||||||||||||||||||||||||||||||||||||||||||
2012 STATISTICAL LEADERS |
| Player | Att | Yds | YPC | TD | Player | Comp | Att | % | Yds | YPA | TD | INT | Rating | Player | Rec | Yds | YPC | TD | ||
| Johnny Manziel | 200 | 1406 | 7.0 | 21 | Johnny Manziel | 295 | 434 | 68.0% | 3712 | 8.6 | 26 | 9 | 155.4 | Mike Evans | 82 | 1105 | 13.5 | 5 | ||
| Ben Malena | 139 | 811 | 5.8 | 8 | Jameill Showers | 27 | 44 | 61.4% | 320 | 7.3 | 2 | 1 | 132.9 | Ryan Swope | 72 | 927 | 12.9 | 8 | ||
| Christine Michael | 88 | 417 | 4.7 | 12 | Kenric McNeal | 2 | 3 | 66.7% | 47 | 15.7 | 0 | 0 | 198.3 | Uzoma Nwachukwu | 26 | 477 | 18.3 | 7 |
| 2012 INDIVIDUAL PLAYER STATS • 2012 STARTS CHART/STARTERS LOST |
|---|
2012 GAME BY GAME STATS |
 |
2011 STATISTICAL LEADERS |
| Player | Att | Yds | YPC | TD | Player | Comp | Att | % | Yds | YPA | TD | INT | Rating | Player | Rec | Yds | YPC | TD | ||
| Cyrus Gray | 179 | 1050 | 5.9 | 12 | Ryan Tannehill | 327 | 531 | 61.6% | 3737 | 7.0 | 29 | 15 | 133.1 | Ryan Swope | 89 | 1205 | 13.5 | 11 | ||
| Christine Michael | 148 | 903 | 6.1 | 8 | Jameill Showers | 4 | 5 | 80.0% | 40 | 8.0 | 0 | 0 | 147.2 | Jeff Fuller | 70 | 828 | 11.8 | 6 | ||
| Ryan Tannehill | 58 | 302 | 5.2 | 4 | Cyrus Gray | 0 | 1 | 0.0% | 0 | 0.0 | 0 | 0 | 0.0 | Uzoma Nwachukwu | 50 | 641 | 12.8 | 2 |
| 2011 INDIVIDUAL PLAYER STATS • 2011 START CHART/STARTERS LOST |
|---|
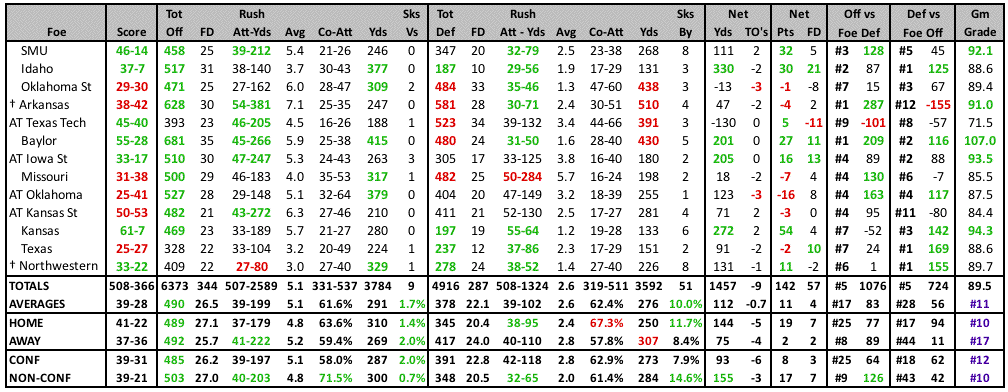
2011 GAME BY GAME STATS |
2011 RESULTS |
2010 RESULTS |
|||||||||||||||||||||||||||||||||||||||||||||||||||||||||||||||||||||||||||||||||||||||||||||||||||||||||||||||||||||||||||||||||||||||||||||||||||||||||||||||||||||||||||||||||||||||||||||||||||
|
|
|||||||||||||||||||||||||||||||||||||||||||||||||||||||||||||||||||||||||||||||||||||||||||||||||||||||||||||||||||||||||||||||||||||||||||||||||||||||||||||||||||||||||||||||||||||||||||||||||||
2010 STATISTICAL LEADERS |
| Player | Att | Yds | YPC | TD | Player | Comp | Att | % | Yds | YPA | TD | INT | Rating | Player | Rec | Yds | YPC | TD | ||
| Cyrus Gray | 200 | 1135 | 5.7 | 12 | Jerrod Johnson | 153 | 275 | 55.6% | 1908 | 6.9 | 14 | 9 | 124.2 | Jeff Fuller | 72 | 1069 | 14.8 | 12 | ||
| Christine Michael | 126 | 625 | 5.0 | 4 | Ryan Tannehill | 152 | 234 | 65.0% | 1645 | 7.0 | 13 | 6 | 137.2 | Ryan Swope | 66 | 775 | 11.7 | 4 | ||
| Jerrod Johnson | 79 | 145 | 1.8 | 2 | Cyrus Gray | 1 | 1 | 100.0% | 14 | 14.0 | 1 | 0 | 547.6 | Uzoma Nwachukwu | 36 | 407 | 11.3 | 4 |
| 2010 Individual Player Stats |
|---|
2010 GAME BY GAME STATS |
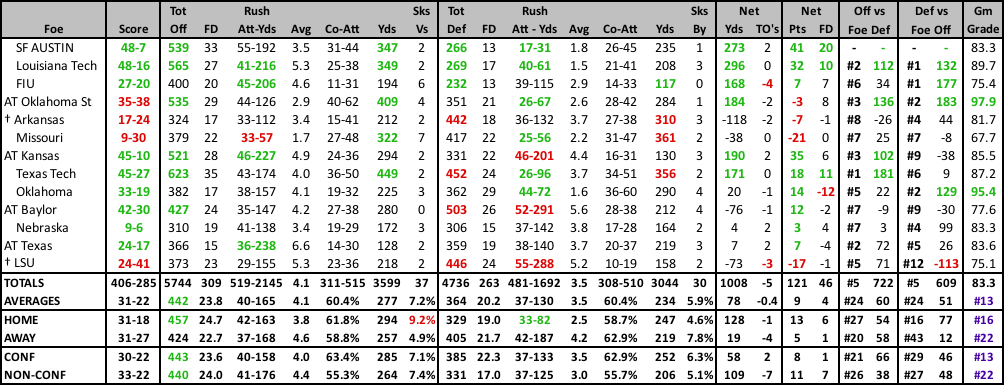
2009 STATISTICAL LEADERS |
| Player | Att | Yds | YPC | TD | Player | Comp | Att | % | Yds | YPA | TD | INT | Rating | Player | Rec | Yds | YPC | TD | ||
| Christine Michael | 151 | 767 | 5.08 | 9 | Jerrod Johnson | 267 | 439 | 60.8% | 3217 | 7.3 | 28 | 6 | 140.7 | U Nwachukwu | 37 | 670 | 18.1 | 6 | ||
| Cyrus Gray | 156 | 752 | 4.82 | 5 | Ryan Tannehill | 4 | 8 | 50.0% | 60 | 7.5 | 0 | 0 | 113.0 | Ryan Tannehill | 44 | 574 | 13.0 | 4 | ||
| Jerrod Johnson | 131 | 455 | 3.47 | 8 | Tommy Dorman | 2 | 3 | 66.7% | 22 | 7.3 | 0 | 0 | 128.3 | Jeff Fuller | 34 | 466 | 13.7 | 7 |
| 2009 Individual Player Stats |
|---|
2009 GAME BY GAME STATS |
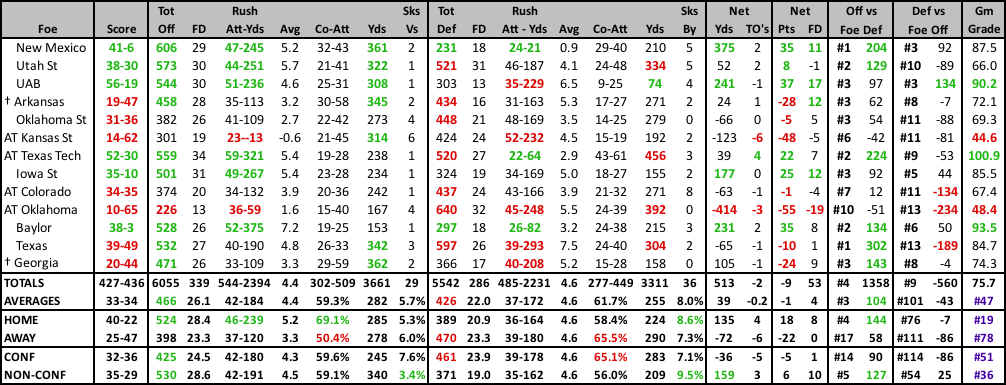
2009 RESULTS |
2008 RESULTS |
||||||||||||||||||||||||||||||||||||||||||||||||||||||||||||||||||||||||||||||||||||||||||||||||||||||||||||||||||||||||||||||||||||||||||||||||||||||
|
|
||||||||||||||||||||||||||||||||||||||||||||||||||||||||||||||||||||||||||||||||||||||||||||||||||||||||||||||||||||||||||||||||||||||||||||||||||||||
| 2008 Individual Player Stats • 2007 Individual Stats |
|---|

