
| NEW YORK GIANTS |  |
|
|---|---|---|
 |
NFC EAST EAST RUTHERFORD, NEW JERSEY WEATHER.COM: ZIP CODE 07073 |
|
MetLife STADIUM Opened: 4/10/2010 |
Head Coach: Mike Kafka (INT) 1st Year |
|
•••• LINKS OF INTEREST •••• |
||
| LAST 20 YEAR LOGS |
|---|
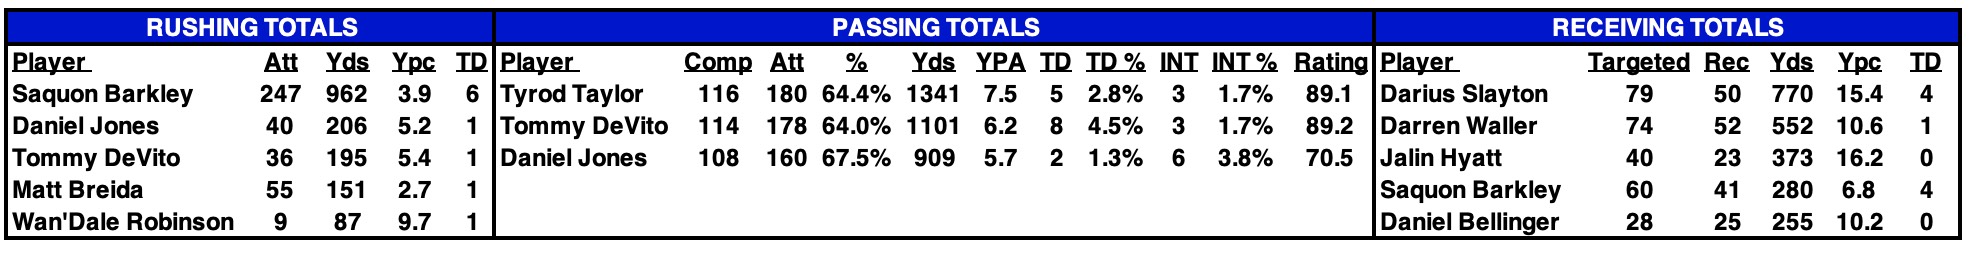
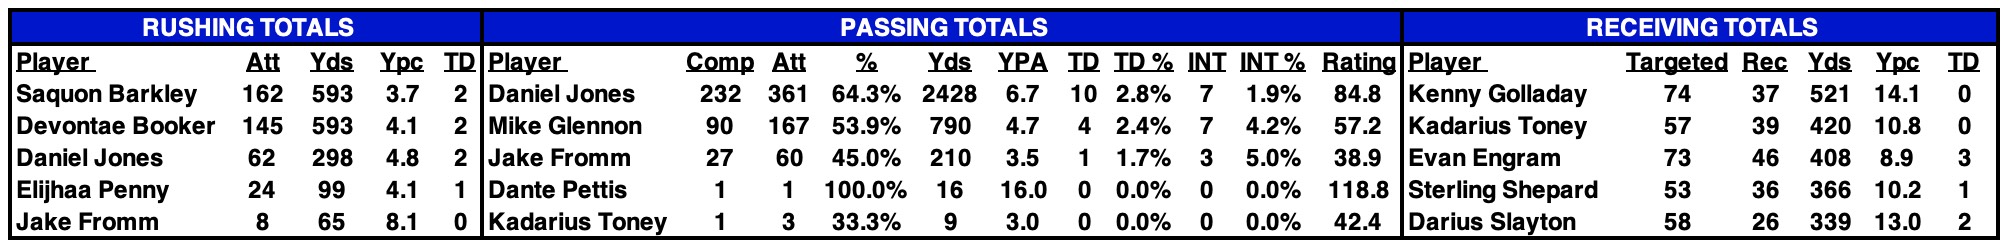
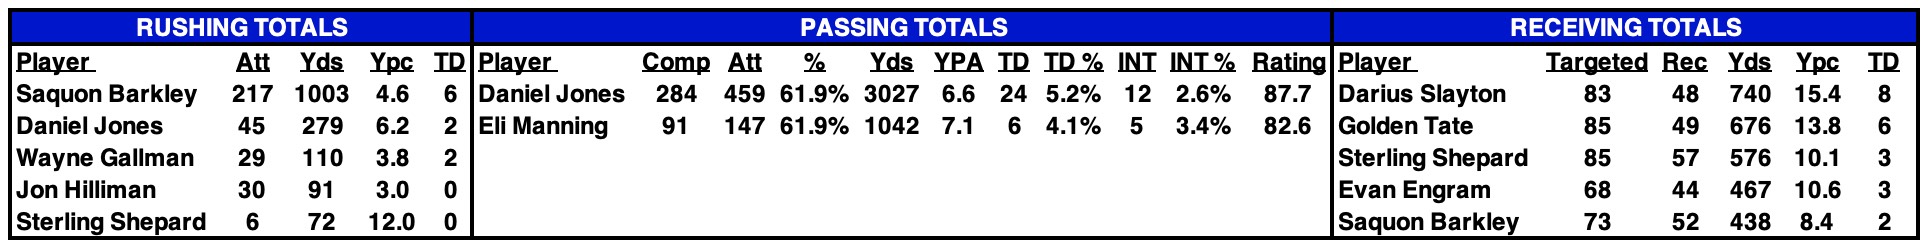
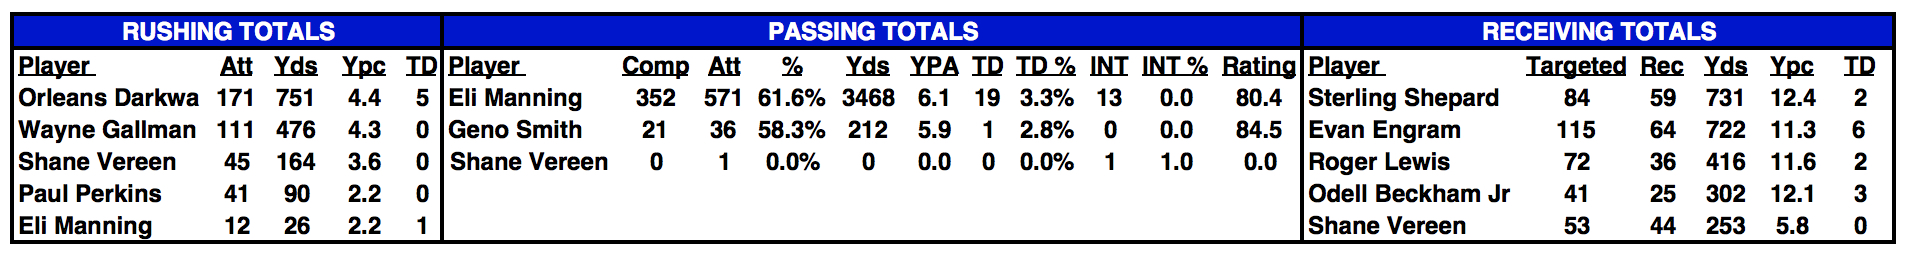
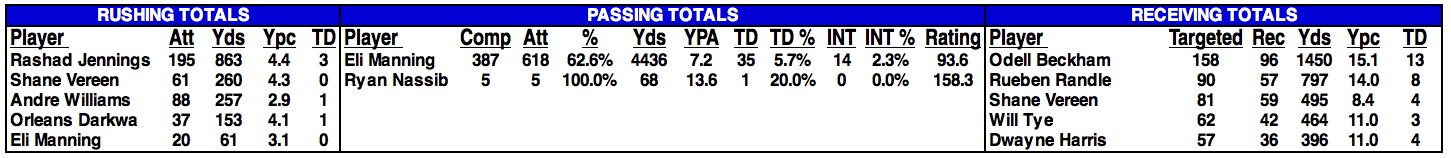
| 2025 STATISTICAL LEADERS | ||
|---|---|---|
 |
||
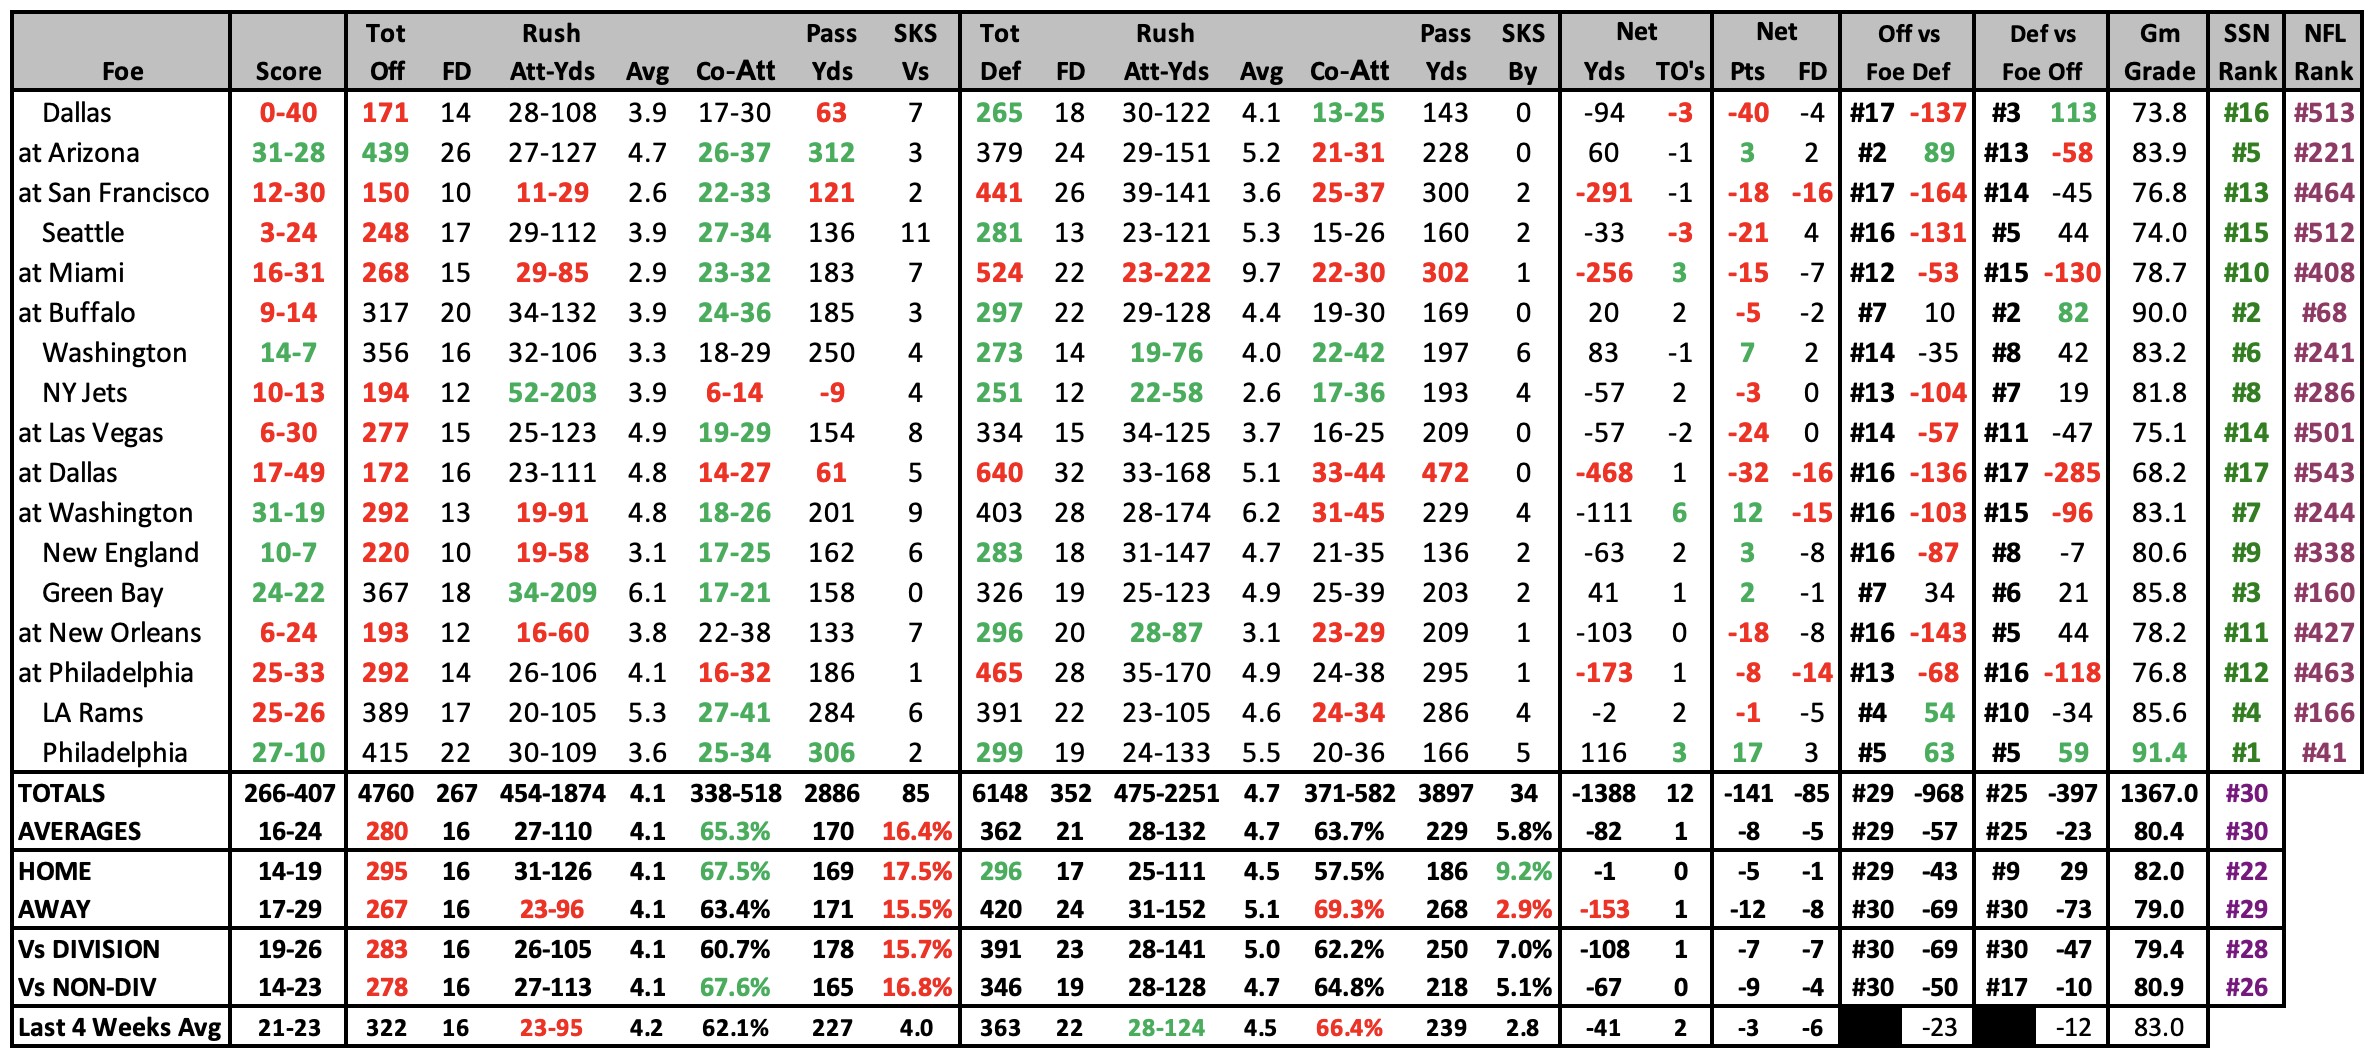
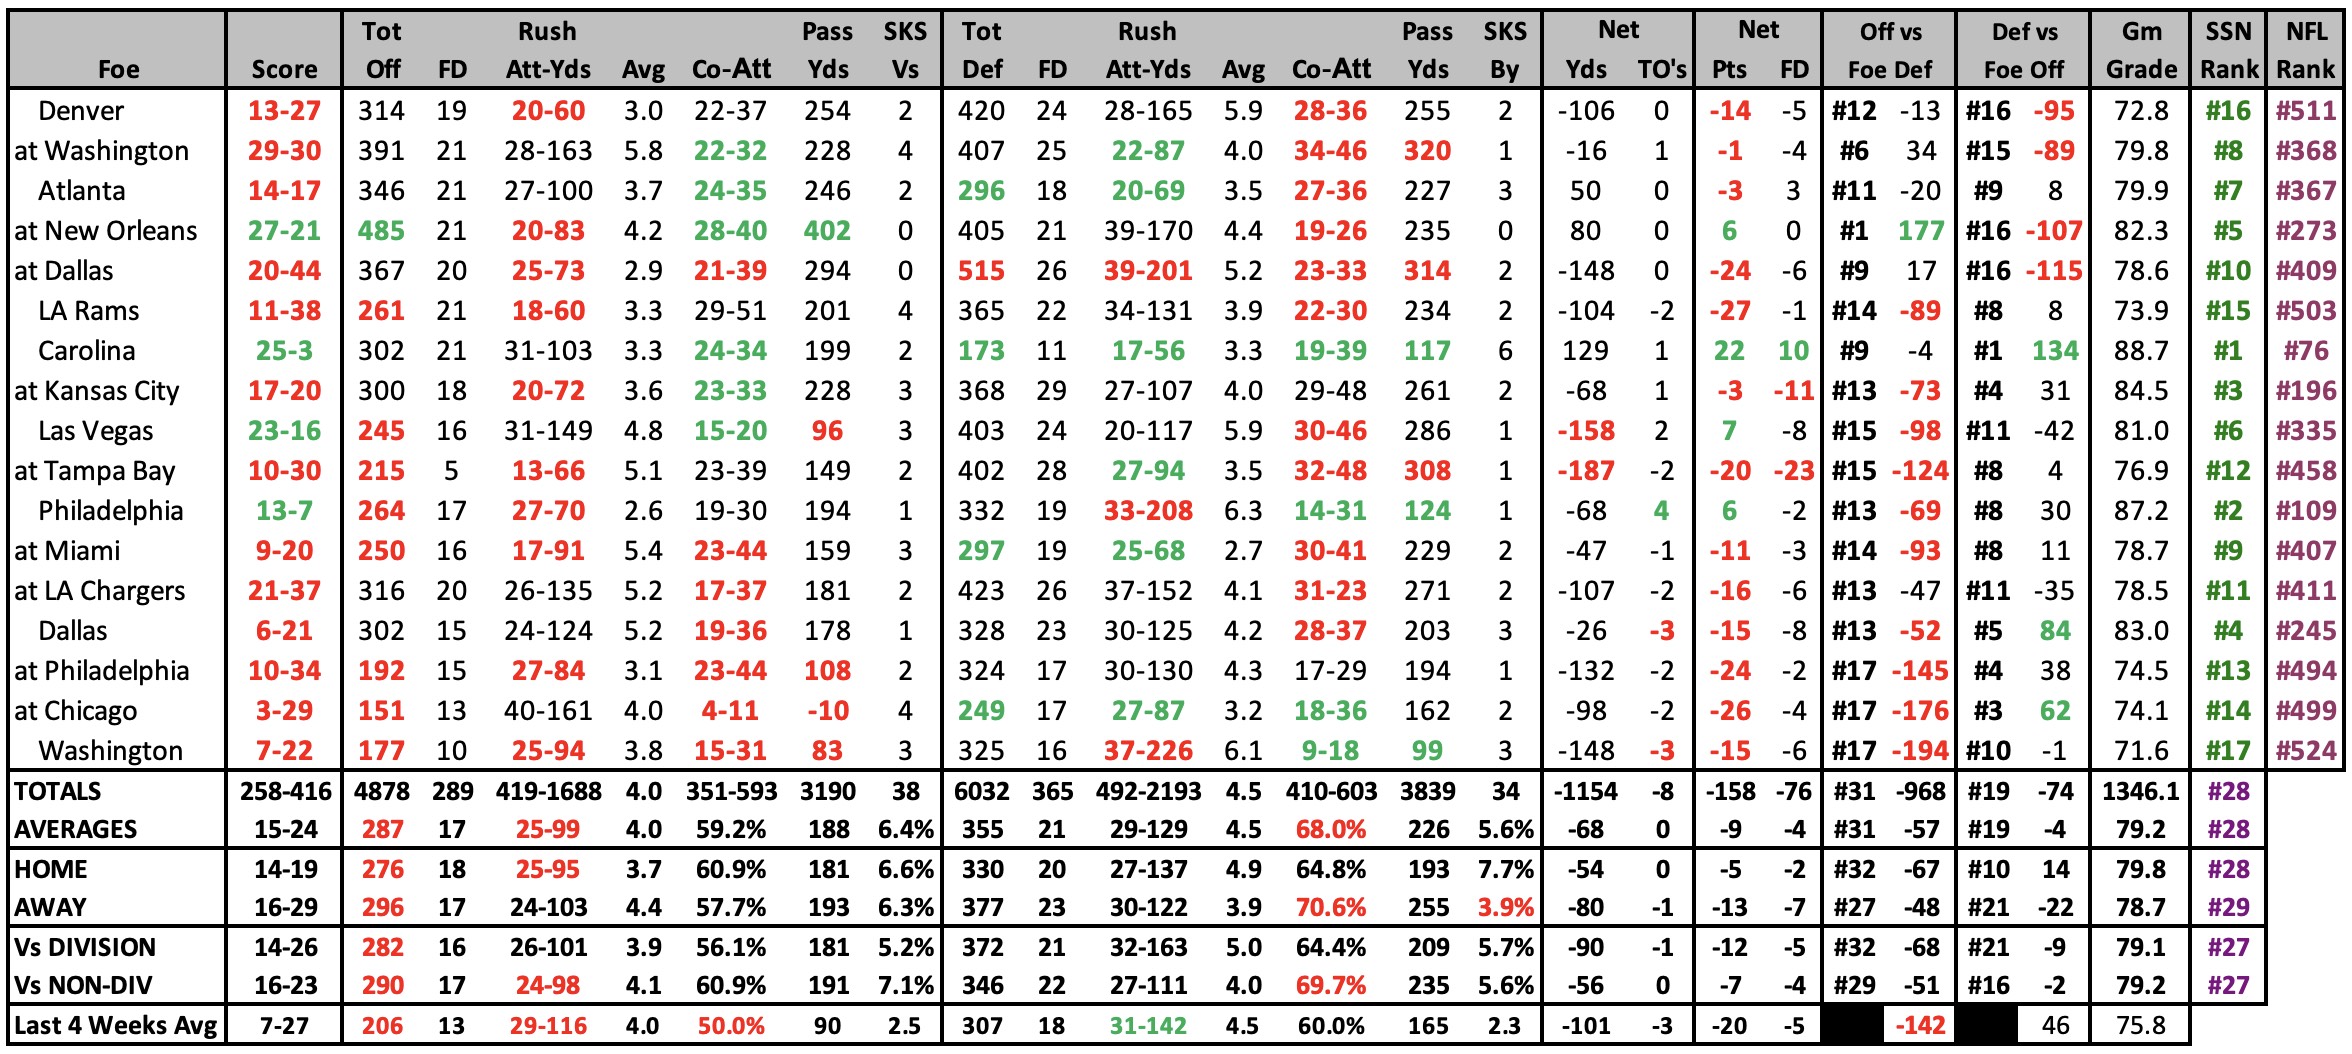
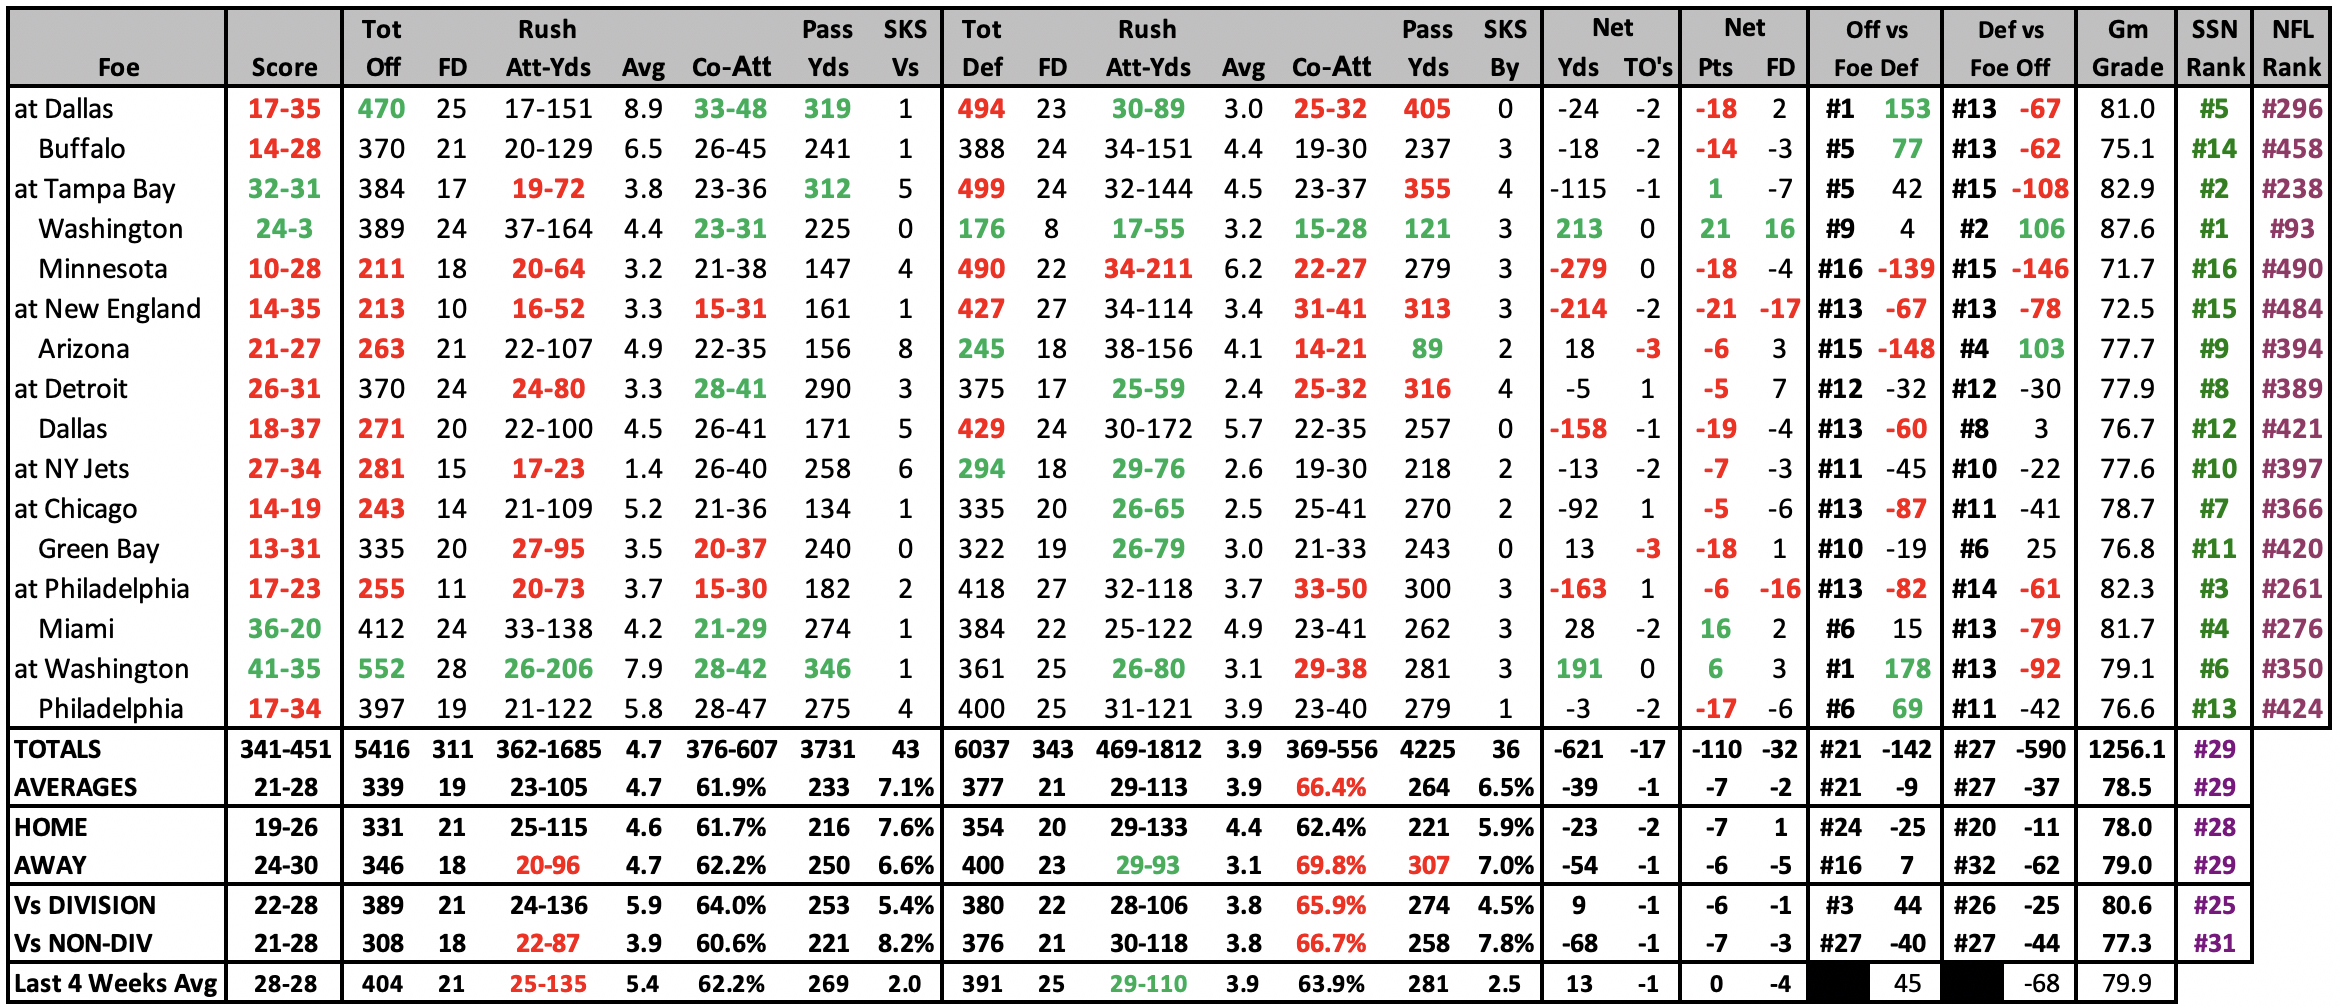
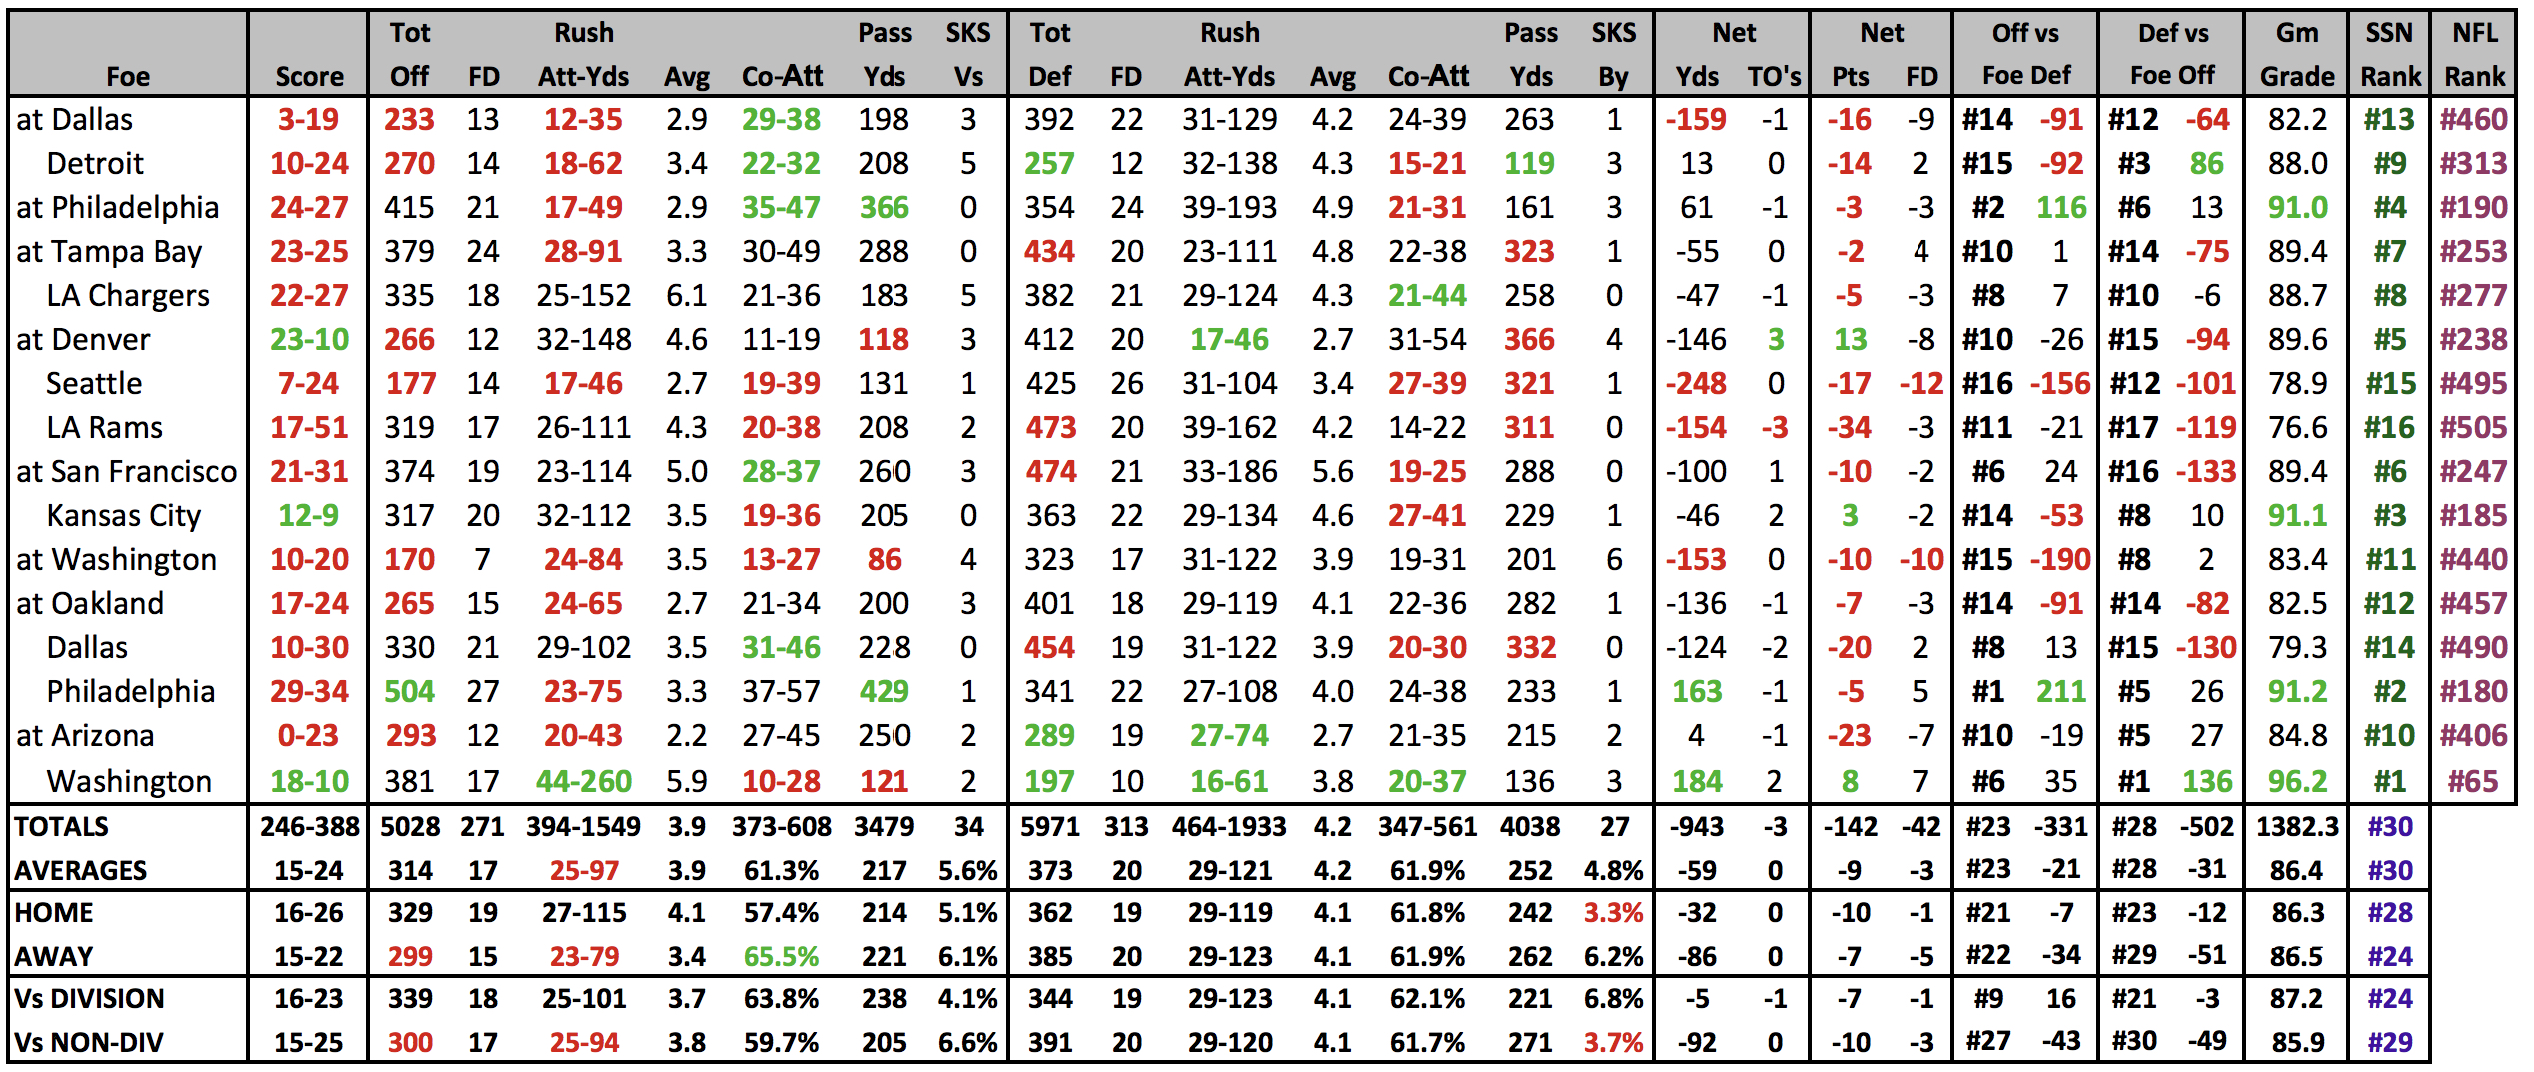
| 2025 GAME BY GAME STATS | ||
 |
2025 SCHEDULE |
2024 RESULTS |
||||||||||||||||||||||||||||||||||||||||||||||||||||||||||||||||||||||||||||||||||||||||||||||||||||||||||||||||||||||||||||||||||||||||||||||||||||||||||||||||||||||||||||||||||||||||||||||||||||||||||||||||||||||||||||||||||||||||||||||||||||||||||||||||||||||||||
|
|
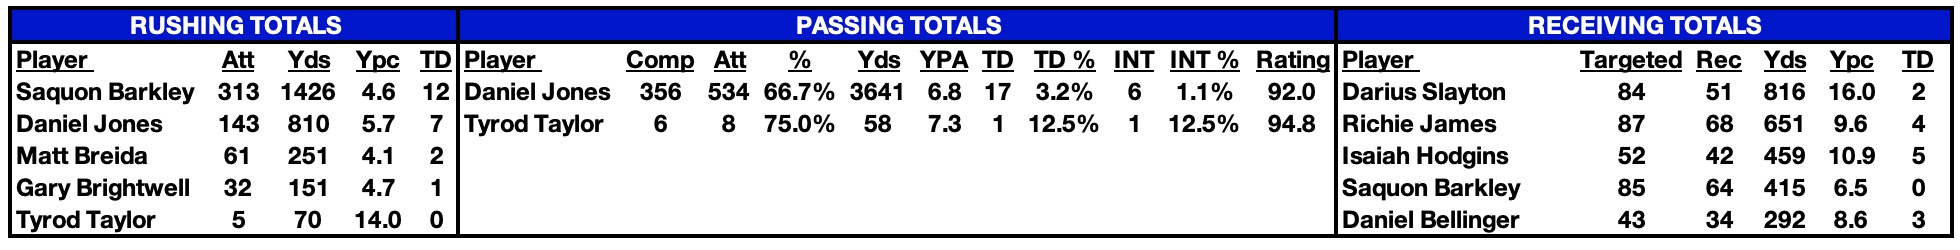
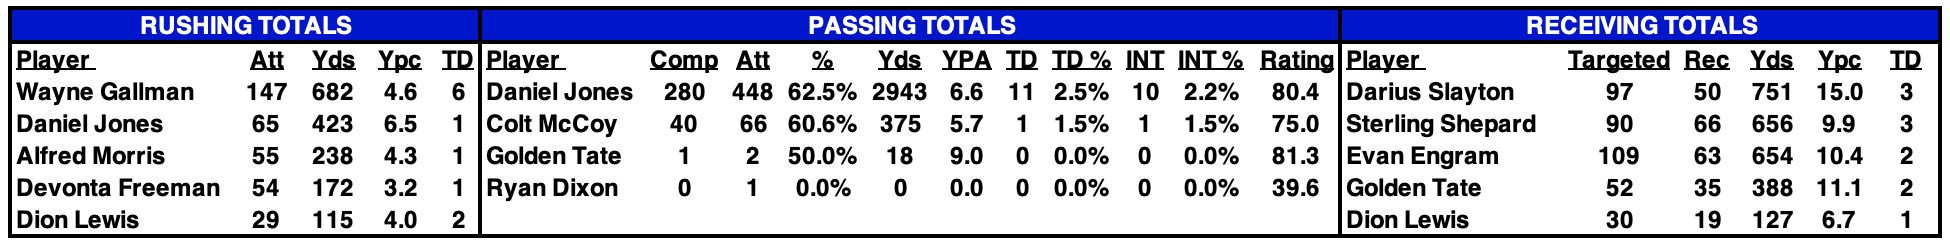
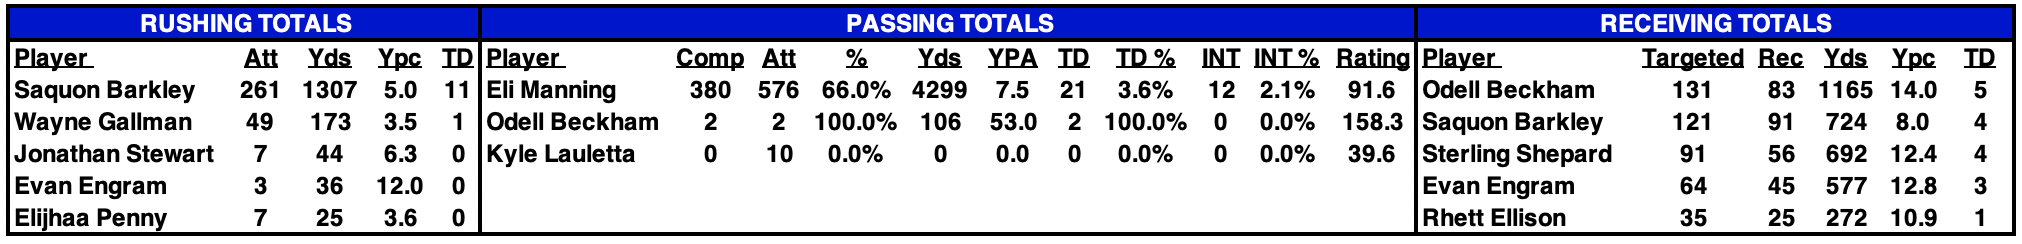
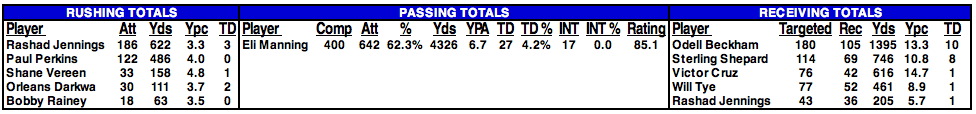
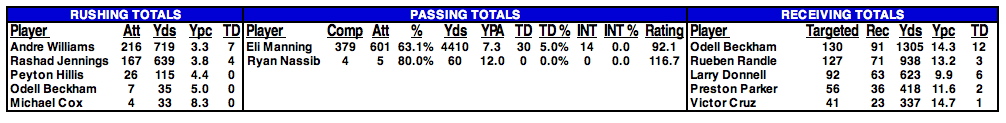
| 2024 STATISTICAL LEADERS | ||
|---|---|---|
 |
||
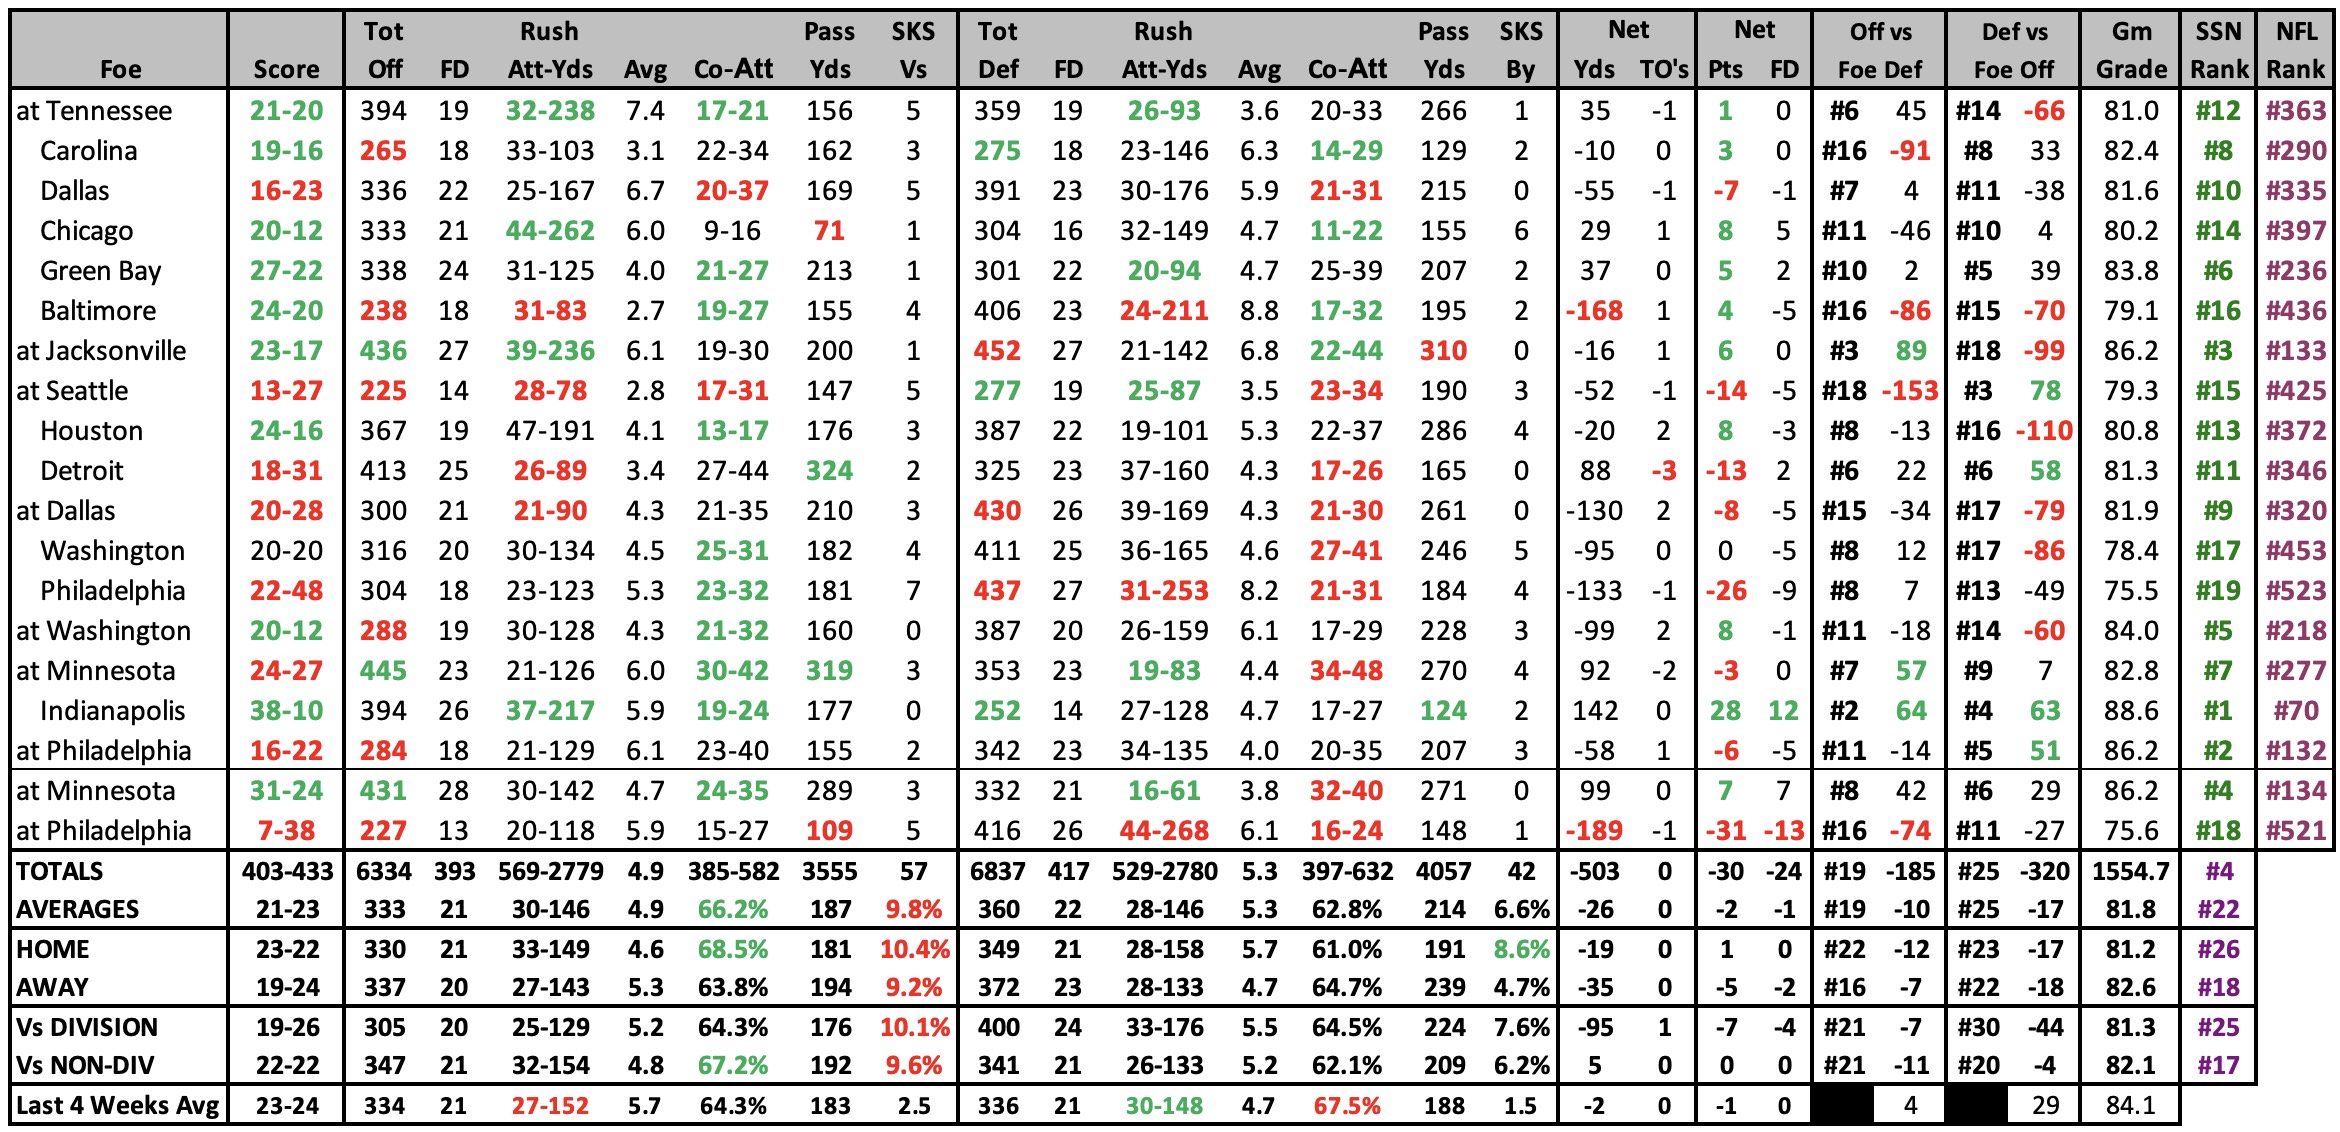
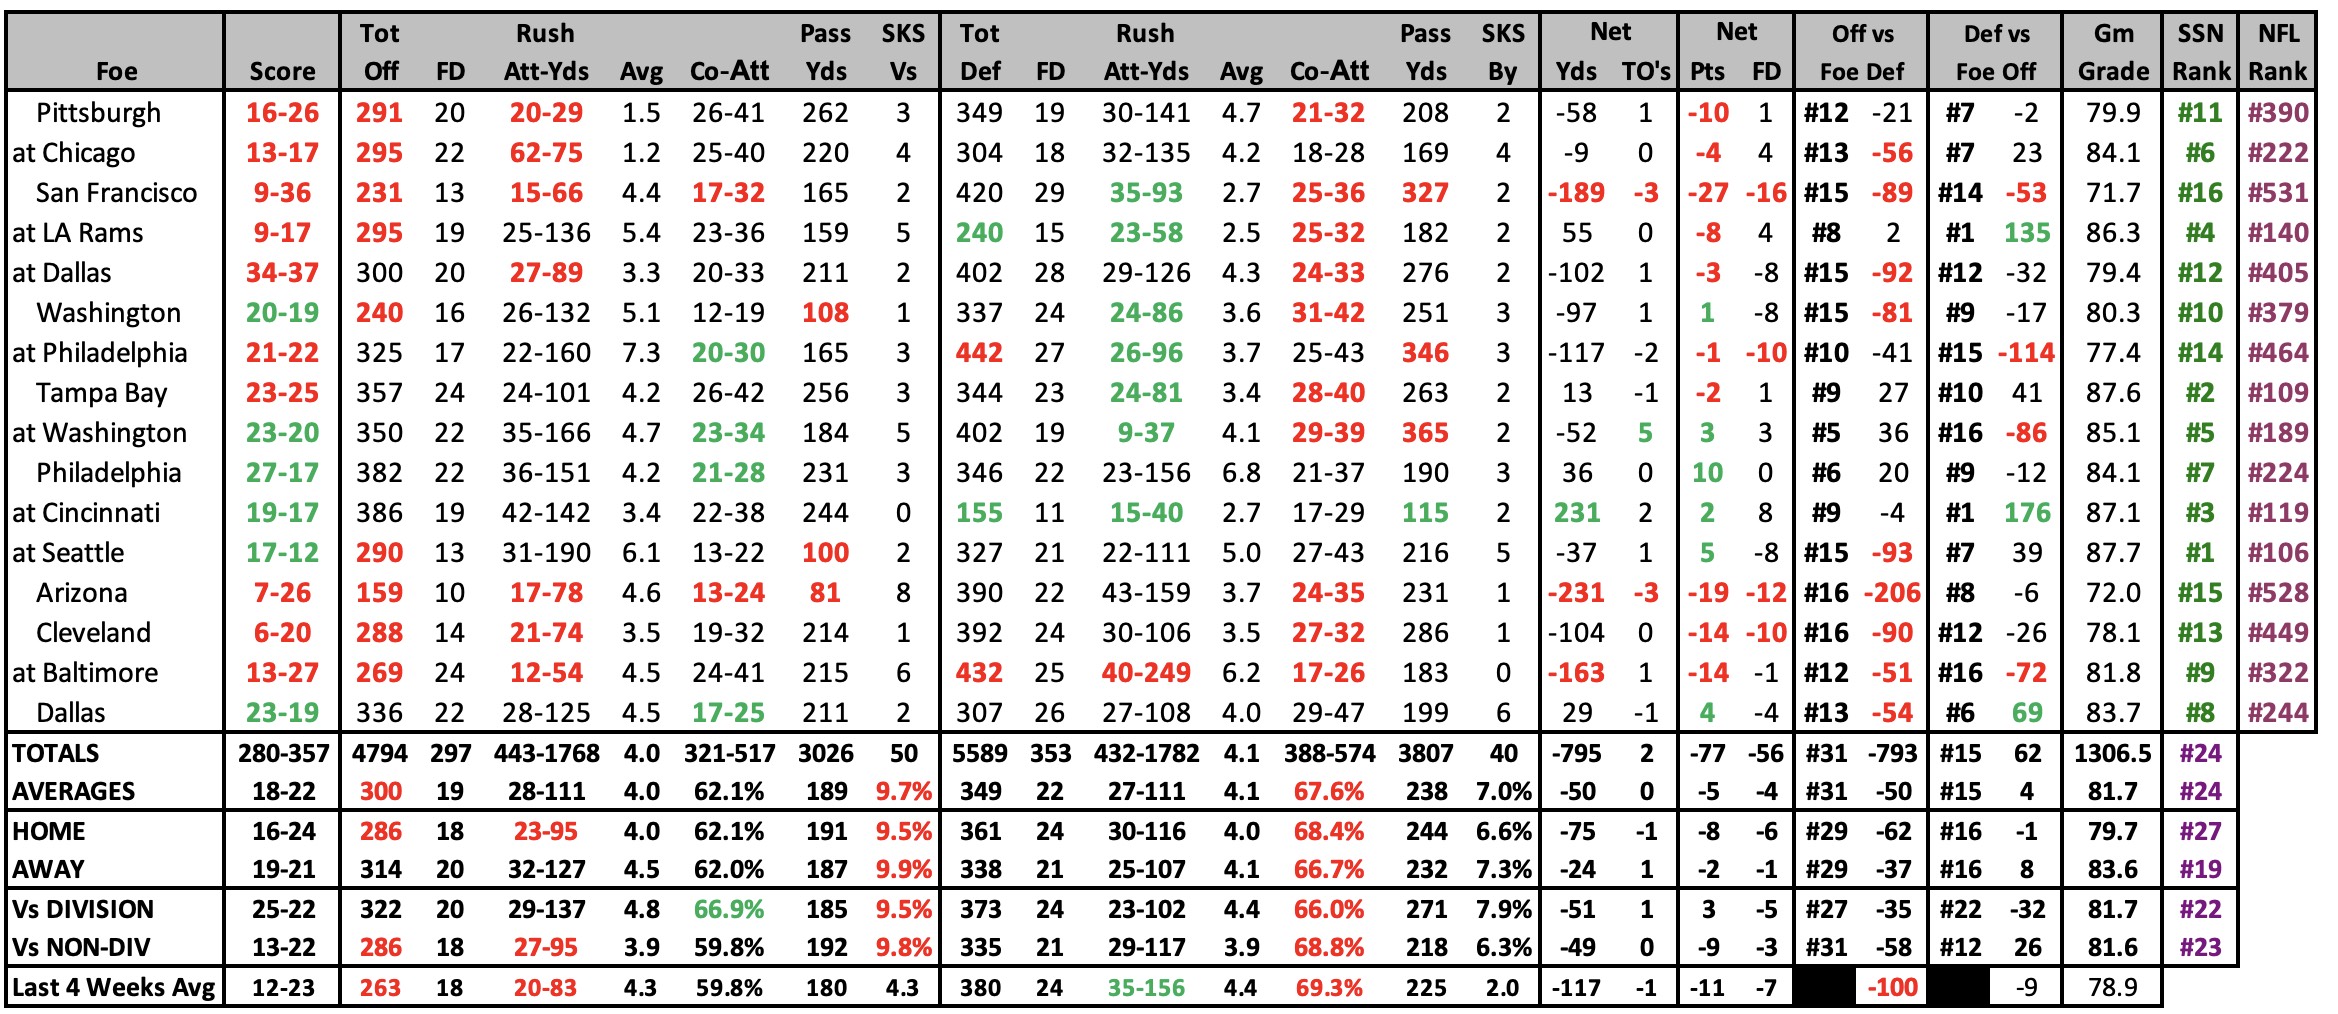
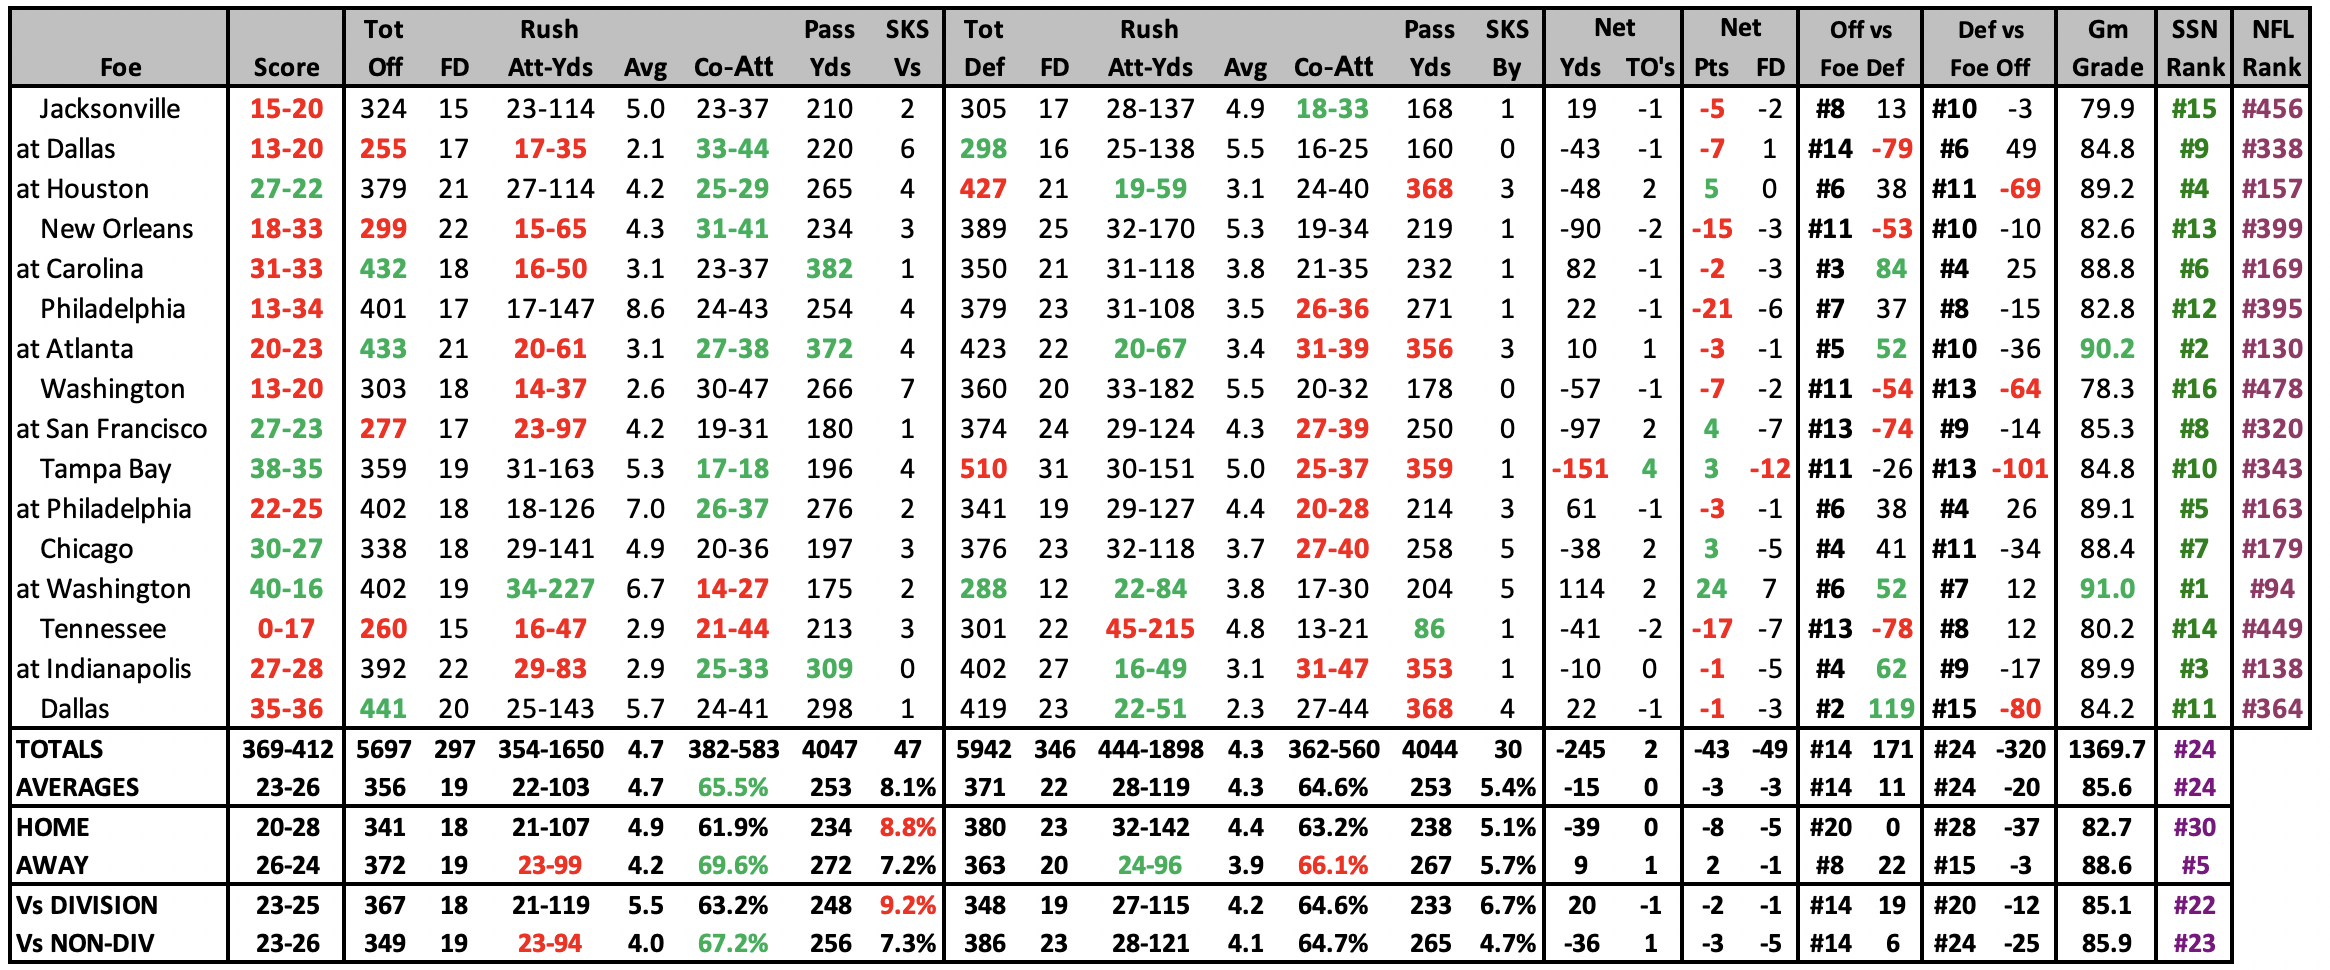
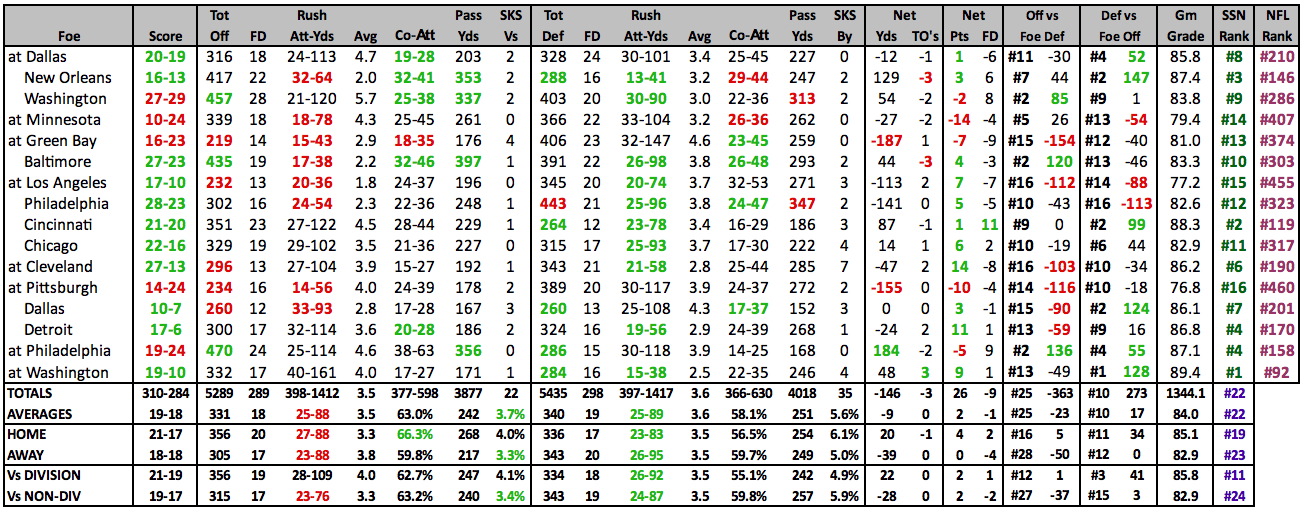
| 2024 GAME BY GAME STATS | ||
 |
2024 SCHEDULE |
2023 RESULTS |
||||||||||||||||||||||||||||||||||||||||||||||||||||||||||||||||||||||||||||||||||||||||||||||||||||||||||||||||||||||||||||||||||||||||||||||||||||||||||||||||||||||||||||||||||||||||||||||||||||||||||||||||||||||||||||||||||||||||||||||||||||||||||||||||||||||||||
|
|
| 2023 STATISTICAL LEADERS | ||
|---|---|---|
 |
||
| 2023 GAME BY GAME STATS | ||
 |
2023 SCHEDULE |
2022 RESULTS |
||||||||||||||||||||||||||||||||||||||||||||||||||||||||||||||||||||||||||||||||||||||||||||||||||||||||||||||||||||||||||||||||||||||||||||||||||||||||||||||||||||||||||||||||||||||||||||||||||||||||||||||||||||||||||||||||||||||||||||||||||||||||||||||||||||||||||||||||||||||||||||||||||||||
|
|
||||||||||||||||||||||||||||||||||||||||||||||||||||||||||||||||||||||||||||||||||||||||||||||||||||||||||||||||||||||||||||||||||||||||||||||||||||||||||||||||||||||||||||||||||||||||||||||||||||||||||||||||||||||||||||||||||||||||||||||||||||||||||||||||||||||||||||||||||||||||||||||||||||||
| 2022 STATISTICAL LEADERS | ||
|---|---|---|
 |
||
| 2022 GAME BY GAME STATS | ||
 |
2022 SCHEDULE |
2021 RESULTS |
||||||||||||||||||||||||||||||||||||||||||||||||||||||||||||||||||||||||||||||||||||||||||||||||||||||||||||||||||||||||||||||||||||||||||||||||||||||||||||||||||||||||||||||||||||||||||||||||||||||||||||||||||||||||||||||||||||||||||||||||||||||||||||||||||||||||||||||||||||||||||||||||||||||
|
|
||||||||||||||||||||||||||||||||||||||||||||||||||||||||||||||||||||||||||||||||||||||||||||||||||||||||||||||||||||||||||||||||||||||||||||||||||||||||||||||||||||||||||||||||||||||||||||||||||||||||||||||||||||||||||||||||||||||||||||||||||||||||||||||||||||||||||||||||||||||||||||||||||||||
| 2021 STATISTICAL LEADERS | ||
|---|---|---|
 |
||
| 2021 GAME BY GAME STATS | ||
 |
2021 SCHEDULE |
2020 RESULTS |
|||||||||||||||||||||||||||||||||||||||||||||||||||||||||||||||||||||||||||||||||||||||||||||||||||||||||||||||||||||||||||||||||||||||||||||||||||||||||||||||||||||||||||||||||||||||||||||||||||||||||||||||||||||||||||||||||||||||||||||||||||||||||||||||||||
|
|
| 2020 STATISTICAL LEADERS | ||
|---|---|---|
 |
||
| 2020 GAME BY GAME STATS | ||
 |
2020 SCHEDULE |
2019 RESULTS |
||||||||||||||||||||||||||||||||||||||||||||||||||||||||||||||||||||||||||||||||||||||||||||||||||||||||||||||||||||||||||||||||||||||||||||||||||||||||||||||||||||||||||||||||||||||||||||||||||||||||||||||||||||||||||||||||||||||||||||||||||||||||||||
|
|
| 2019 STATISTICAL LEADERS | ||
|---|---|---|
 |
||
| 2019 GAME BY GAME STATS | ||
 |
2019 SCHEDULE |
2018 RESULTS |
||||||||||||||||||||||||||||||||||||||||||||||||||||||||||||||||||||||||||||||||||||||||||||||||||||||||||||||||||||||||||||||||||||||||||||||||||||||||||||||||||||||||||||||||||||||||||||||||||||||||||||||||||||||||||||||||||||||||||
|
|
| 2018 STATISTICAL LEADERS | ||
|---|---|---|
 |
||
| 2018 GAME BY GAME STATS | ||
 |
2018 SCHEDULE |
2017 RESULTS |
||||||||||||||||||||||||||||||||||||||||||||||||||||||||||||||||||||||||||||||||||||||||||||||||||||||||||||||||||||||||||||||||||||||||||||||||||||||||||||||||||||||||||||||||||||||||||||||||||||||||||||||||||||||||||||||||||||||||||||||||||||||||||||
|
|
| 2017 STATISTICAL LEADERS | ||
|---|---|---|
 |
||
| 2017 GAME BY GAME STATS | ||
 |
2017 SCHEDULE |
2016 RESULTS |
||||||||||||||||||||||||||||||||||||||||||||||||||||||||||||||||||||||||||||||||||||||||||||||||||||||||||||||||||||||||||||||||||||||||||||||||||||||||||||||||||||||||||||||||||||||||||||||||||||||||||||||||||||||||||||||||||||||||||||||||||||||||||||||||||||||||||
|
|
||||||||||||||||||||||||||||||||||||||||||||||||||||||||||||||||||||||||||||||||||||||||||||||||||||||||||||||||||||||||||||||||||||||||||||||||||||||||||||||||||||||||||||||||||||||||||||||||||||||||||||||||||||||||||||||||||||||||||||||||||||||||||||||||||||||||||
| 2016 STATISTICAL LEADERS | ||
|---|---|---|
 |
||
| 2016 GAME BY GAME STATS | ||
 |
| 2015 STATISTICAL LEADERS | ||
|---|---|---|
 |
||
| 2015 GAME BY GAME STATS | ||
 |
2015 SCHEDULE |
2014 RESULTS |
|||||||||||||||||||||||||||||||||||||||||||||||||||||||||||||||||||||||||||||||||||||||||||||||||||||||||||||||||||||||||||||||||||||||||||||||||||||||||||||||||||||||||||||||||||||||||||||||||||||||||||||||||||||||||||||||||||||||||||||||||||||||||
|
|
| 2014 STATISTICAL LEADERS | ||
|---|---|---|
 |
||
| 2014 GAME BY GAME STATS | ||
 |
| 2013 STATISTICAL LEADERS | ||||||||||||||||||||||||||||||||||||||||||||||||||||||||||||||||||||||||||||||||||||||||||
|---|---|---|---|---|---|---|---|---|---|---|---|---|---|---|---|---|---|---|---|---|---|---|---|---|---|---|---|---|---|---|---|---|---|---|---|---|---|---|---|---|---|---|---|---|---|---|---|---|---|---|---|---|---|---|---|---|---|---|---|---|---|---|---|---|---|---|---|---|---|---|---|---|---|---|---|---|---|---|---|---|---|---|---|---|---|---|---|---|---|---|
|
||||||||||||||||||||||||||||||||||||||||||||||||||||||||||||||||||||||||||||||||||||||||||
| 2013 GAME BY GAME STATS | ||||||||||||||||||||||||||||||||||||||||||||||||||||||||||||||||||||||||||||||||||||||||||
 |
||||||||||||||||||||||||||||||||||||||||||||||||||||||||||||||||||||||||||||||||||||||||||
2013 SCHEDULE |
2012 RESULTS |
||||||||||||||||||||||||||||||||||||||||||||||||||||||||||||||||||||||||||||||||||||||||||||||||||||||||||||||||||||||||||||||||||||||||||||||||||||||||||||||||||||||||||||||||||||||||||||||||||||||||||||||||||||||||||||||||||||||||||||||||||||||||||||
|
|
||||||||||||||||||||||||||||||||||||||||||||||||||||||||||||||||||||||||||||||||||||||||||||||||||||||||||||||||||||||||||||||||||||||||||||||||||||||||||||||||||||||||||||||||||||||||||||||||||||||||||||||||||||||||||||||||||||||||||||||||||||||||||||
| 2012 INDIVIDUAL PLAYER STATS | |
|---|---|
| 2012 DRIVE CHARTS |
2012 OFFENSIVE AND DEFENSIVE DRIVE CHART - END OF REGULAR SEASON |
|---|
| 2012 STATISTICAL LEADERS | ||||||||||||||||||||||||||||||||||||||||||||||||||||||||||||||||||||||||||||||||||||||||||||||||||
|---|---|---|---|---|---|---|---|---|---|---|---|---|---|---|---|---|---|---|---|---|---|---|---|---|---|---|---|---|---|---|---|---|---|---|---|---|---|---|---|---|---|---|---|---|---|---|---|---|---|---|---|---|---|---|---|---|---|---|---|---|---|---|---|---|---|---|---|---|---|---|---|---|---|---|---|---|---|---|---|---|---|---|---|---|---|---|---|---|---|---|---|---|---|---|---|---|---|---|
|
||||||||||||||||||||||||||||||||||||||||||||||||||||||||||||||||||||||||||||||||||||||||||||||||||
| 2012 GAME BY GAME STATS | ||||||||||||||||||||||||||||||||||||||||||||||||||||||||||||||||||||||||||||||||||||||||||||||||||
 |
||||||||||||||||||||||||||||||||||||||||||||||||||||||||||||||||||||||||||||||||||||||||||||||||||
| 2011 INDIVIDUAL PLAYER STATS | |
|---|---|
| 2011 DRIVE CHARTS |
| 2011 STATISTICAL LEADERS |
|---|
| Player | Att | Yds | YPC | Long | TD | Player | Comp | Att | % | Yds | YPA | TD | INT | Rating | Player | Tar | Rec | Yds | YPC | Long | TD | ||
| Ahmad Bradshaw | 171 | 659 | 3.85 | 37 | 9 | Eli Manning | 358 | 588 | 60.9% | 4910 | 8.4 | 29 | 16 | 92.7 | Victor Cruz | 132 | 83 | 1545 | 18.6 | 99 | 9 | ||
| Brando Jacobs | 152 | 571 | 3.76 | 28 | 7 | Hakeem Nicks | 131 | 74 | 1160 | 15.7 | 68 | 7 | |||||||||||
| DJ Ware | 46 | 163 | 3.54 | 17 | 0 | Jake Ballard | 61 | 38 | 604 | 15.9 | 41 | 4 |
| 2011 GAME BY GAME STATS |
|---|
2011 RESULTS |
2010 RESULTS |
||||||||||||||||||||||||||||||||||||||||||||||||||||||||||||||||||||||||||||||||||||||||||||||||||||||||||||||||||||||||||||||||||||||||||||||||||||||||||||||||||||||||||||||||||||||||||||||||||||||||||||||||||||||||
|
|
| 2010 INDIVIDUAL PLAYER STATS |
|---|
| 2010 STATISTICAL LEADERS | ||||||||||||||||||||||||||||||||||||||||||||||||||||||||||||||||||||||||||||||||||||||||||||||||||
|---|---|---|---|---|---|---|---|---|---|---|---|---|---|---|---|---|---|---|---|---|---|---|---|---|---|---|---|---|---|---|---|---|---|---|---|---|---|---|---|---|---|---|---|---|---|---|---|---|---|---|---|---|---|---|---|---|---|---|---|---|---|---|---|---|---|---|---|---|---|---|---|---|---|---|---|---|---|---|---|---|---|---|---|---|---|---|---|---|---|---|---|---|---|---|---|---|---|---|
|
||||||||||||||||||||||||||||||||||||||||||||||||||||||||||||||||||||||||||||||||||||||||||||||||||
| 2010 GAME BY GAME STATS | ||||||||||||||||||||||||||||||||||||||||||||||||||||||||||||||||||||||||||||||||||||||||||||||||||
| 2009 GAME BY GAME STATS |
|---|
OTHER INFORMATION |
|
|
|