DUKE BLUE DEVILS
|
|
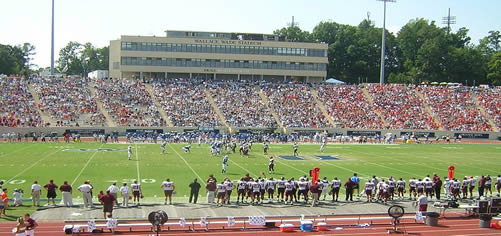
STADIUM: Wallace Wade Stadium PLAYING SURFACE: Grass • CAPACITY: 40,004 STARTERS RETURNING (O/D): 6*/7 |
|
QUICK FACTS: |
 |
|
| LOCATION:Durham, NC | ||
| FOUNDED: 1838 | ||
| ENROLLMENT: 6,849 | ||
| COLORS: Duke Blue & White | ||
| MASCOT: Blue Devil | ||
| CONFERENCE: ACC | ||
| Head Coach: Manny Diaz | ||
| Years with Team: 2nd | ||
| Overall Record: 30-19 | ||
| Record with Team: 9-4 | ||
| 2025 Individual Player Stats |
2025 Start Charts |
Last 40+ Years Results |
Last 20 Years - Leaders |
Draft History |
|---|
2025 STATISTICAL LEADERS
|

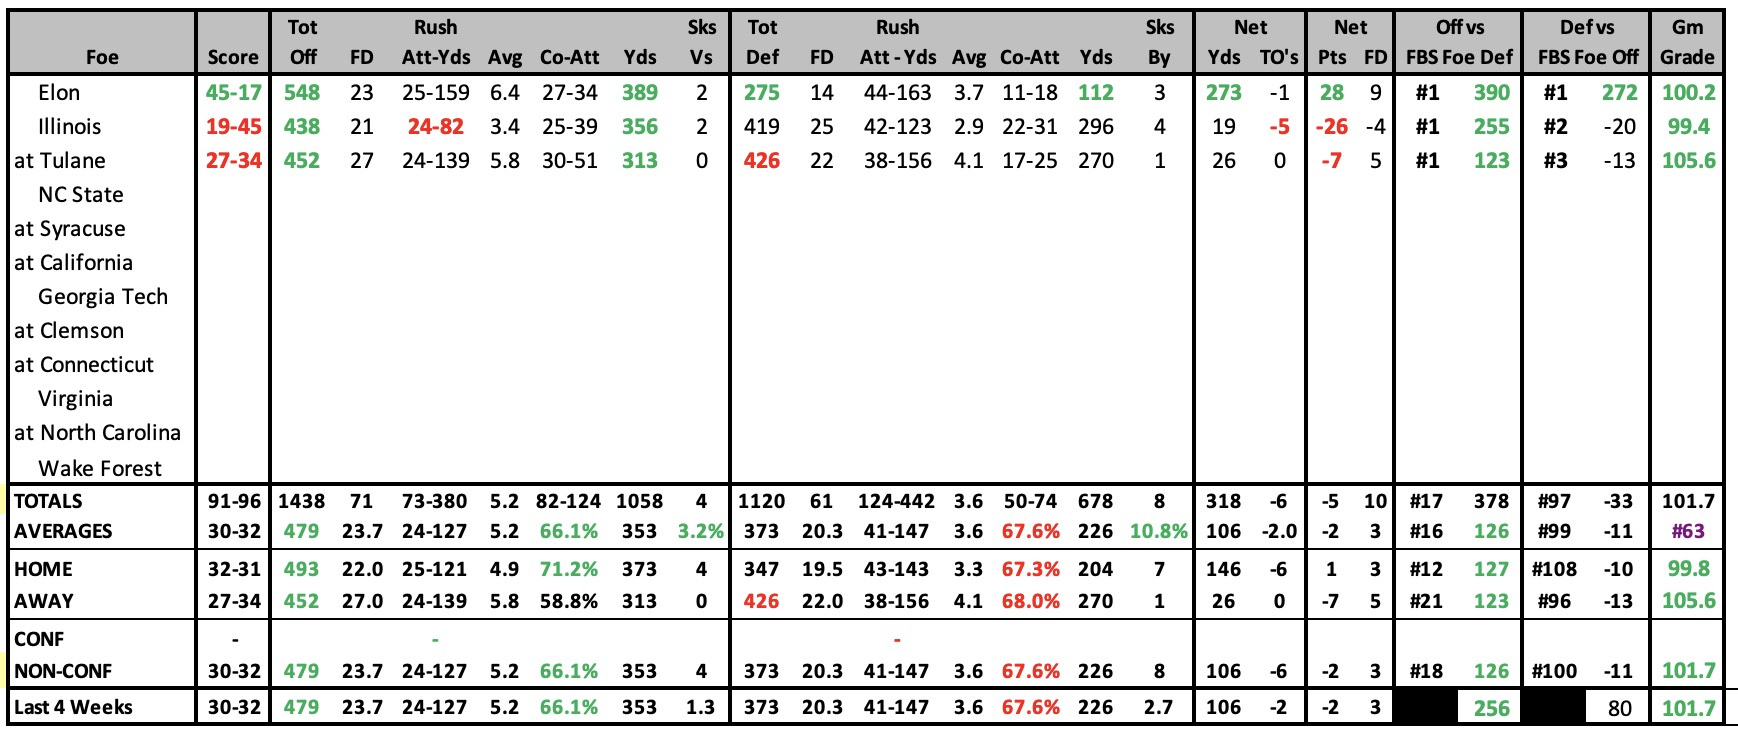
2025 GAME-BY-GAME STATS
|
 |
2025 SCHEDULE |
2024 RESULTS |
||||||||||||||||||||||||||||||||||||||||||||||||||||||||||||||||||||||||||||||||||||||||||||||||||||||||||||||||||||||||||||||||||||||||||||||||||||||||||||||||||||||||||||||||||||||||||||||||||||||||||||||||||||||||
|
|
||||||||||||||||||||||||||||||||||||||||||||||||||||||||||||||||||||||||||||||||||||||||||||||||||||||||||||||||||||||||||||||||||||||||||||||||||||||||||||||||||||||||||||||||||||||||||||||||||||||||||||||||||||||||
2024 STATISTICAL LEADERS
|

| 2024 Individual Player Stats |
2024 Start Charts |
|---|
2024 GAME-BY-GAME STATS
|
 |
2024 SCHEDULE |
2023 RESULTS |
||||||||||||||||||||||||||||||||||||||||||||||||||||||||||||||||||||||||||||||||||||||||||||||||||||||||||||||||||||||||||||||||||||||||||||||||||||||||||||||||||||||||||||||||||||||||||||||||||||||||||||
|
|
||||||||||||||||||||||||||||||||||||||||||||||||||||||||||||||||||||||||||||||||||||||||||||||||||||||||||||||||||||||||||||||||||||||||||||||||||||||||||||||||||||||||||||||||||||||||||||||||||||||||||||
2023 STATISTICAL LEADERS
|

| 2023 Individual Player Stats |
2023 Start Charts |
|---|
2023 GAME-BY-GAME STATS
|
 |
2023 SCHEDULE |
2022 RESULTS |
||||||||||||||||||||||||||||||||||||||||||||||||||||||||||||||||||||||||||||||||||||||||||||||||||||||||||||||||||||||||||||||||||||||||||||||||||||||||||||||||||||||||||||||||||||||||||||||||||||||
|
|
||||||||||||||||||||||||||||||||||||||||||||||||||||||||||||||||||||||||||||||||||||||||||||||||||||||||||||||||||||||||||||||||||||||||||||||||||||||||||||||||||||||||||||||||||||||||||||||||||||||
2022 STATISTICAL LEADERS
|

| 2022 Individual Player Stats |
2022 Start Charts |
|---|
2022 GAME-BY-GAME STATS
|
 |
2022 SCHEDULE |
2021 RESULTS |
||||||||||||||||||||||||||||||||||||||||||||||||||||||||||||||||||||||||||||||||||||||||||||||||||||||||||||||||||||||||||||||||||||||||||||||||||||||||||||||||||||||||||||||||||||||||||||||||
|
|
||||||||||||||||||||||||||||||||||||||||||||||||||||||||||||||||||||||||||||||||||||||||||||||||||||||||||||||||||||||||||||||||||||||||||||||||||||||||||||||||||||||||||||||||||||||||||||||||
2021 STATISTICAL LEADERS
|

| 2021 Individual Player Stats |
2021 Start Charts |
|---|
2021 GAME-BY-GAME STATS
|
 |
2021 SCHEDULE |
2020 RESULTS |
||||||||||||||||||||||||||||||||||||||||||||||||||||||||||||||||||||||||||||||||||||||||||||||||||||||||||||||||||||||||||||||||||||||||||||||||||||||||||||||||||||||||||||||||||||||||||
|
|
2020 STATISTICAL LEADERS
|

| 2020 Individual Player Stats |
2020 Start Charts |
|---|
2020 GAME-BY-GAME STATS
|
 |
2020 SCHEDULE |
2019 RESULTS |
||||||||||||||||||||||||||||||||||||||||||||||||||||||||||||||||||||||||||||||||||||||||||||||||||||||||||||||||||||||||||||||||||||||||||||||||||||||||||||||||||||||||||||||||||||||||||||||||
|
|
2019 STATISTICAL LEADERS
|

| 2019 Individual Player Stats |
2019 Start Charts |
|---|
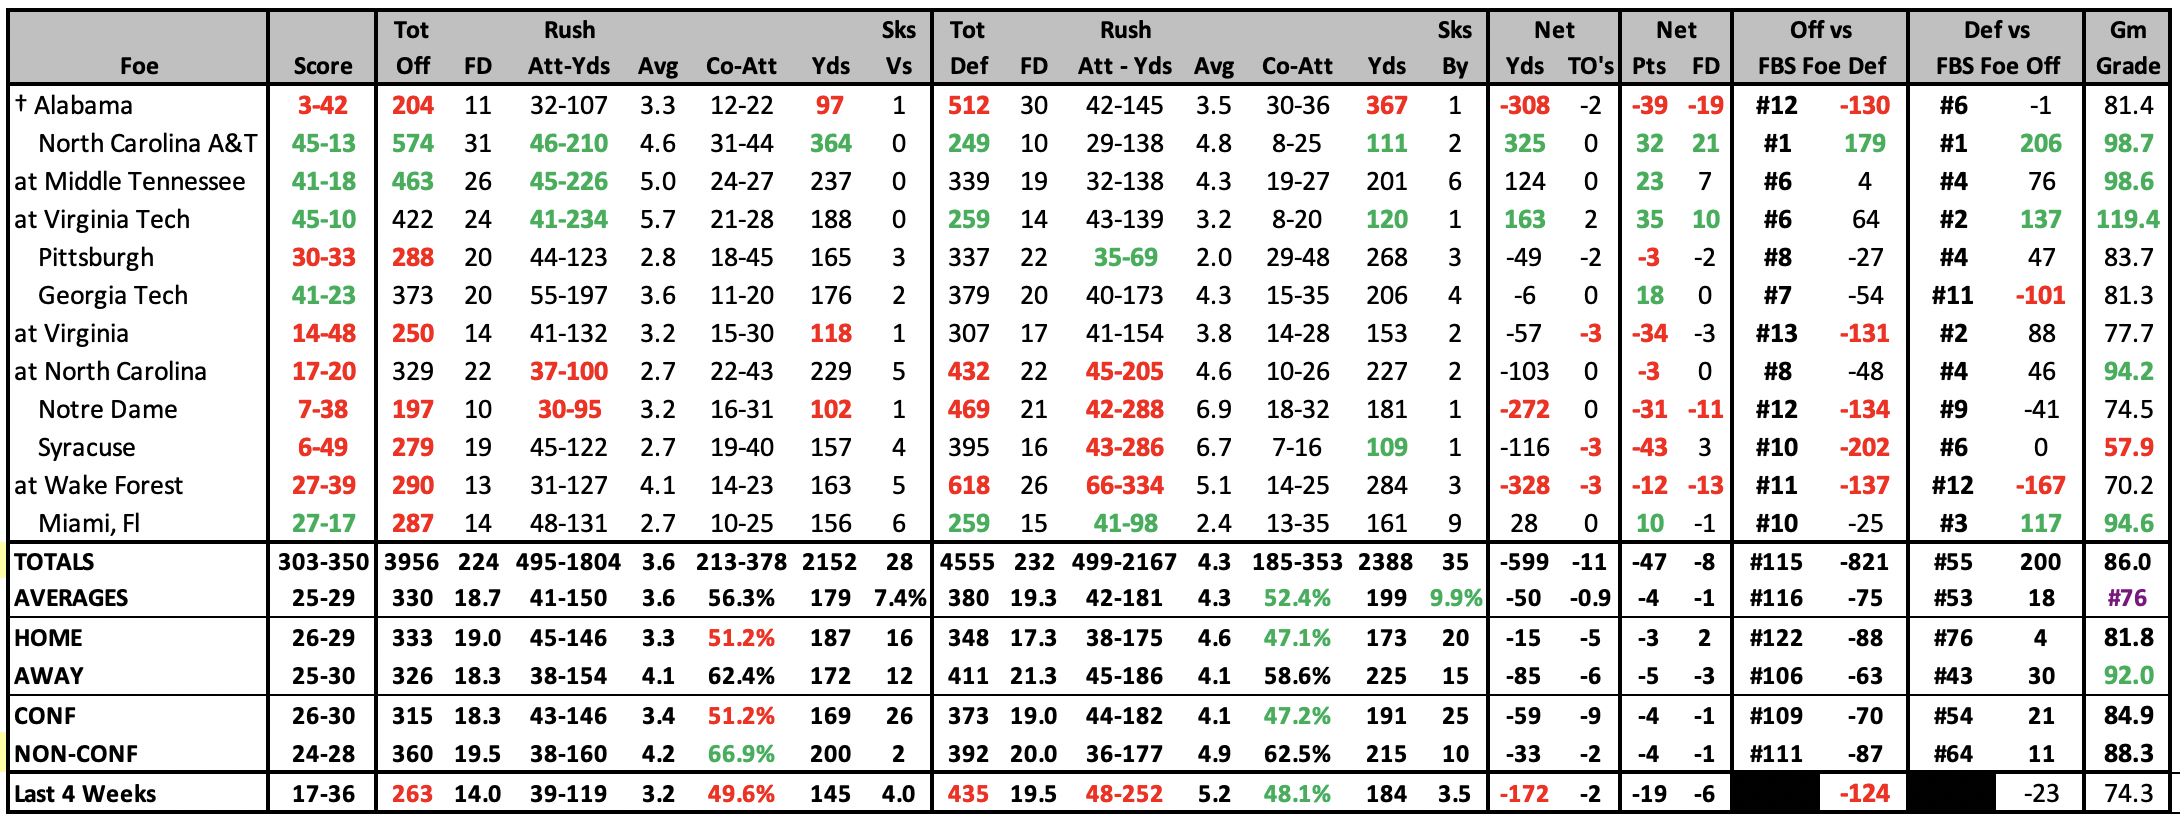
2019 GAME-BY-GAME STATS
|
 |
2019 SCHEDULE |
2018 RESULTS |
||||||||||||||||||||||||||||||||||||||||||||||||||||||||||||||||||||||||||||||||||||||||||||||||||||||||||||||||||||||||||||||||||||||||||||||||||||||||||||||||||||||||||||||||||||||||||||||||||||||||||||||||
|
|
||||||||||||||||||||||||||||||||||||||||||||||||||||||||||||||||||||||||||||||||||||||||||||||||||||||||||||||||||||||||||||||||||||||||||||||||||||||||||||||||||||||||||||||||||||||||||||||||||||||||||||||||
2018 STATISTICAL LEADERS
|

| 2018 Individual Player Stats |
2018 Start Charts |
|---|
2018 GAME-BY-GAME STATS
|
 |
2018 SCHEDULE |
2017 RESULTS |
|||||||||||||||||||||||||||||||||||||||||||||||||||||||||||||||||||||||||||||||||||||||||||||||||||||||||||||||||||||||||||||||||||||||||||||||||||||||||||||||||||||||||||||||||||||||||||||||||||||||||||||||||||||||||||||||||||||||
|
|
|||||||||||||||||||||||||||||||||||||||||||||||||||||||||||||||||||||||||||||||||||||||||||||||||||||||||||||||||||||||||||||||||||||||||||||||||||||||||||||||||||||||||||||||||||||||||||||||||||||||||||||||||||||||||||||||||||||||
2017 STATISTICAL LEADERS
|

| 2017 Individual Player Stats |
2017 Start Charts |
|---|
2017 GAME-BY-GAME STATS
|
 |
2017 SCHEDULE |
2016 RESULTS |
|||||||||||||||||||||||||||||||||||||||||||||||||||||||||||||||||||||||||||||||||||||||||||||||||||||||||||||||||||||||||||||||||||||||||||||||||||||||||||||||||||||||||||||||||||||||||||||||||||||||||||||||||||||||||||||||||||||||
|
|
|||||||||||||||||||||||||||||||||||||||||||||||||||||||||||||||||||||||||||||||||||||||||||||||||||||||||||||||||||||||||||||||||||||||||||||||||||||||||||||||||||||||||||||||||||||||||||||||||||||||||||||||||||||||||||||||||||||||
2016 STATISTICAL LEADERS
|

| 2016 Individual Player Stats |
2016 Start Charts |
|---|
2016 GAME-BY-GAME STATS
|
 |
2015 STATISTICAL LEADERS
|

| 2015 Individual Player Stats |
2015 Start Charts |
|---|
2015 GAME-BY-GAME STATS
|
 |
2015 SCHEDULE |
2014 RESULTS |
|||||||||||||||||||||||||||||||||||||||||||||||||||||||||||||||||||||||||||||||||||||||||||||||||||||||||||||||||||||||||||||||||||||||||||||||||||||||||||||||||||||||||||||||||||||||||||||||||||||||||||||||||||||||||||||||||||||||||||||||
|
|
|||||||||||||||||||||||||||||||||||||||||||||||||||||||||||||||||||||||||||||||||||||||||||||||||||||||||||||||||||||||||||||||||||||||||||||||||||||||||||||||||||||||||||||||||||||||||||||||||||||||||||||||||||||||||||||||||||||||||||||||
2014 STATISTICAL LEADERS
|

| 2014 Individual Player Stats |
2014 Start Charts |
|---|
2014 GAME-BY-GAME STATS
|
 |
2013 STATISTICAL LEADERS
|
| Player | Att | Yds | YPC | TD | Player | Comp | Att | % | Yds | YPA | TD | INT | Rating | Player | Rec | Yds | YPC | TD |
| Josh Snead | 107 | 651 | 6.1 | 2 | Anthony Boone | 206 | 322 | 64.0% | 2260 | 7.0 | 13 | 13 | 128.2 | Jamison Crowder | 108 | 1360 | 12.6 | 8 |
| Jela Duncan | 113 | 562 | 5.0 | 3 | Brandon Connette | 90 | 145 | 62.1% | 1212 | 8.4 | 13 | 6 | 153.6 | Braxton Deaver | 46 | 600 | 13.0 | 4 |
| Juwan Thompson | 64 | 348 | 5.4 | 1 | Will Monday | 2 | 2 | 100.0% | 2 | 1.0 | 0 | 0 | 108.4 | Brandon Braxton | 39 | 361 | 9.3 | 2 |
| 2013 Individual Player Stats |
2013 Start Chart/ Starters Lost |
|---|
2013 GAME-BY-GAME STATS
|
 |
2013 RESULTS |
2012 RESULTS |
||||||||||||||||||||||||||||||||||||||||||||||||||||||||||||||||||||||||||||||||||||||||||||||||||||||||||||||||||||||||||||||||||||||||||||||||||||||||||||||||||||||||||||||||||||||||||||||||||||||||||||||||||||||||||||||||||||||||||||||||||||||||||||||||||||||||||||||||||||||||||||
|
|
||||||||||||||||||||||||||||||||||||||||||||||||||||||||||||||||||||||||||||||||||||||||||||||||||||||||||||||||||||||||||||||||||||||||||||||||||||||||||||||||||||||||||||||||||||||||||||||||||||||||||||||||||||||||||||||||||||||||||||||||||||||||||||||||||||||||||||||||||||||||||||
2012 STATISTICAL LEADERS
|
| Player | Att | Yds | YPC | TD | Player | Comp | Att | % | Yds | YPA | TD | INT | Rating | Player | Rec | Yds | YPC | TD | ||
| Jela Duncan | 110 | 560 | 5.1 | 4 | Sean Renfree | 297 | 442 | 67.2% | 3111 | 7.0 | 19 | 10 | 136.0 | Conner Vernon | 85 | 1074 | 12.6 | 8 | ||
| Josh Snead | 99 | 496 | 5.0 | 2 | Anthony Boone | 49 | 94 | 52.1% | 531 | 5.6 | 5 | 2 | 112.9 | Jamison Crowder | 76 | 1073 | 14.1 | 8 | ||
| Juwan Thompson | 75 | 353 | 4.7 | 1 | Brandon Connette | 5 | 13 | 38.5% | 38 | 2.9 | 3 | 0 | 139.2 | Desmond Scott | 66 | 666 | 10.1 | 2 |
2012 GAME-BY-GAME STATS
|
 |
2011 STATISTICAL LEADERS
|
| Player | Att | Yds | YPC | TD | Player | Comp | Att | % | Yds | YPA | TD | INT | Rating | Player | Rec | Yds | YPC | TD | ||
| Juwan Thompson | 110 | 457 | 4.2 | 7 | Sean Renfree | 282 | 434 | 65.0% | 2891 | 6.7 | 14 | 11 | 126.5 | Conner Vernon | 70 | 956 | 13.7 | 6 | ||
| Desmond Scott | 71 | 367 | 5.2 | 2 | Anthony Boone | 30 | 53 | 56.6% | 298 | 5.6 | 1 | 1 | 106.3 | Donovan Varner | 61 | 713 | 11.7 | 3 | ||
| Antony Boone | 44 | 129 | 2.9 | 4 | Brandon Connette | 1 | 2 | 50.0% | 35 | 17.5 | 0 | 0 | 197.0 | Cooper Helfet | 43 | 395 | 9.2 | 4 |
| 2011 Individual Player Stats •2011 Starters/Starts Lost |
|---|
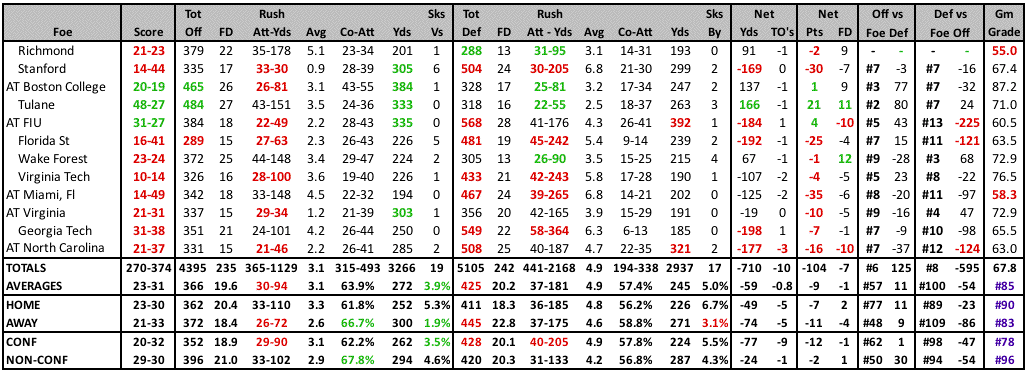
2011 GAME-BY-GAME STATS
|
2011 RESULTS |
2010 RESULTS |
||||||||||||||||||||||||||||||||||||||||||||||||||||||||||||||||||||||||||||||||||||||||||||||||||||||||||||||||||||||||||||||||||||||||||||||||||||||||||||||||||||||||||||||||||||||
|
|
||||||||||||||||||||||||||||||||||||||||||||||||||||||||||||||||||||||||||||||||||||||||||||||||||||||||||||||||||||||||||||||||||||||||||||||||||||||||||||||||||||||||||||||||||||||
2010 STATISTICAL LEADERS
|
| Player | Att | Yds | YPC | TD | Player | Comp | Att | % | Yds | YPA | TD | INT | Rating | Player | Rec | Yds | YPC | TD | ||
| Desmond Scott | 120 | 530 | 4.42 | 3 | Sean Renfree | 285 | 464 | 61.4% | 3131 | 6.7 | 14 | 17 | 120.7 | Conner Vernon | 73 | 973 | 13.3 | 4 | ||
| Brandon Connette | 78 | 321 | 4.12 | 8 | Brandon Connette | 10 | 22 | 45.5% | 125 | 5.7 | 0 | 2 | 75.0 | Donovan Varner | 60 | 736 | 12.3 | 1 | ||
| Josh Snead | 45 | 221 | 4.91 | 1 | Alex King | 0 | 1 | 0.0% | 0 | 0.0 | 0 | 0 | 0.0 | Austin Kelly | 47 | 486 | 10.3 | 4 |
| 2010 Individual Player Stats |
|---|
2010 GAME-BY-GAME STATS
|
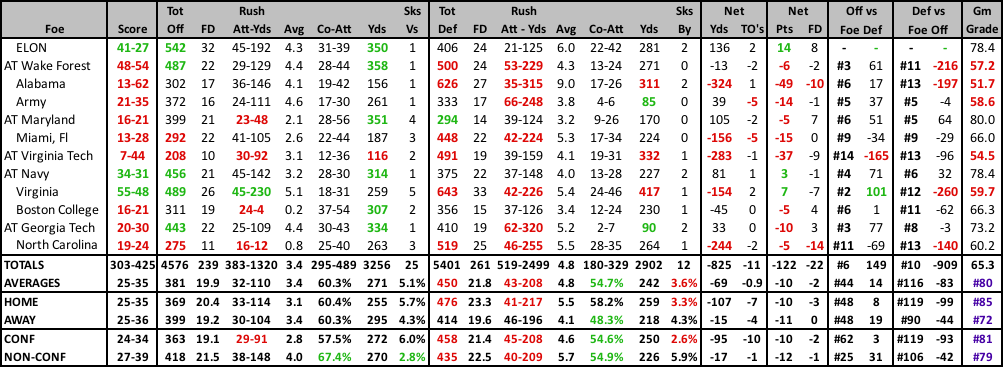
2009 STATISTICAL LEADERS
|
| Player | Att | Yds | YPC | TD | Player | Comp | Att | % | Yds | YPA | TD | INT | Rating | Player | Rec | Yds | YPC | TD | ||
| Desmond Scott | 70 | 262 | 3.74 | 1 | Thaddeus Lewis | 274 | 449 | 61.0% | 3330 | 7.4 | 20 | 8 | 134.5 | Donovan Varner | 65 | 1047 | 16.1 | 8 | ||
| Jay Hollingsworth | 54 | 179 | 3.31 | 0 | Sean Renfree | 34 | 50 | 68.0% | 330 | 6.6 | 4 | 2 | 141.8 | Conner Vernon | 55 | 746 | 13.6 | 3 | ||
| Patrick Kurunwune | 34 | 149 | 4.38 | 1 | Austin Kelly | 0 | 1 | 0.0% | 0 | 0.0 | 0 | 0 | 0.0 | Austin Kelly | 54 | 625 | 11.6 | 4 |
| 2009 Individual Player Stats |
|---|
2009 GAME-BY-GAME STATS
|
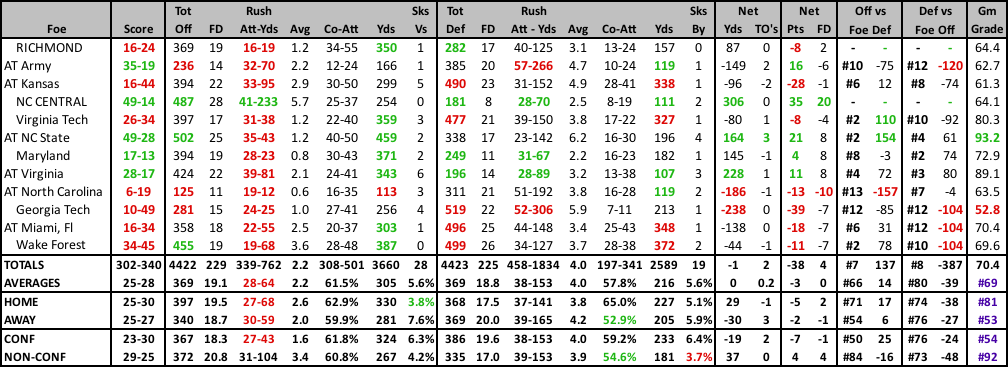
2009 RESULTS
|
2008 RESULTS |
|
|
|||||||||||||||||||||||||||||||||||||||||||||||||||||||||||||||||||||||||||||||||||||||||||||||||||||||||||||||||||||||||||||||||||||||||||||
| 2008 Individual Player Stats • 2007 Individual Player Stats |
|---|

