
| SMU MUSTANGS |
|---|
|
STADIUM: Gerald J Ford Stadium PLAYING SURFACE: FieldTurf • CAPACITY: 32,000 STARTERS RETURNING (O/D): 8/8 LETTERMAN RETURNING: 40 (21,16,3) • LETTERMAN LOST: 24 (12,12,0) |
 |
|
| LOCATION: Dallas, Texas | |
| FOUNDED: 1911 | |
| ENROLLMENT: 6,479 | |
| COLORS: Red & Blue | |
| MASCOT: Peruna | |
| CONF: AAC | |
HEAD COACH: |
|
| YEARS WITH TM: 2nd | |
| OVERALL REC: 7-6 | |
| RECORD W/TM: 7-6 |
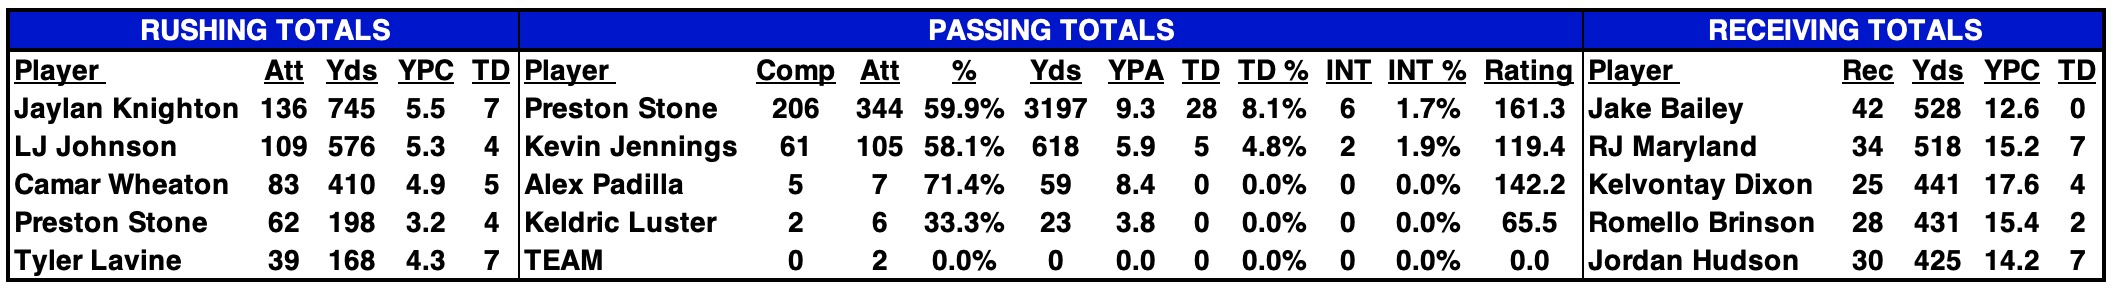
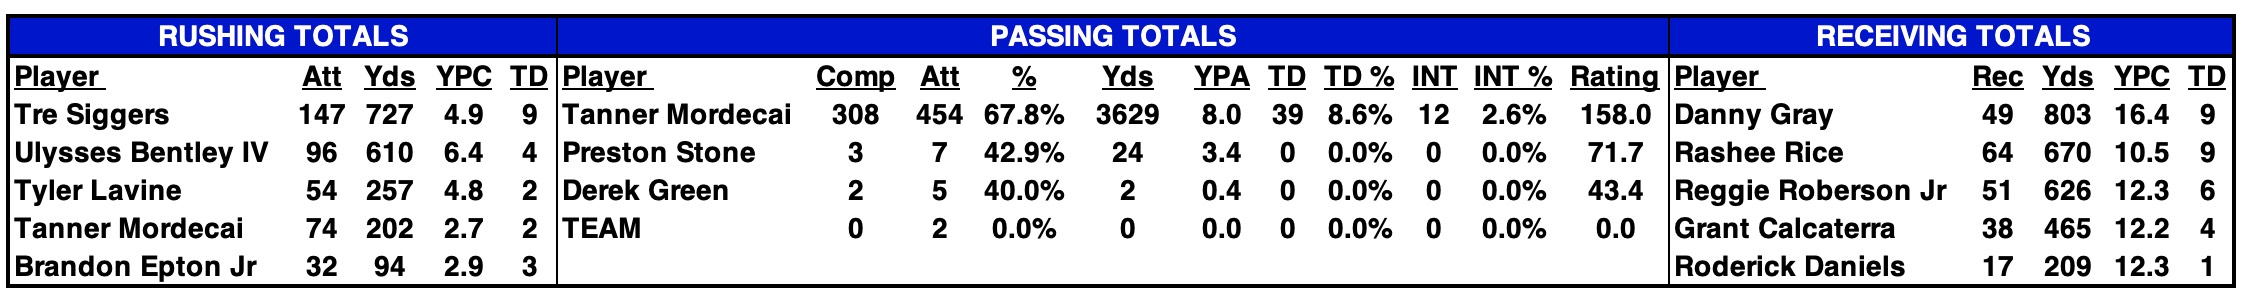
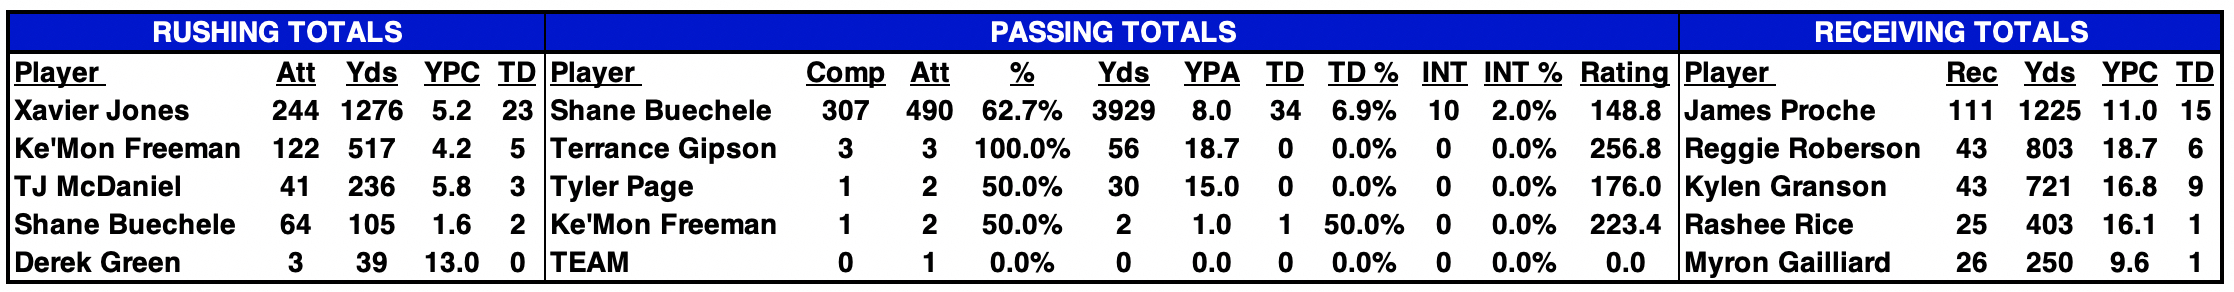
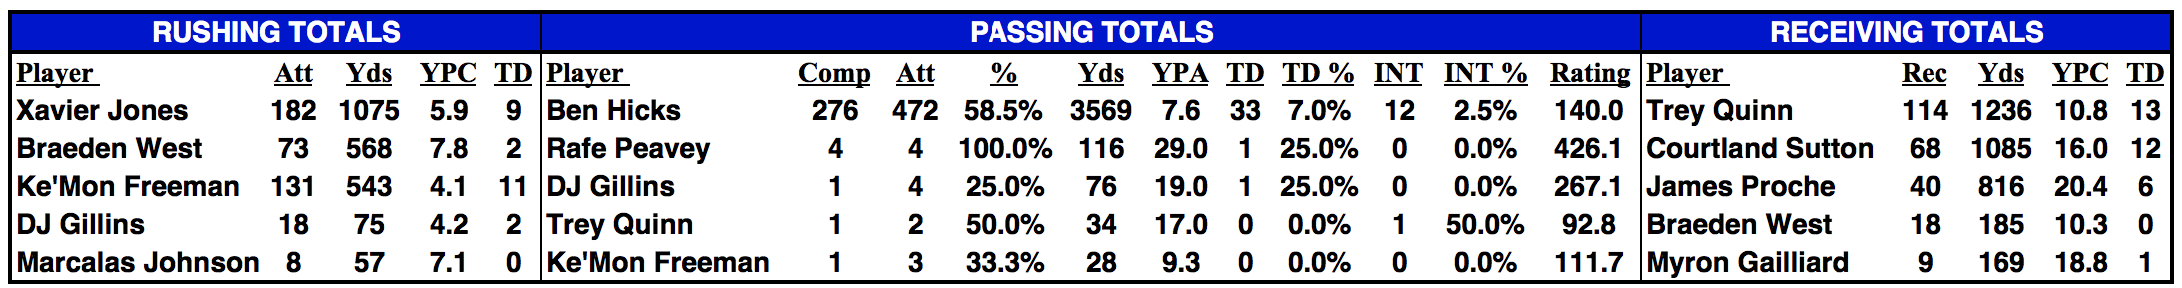
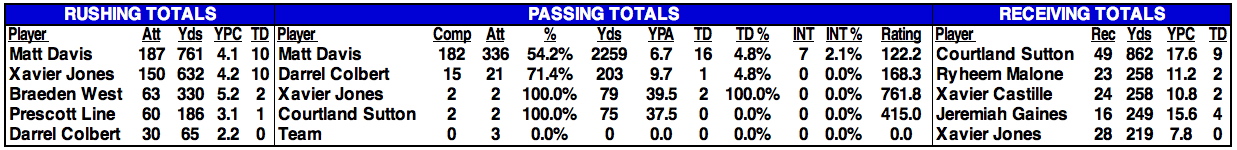
| 2023 STATISTICAL LEADERS |
|---|
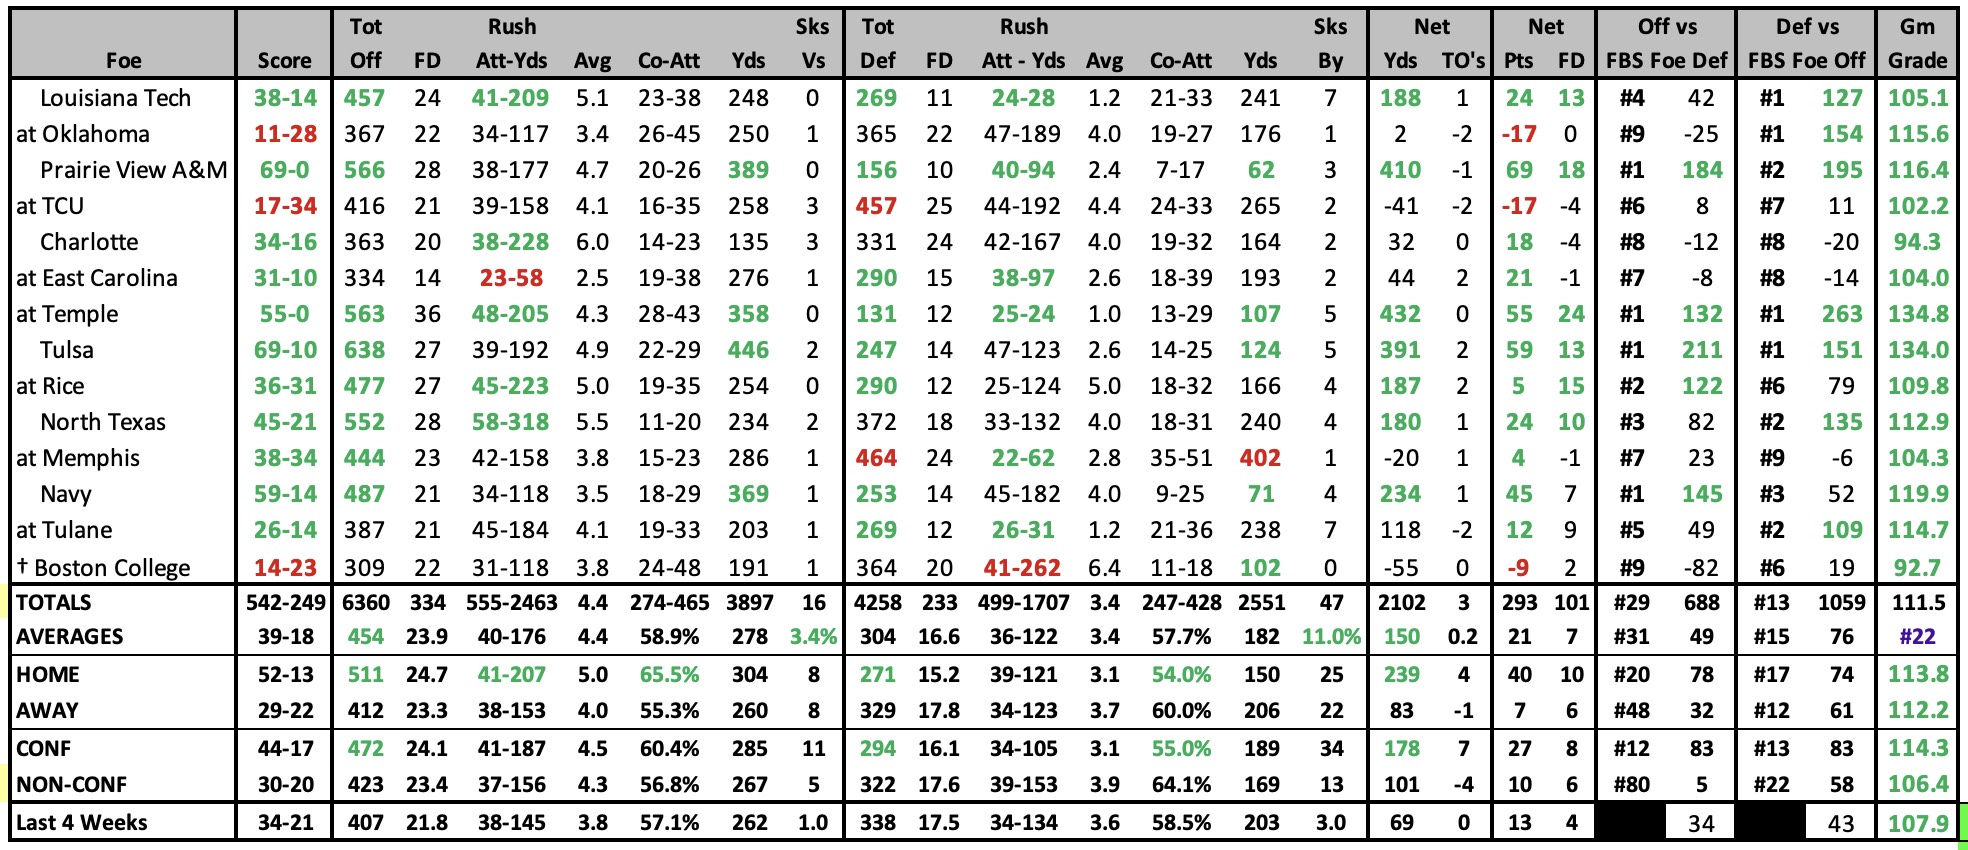
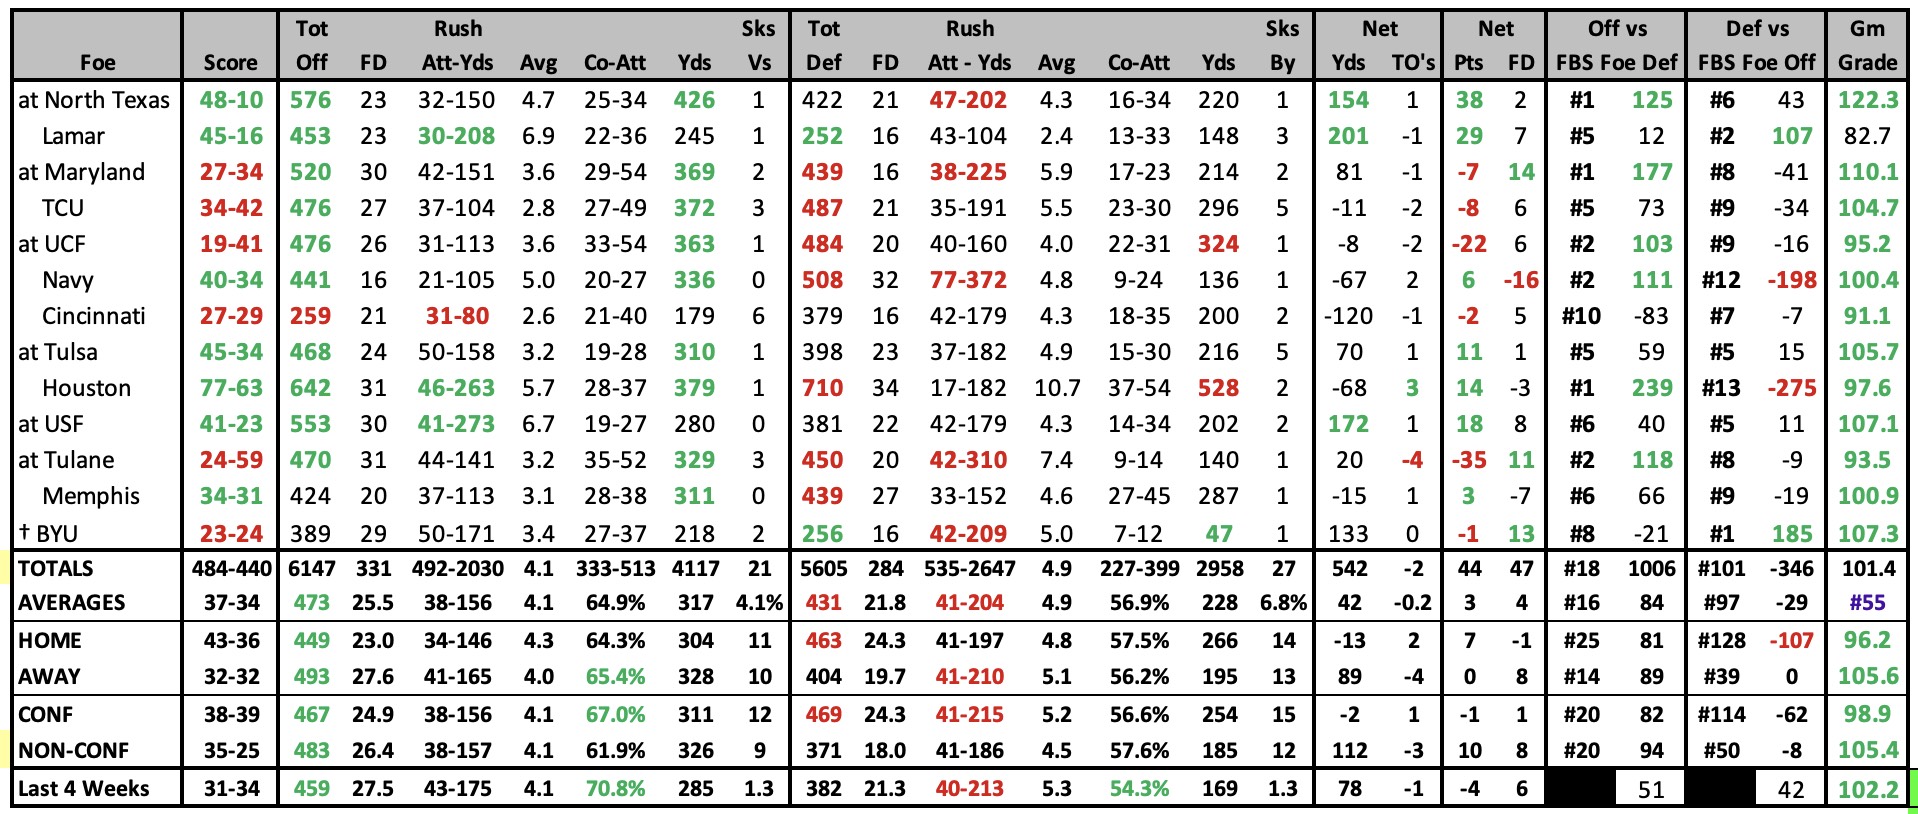
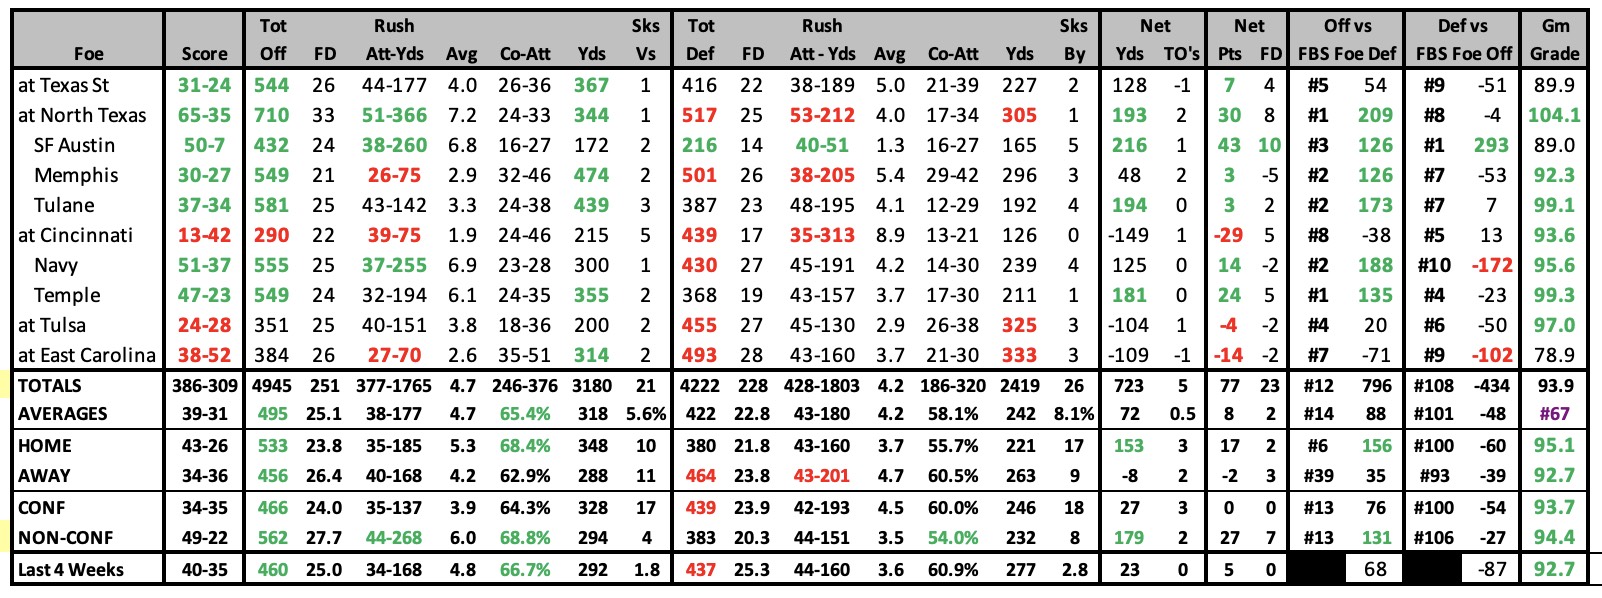
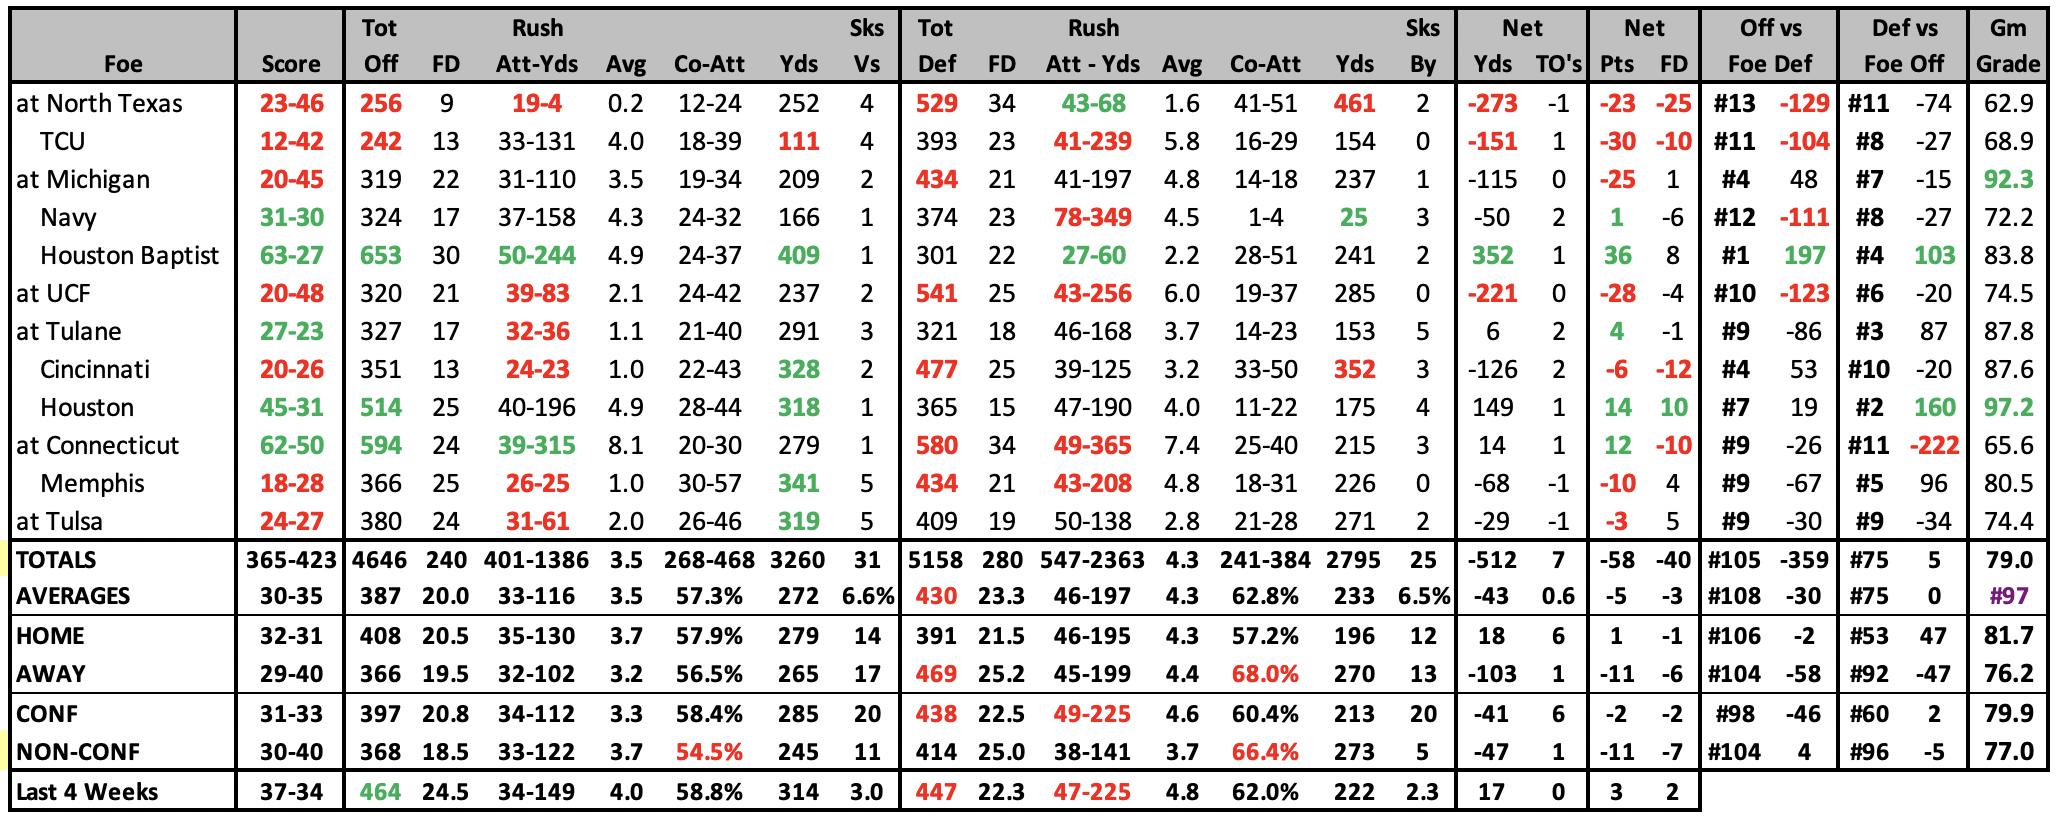
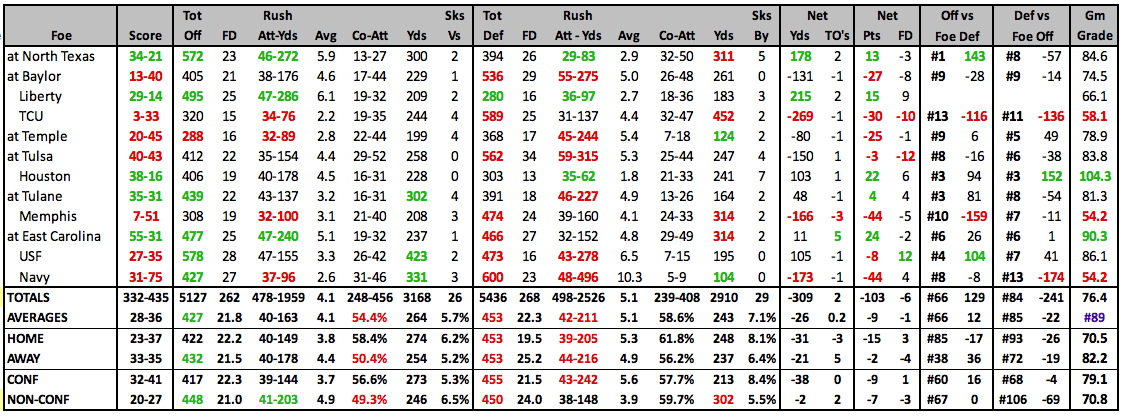
| 2023 GAME-BY-GAME STATS |
|---|
 |
2023 SCHEDULE |
2022 RESULTS |
||||||||||||||||||||||||||||||||||||||||||||||||||||||||||||||||||||||||||||||||||||||||||||||||||||||||||||||||||||||||||||||||||||||||||||||||||||||||||||||||||||||||||||||||||||||||||||||||||||||||||||||||||
|
|
||||||||||||||||||||||||||||||||||||||||||||||||||||||||||||||||||||||||||||||||||||||||||||||||||||||||||||||||||||||||||||||||||||||||||||||||||||||||||||||||||||||||||||||||||||||||||||||||||||||||||||||||||
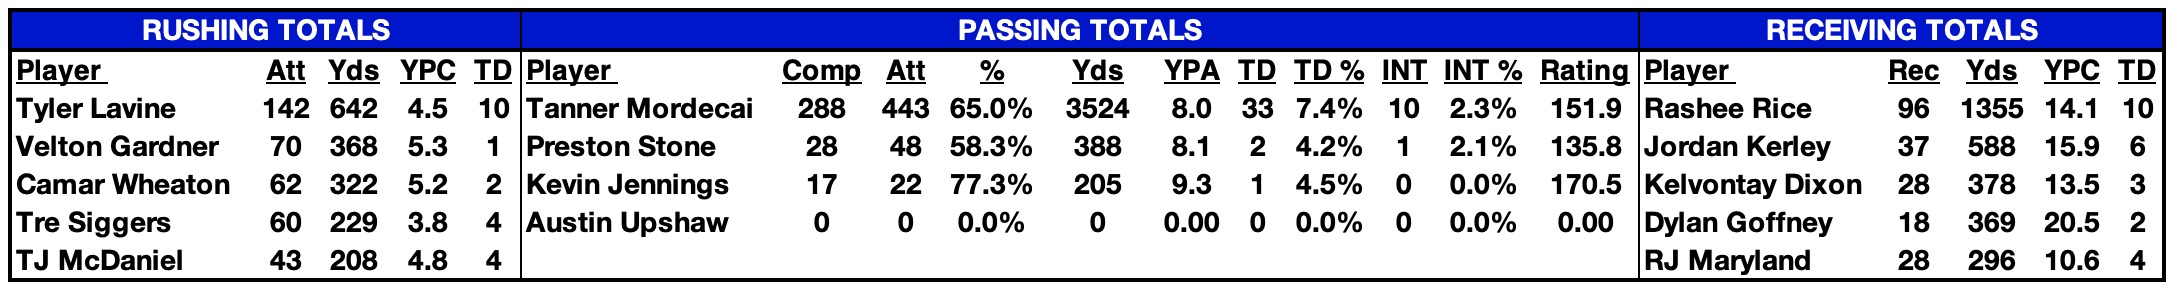
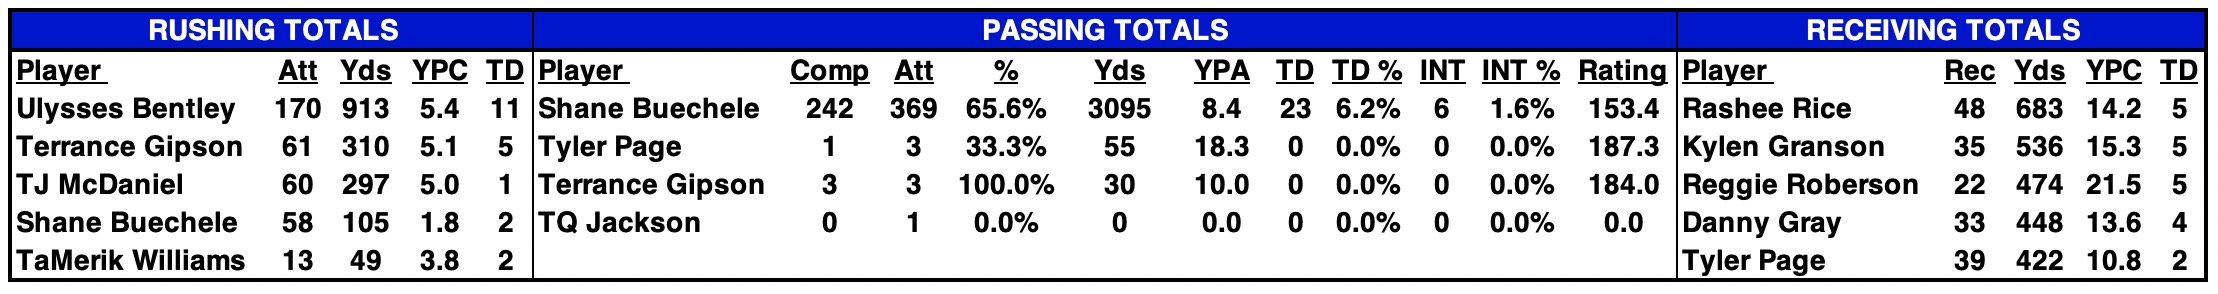
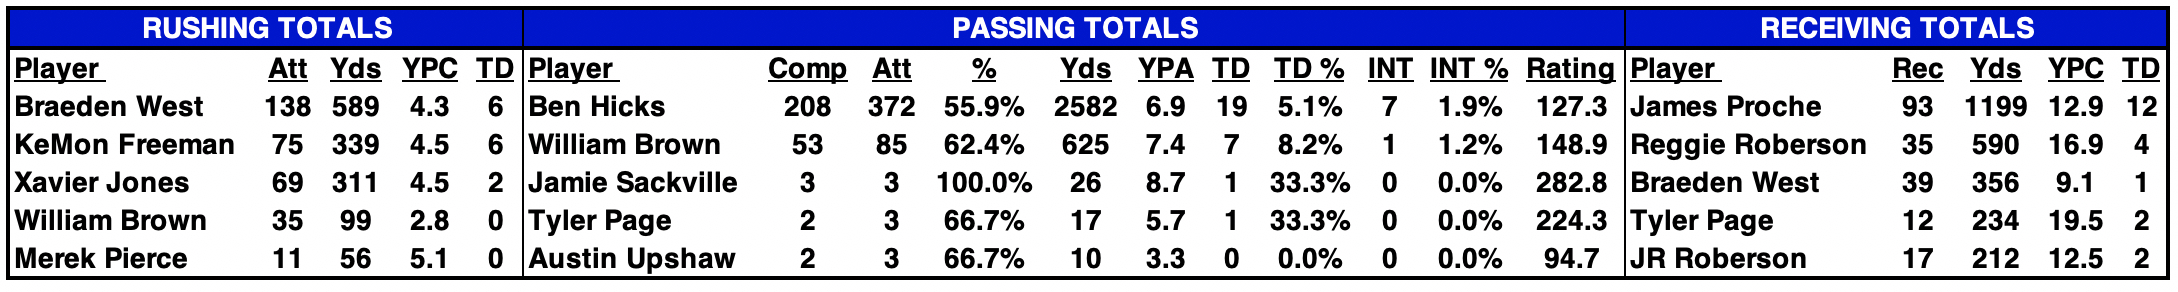
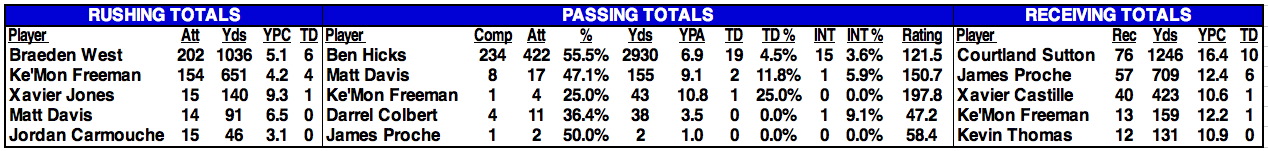
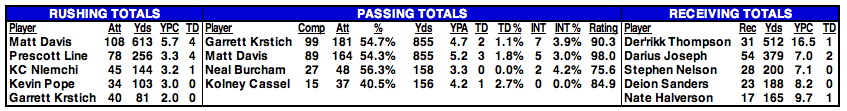
| 2022 STATISTICAL LEADERS |
|---|
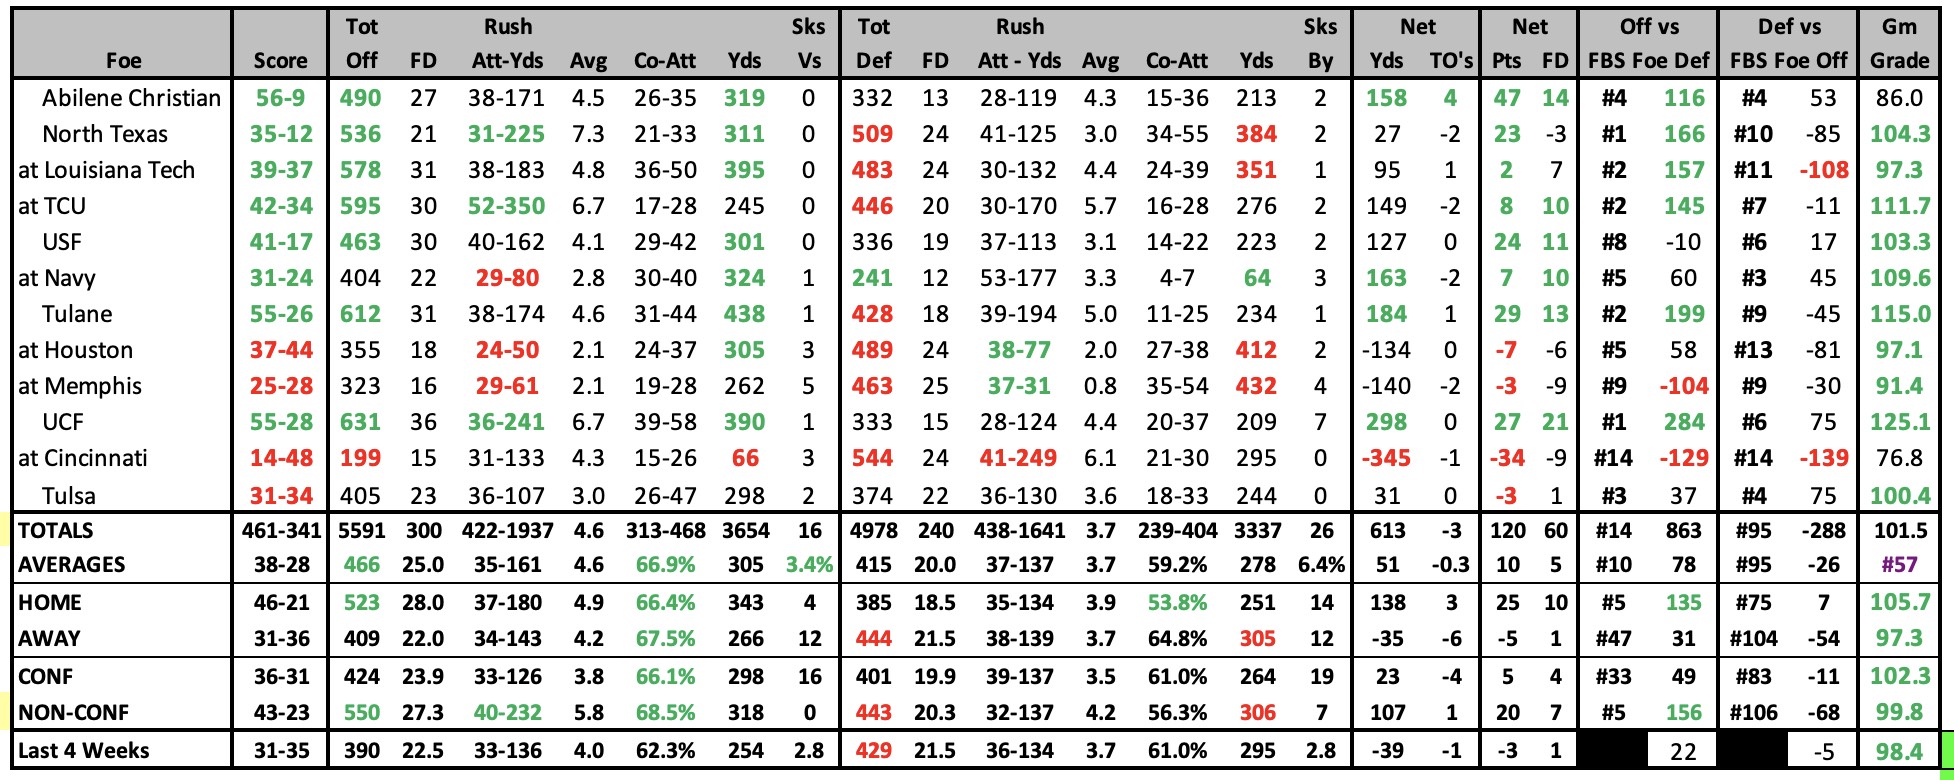
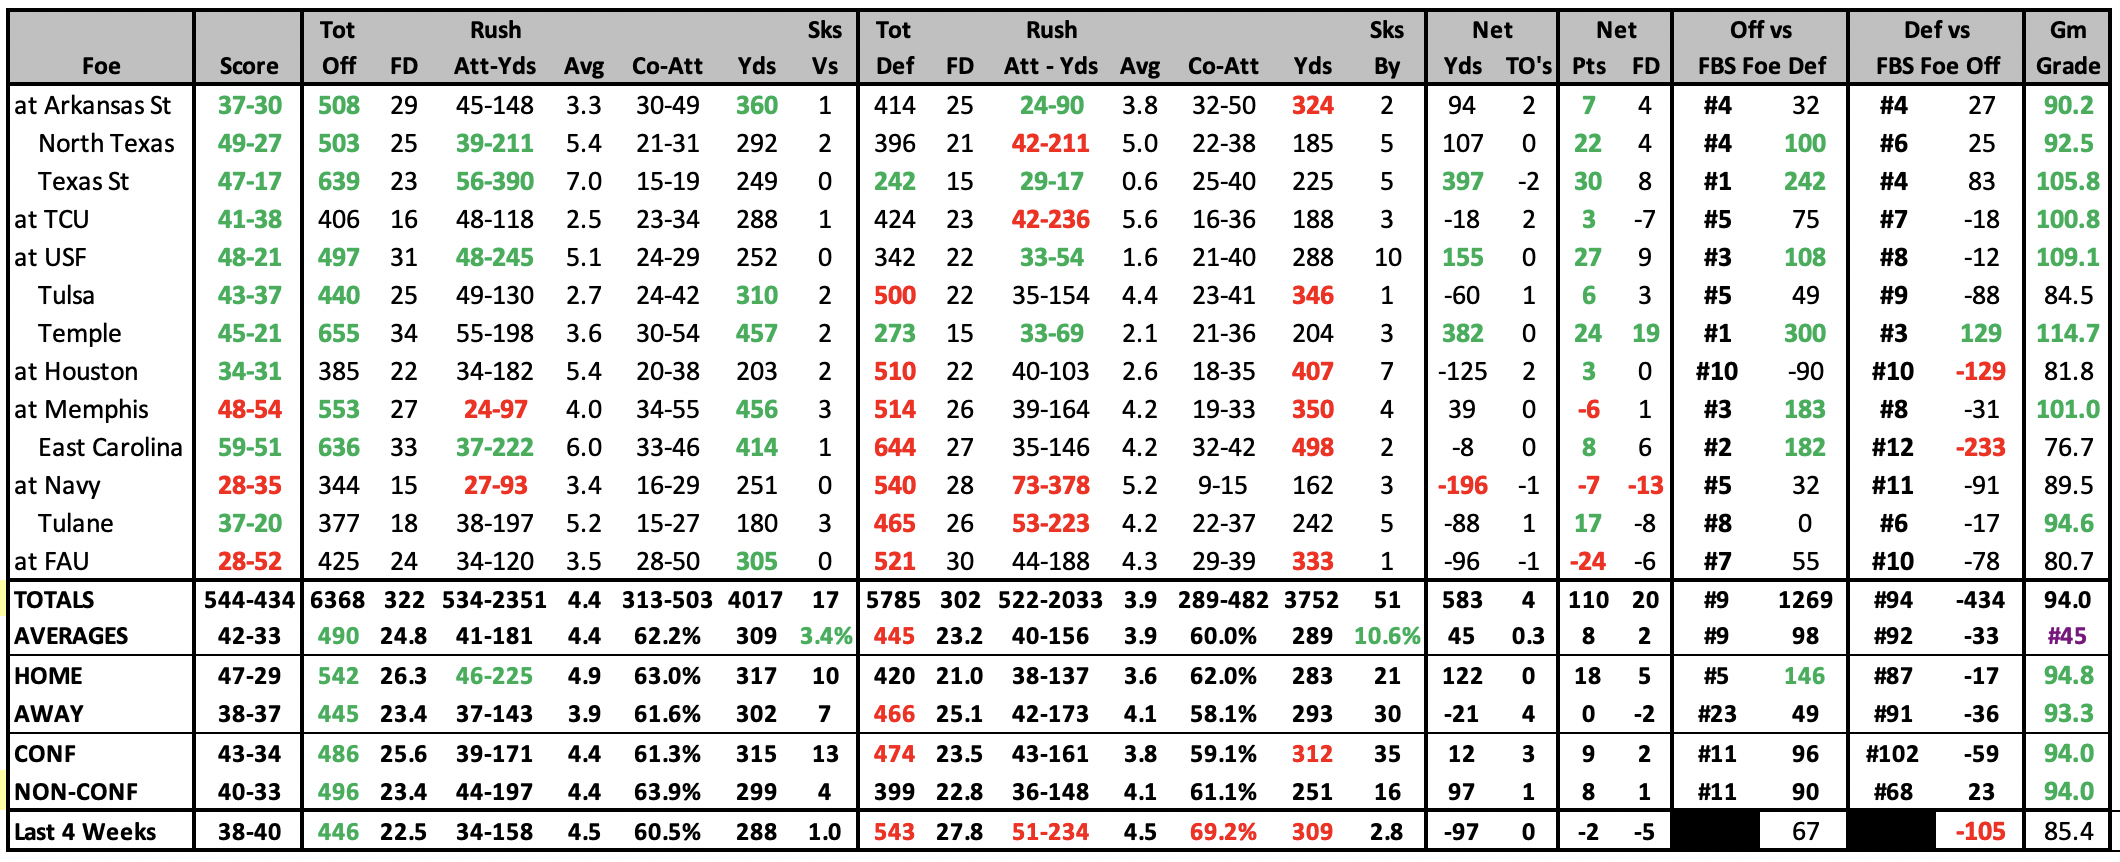
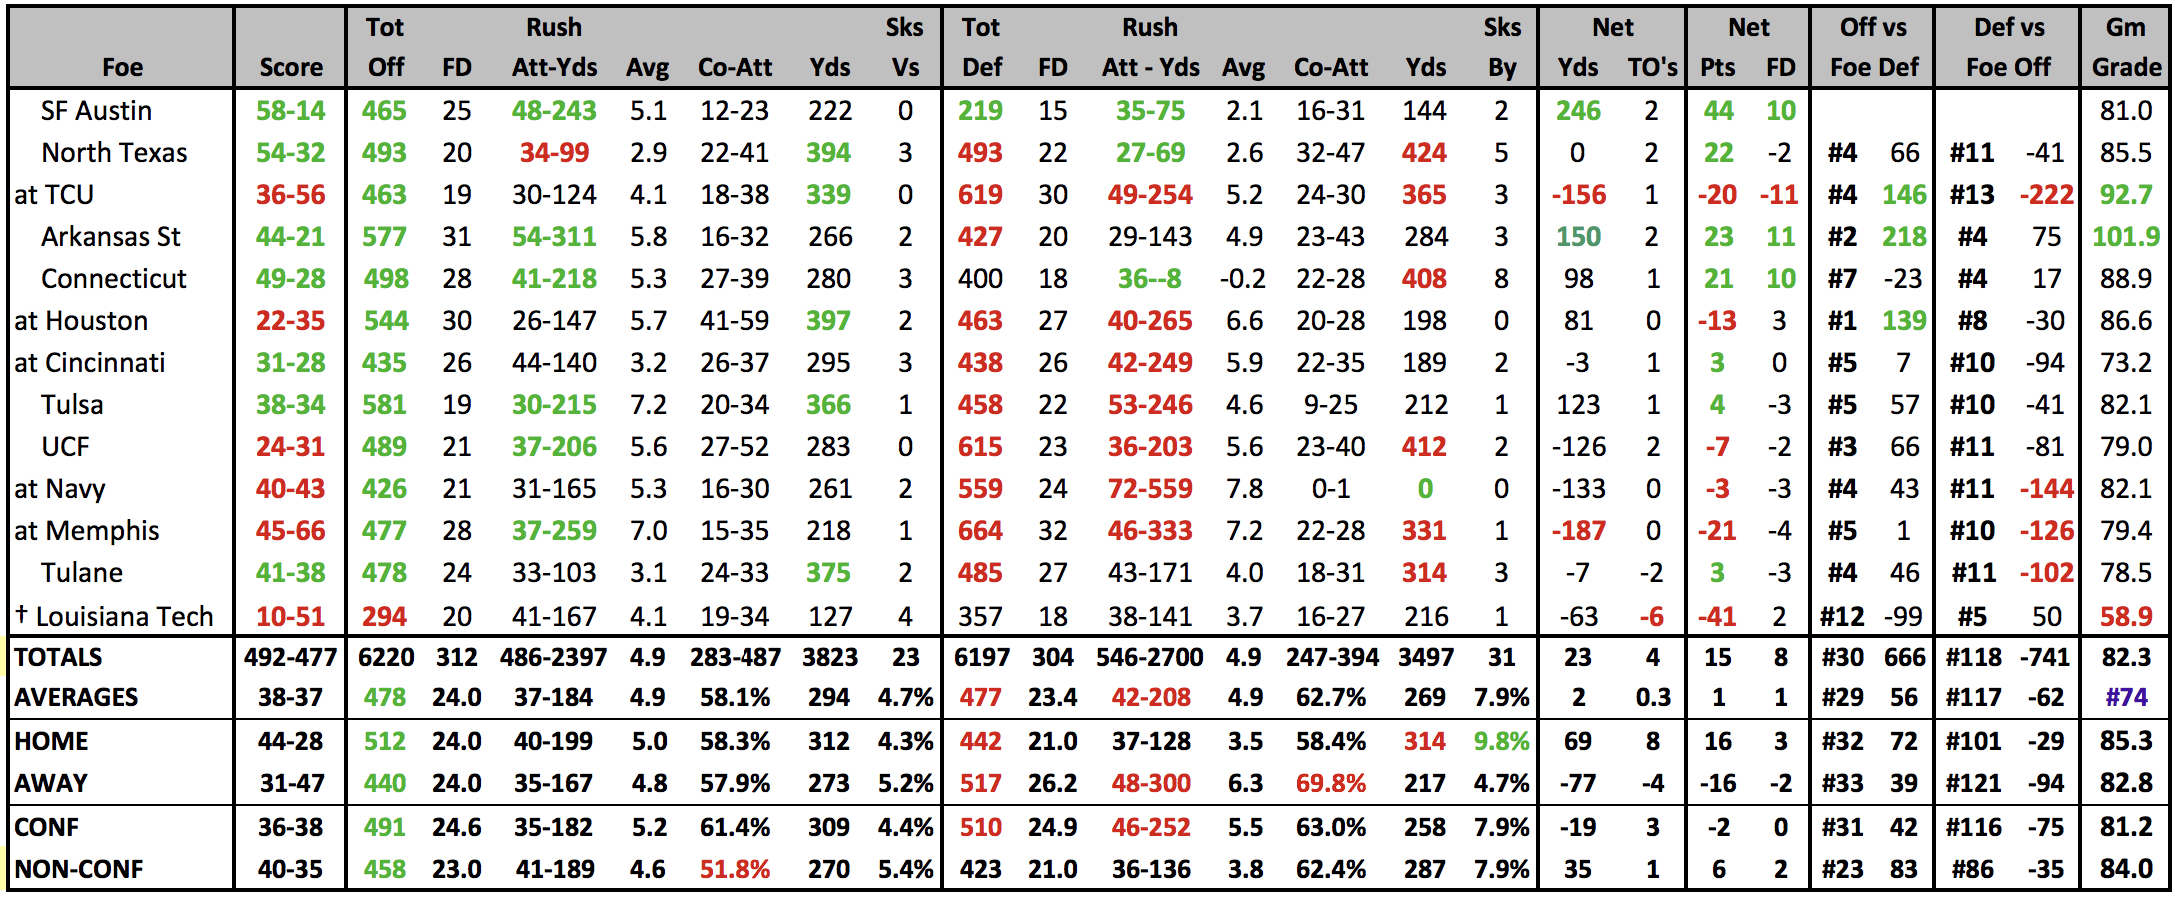
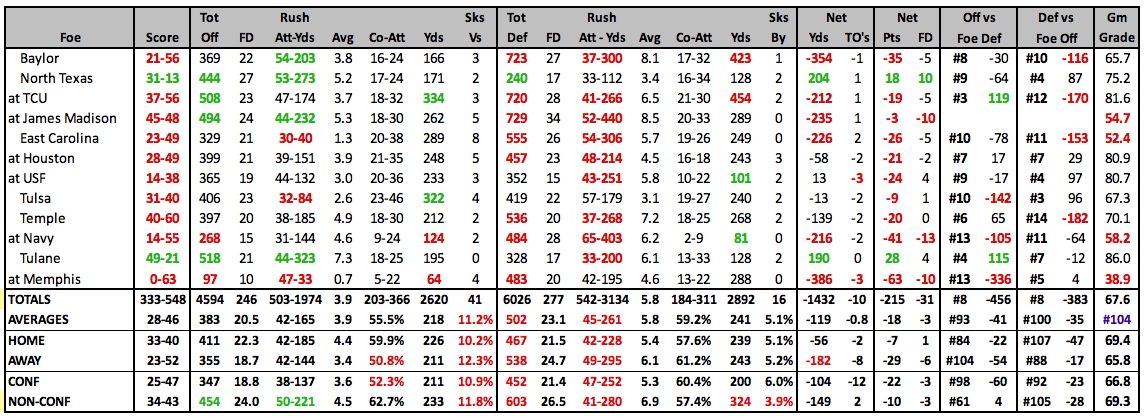
| 2022 GAME-BY-GAME STATS |
|---|
 |
2022 SCHEDULE |
2021 RESULTS |
||||||||||||||||||||||||||||||||||||||||||||||||||||||||||||||||||||||||||||||||||||||||||||||||||||||||||||||||||||||||||||||||||||||||||||||||||||||||||||||||||||||||||||||||||||||||||||||||||||||
|
|
||||||||||||||||||||||||||||||||||||||||||||||||||||||||||||||||||||||||||||||||||||||||||||||||||||||||||||||||||||||||||||||||||||||||||||||||||||||||||||||||||||||||||||||||||||||||||||||||||||||
| 2021 STATISTICAL LEADERS |
|---|
| 2021 GAME-BY-GAME STATS |
|---|
 |
2021 SCHEDULE |
2020 RESULTS |
||||||||||||||||||||||||||||||||||||||||||||||||||||||||||||||||||||||||||||||||||||||||||||||||||||||||||||||||||||||||||||||||||||||||||||||||||||||||||||||||||||||||||||||||||||||||||||||||
|
|
||||||||||||||||||||||||||||||||||||||||||||||||||||||||||||||||||||||||||||||||||||||||||||||||||||||||||||||||||||||||||||||||||||||||||||||||||||||||||||||||||||||||||||||||||||||||||||||||
| 2020 STATISTICAL LEADERS |
|---|
| 2020 GAME-BY-GAME STATS |
|---|
 |
2020 SCHEDULE |
2019 RESULTS |
||||||||||||||||||||||||||||||||||||||||||||||||||||||||||||||||||||||||||||||||||||||||||||||||||||||||||||||||||||||||||||||||||||||||||||||||||||||||||||||||||||||||||||||||||||||||||||||||||||||||||||
|
|
||||||||||||||||||||||||||||||||||||||||||||||||||||||||||||||||||||||||||||||||||||||||||||||||||||||||||||||||||||||||||||||||||||||||||||||||||||||||||||||||||||||||||||||||||||||||||||||||||||||||||||
| 2019 STATISTICAL LEADERS |
|---|
| 2019 GAME-BY-GAME STATS |
|---|
 |
2019 SCHEDULE |
2018 RESULTS |
|||||||||||||||||||||||||||||||||||||||||||||||||||||||||||||||||||||||||||||||||||||||||||||||||||||||||||||||||||||||||||||||||||||||||||||||||||||||||||||||||||||||||||||||||||||||||||||||||||||||||||||||||||||
|
|
|||||||||||||||||||||||||||||||||||||||||||||||||||||||||||||||||||||||||||||||||||||||||||||||||||||||||||||||||||||||||||||||||||||||||||||||||||||||||||||||||||||||||||||||||||||||||||||||||||||||||||||||||||||
| 2018 STATISTICAL LEADERS |
|---|
| 2018 GAME-BY-GAME STATS |
|---|
 |
2018 SCHEDULE |
2017 RESULTS |
||||||||||||||||||||||||||||||||||||||||||||||||||||||||||||||||||||||||||||||||||||||||||||||||||||||||||||||||||||||||||||||||||||||||||||||||||||||||||||||||||||||||||||||||||||||||||||||||||||||||||||||||||||||||||||||||
|
|
||||||||||||||||||||||||||||||||||||||||||||||||||||||||||||||||||||||||||||||||||||||||||||||||||||||||||||||||||||||||||||||||||||||||||||||||||||||||||||||||||||||||||||||||||||||||||||||||||||||||||||||||||||||||||||||||
| 2017 STATISTICAL LEADERS |
|---|
| 2017 GAME-BY-GAME STATS |
|---|
 |
2017 SCHEDULE |
2016 RESULTS |
||||||||||||||||||||||||||||||||||||||||||||||||||||||||||||||||||||||||||||||||||||||||||||||||||||||||||||||||||||||||||||||||||||||||||||||||||||||||||||||||||||||||||||||||||||||||||||||||||||||||||||||||||||||||||||||||
|
|
||||||||||||||||||||||||||||||||||||||||||||||||||||||||||||||||||||||||||||||||||||||||||||||||||||||||||||||||||||||||||||||||||||||||||||||||||||||||||||||||||||||||||||||||||||||||||||||||||||||||||||||||||||||||||||||||
| 2016 STATISTICAL LEADERS |
|---|
| 2016 GAME-BY-GAME STATS |
|---|
 |
| 2015 STATISTICAL LEADERS |
|---|
| 2015 GAME-BY-GAME STATS |
|---|
 |
2015 SCHEDULE |
2014 RESULTS |
||||||||||||||||||||||||||||||||||||||||||||||||||||||||||||||||||||||||||||||||||||||||||||||||||||||||||||||||||||||||||||||||||||||||||||||||||||||||||||||||||||||||||||||||||||||||||||||||||||||||||||||||||||||||||||||||
|
|
||||||||||||||||||||||||||||||||||||||||||||||||||||||||||||||||||||||||||||||||||||||||||||||||||||||||||||||||||||||||||||||||||||||||||||||||||||||||||||||||||||||||||||||||||||||||||||||||||||||||||||||||||||||||||||||||
| 2014 STATISTICAL LEADERS |
|---|
| 2014 GAME-BY-GAME STATS |
|---|
 |
| 2013 STATISTICAL LEADERS |
|---|
| Player | Att | Yds | YPC | TD | Player | Comp | Att | % | Yds | YPA | TD | INT | Rating | Player | Rec | Yds | YPC | TD |
| Prescott Line | 90 | 332 | 3.7 | 3 | Garrett Gilbert | 335 | 504 | 66.5% | 3528 | 7.0 | 21 | 7 | 136.2 | Jeremy Johnson | 112 | 1112 | 9.9 | 6 |
| Garrett Gilbert | 83 | 267 | 3.2 | 6 | Neal Burcham | 64 | 109 | 58.7% | 556 | 5.1 | 2 | 4 | 100.3 | Keenan Holman | 67 | 1037 | 15.5 | 9 |
| KC Nlemchi | 51 | 238 | 4.7 | 1 | Garrett Krstich | 1 | 5 | 20.0% | 13 | 2.6 | 0 | 1 | 1.8 | Darius Joseph | 103 | 808 | 7.8 | 5 |
| 2013 GAME-BY-GAME STATS |
|---|
 |
2013 SCHEDULE |
2012 RESULTS |
|||||||||||||||||||||||||||||||||||||||||||||||||||||||||||||||||||||||||||||||||||||||||||||||||||||||||||||||||||||||||||||||||||||||||||||||||||||||||||||||||||||||||||||||||||||||||||||||||||||||||||||||||||||||||||||||||||||||||||||||||||||||||||||||||||||||
|
|
|||||||||||||||||||||||||||||||||||||||||||||||||||||||||||||||||||||||||||||||||||||||||||||||||||||||||||||||||||||||||||||||||||||||||||||||||||||||||||||||||||||||||||||||||||||||||||||||||||||||||||||||||||||||||||||||||||||||||||||||||||||||||||||||||||||||
| 2012 STATISTICAL LEADERS |
|---|
| Player | Att | Yds | YPC | TD | Player | Comp | Att | % | Yds | YPA | TD | INT | Rating | Player | Rec | Yds | YPC | TD | ||
| Zach Line | 277 | 1278 | 4.6 | 13 | Garrett Gilbert | 268 | 506 | 53.0% | 2927 | 5.8 | 15 | 15 | 105.4 | Darius Johnson | 64 | 787 | 12.3 | 5 | ||
| Garrett Gilbert | 94 | 346 | 3.7 | 8 | Conner Preston | 5 | 10 | 50.0% | 127 | 12.7 | 1 | 0 | 189.7 | Jeremy Johnson | 67 | 679 | 10.1 | 3 | ||
| Luke Seeker | 12 | 60 | 5.0 | 0 | Der'rikk Thompson | 41 | 535 | 13.0 | 4 |
| 2012 Individual Player Stats • 2012 Start Chart/ Starters Lost |
|---|
| 2012 GAME-BY-GAME STATS |
|---|
 |
| 2011 STATISTICAL LEADERS |
|---|
| Player | Att | Yds | YPC | TD | Player | Comp | Att | % | Yds | YPA | TD | INT | Rating | Player | Rec | Yds | YPC | TD | ||
| Zach Line | 208 | 1224 | 5.9 | 17 | JJ McDermott | 272 | 455 | 59.8% | 3421 | 7.5 | 17 | 16 | 128.2 | Darius Johnson | 79 | 1118 | 14.2 | 8 | ||
| Jared Williams | 42 | 180 | 4.3 | 1 | Kyle Padron | 9 | 20 | 45.0% | 152 | 7.6 | 0 | 3 | 78.8 | Cole Beasley | 86 | 1040 | 12.1 | 2 | ||
| Rishaad Wimbley | 40 | 178 | 4.5 | 4 | S Kaiser | 0 | 1 | 0.0% | 0 | 0.0 | 0 | 0 | 0.0 | Terrance Wilkerson | 44 | 561 | 12.8 | 2 |
| 2011 Individual Player Stats |
|---|
| 2011 GAME-BY-GAME STATS |
|---|
2011 RESULTS |
2010 RESULTS |
|||||||||||||||||||||||||||||||||||||||||||||||||||||||||||||||||||||||||||||||||||||||||||||||||||||||||||||||||||||||||||||||||||||||||||||||||||||||||||||||||||||||||||||||||||||||||||||||||||
|
|
|||||||||||||||||||||||||||||||||||||||||||||||||||||||||||||||||||||||||||||||||||||||||||||||||||||||||||||||||||||||||||||||||||||||||||||||||||||||||||||||||||||||||||||||||||||||||||||||||||
| 2010 STATISTICAL LEADERS |
|---|
| Player | Att | Yds | YPC | TD | Player | Comp | Att | % | Yds | YPA | TD | INT | Rating | Player | Rec | Yds | YPC | TD | ||
| Zach Line | 244 | 1494 | 6.1 | 10 | Kyle Padron | 302 | 508 | 59.4% | 3828 | 7.5 | 31 | 14 | 137.4 | Aldrick Robinson | 65 | 1301 | 20.0 | 14 | ||
| Kyle Padron | 104 | 244 | 2.3 | 3 | JJ McDermott | 2 | 4 | 50.0% | 33 | 8.3 | 0 | 0 | 119.3 | Cole Beasley | 87 | 1060 | 12.2 | 6 | ||
| Chris Butler | 33 | 182 | 5.5 | 0 | Team | 0 | 4 | 0.0% | 0 | 0.0 | 0 | 0 | 0.0 | Darius Johnson | 78 | 845 | 10.8 | 6 |
| 2010 Individual Player Stats |
|---|
| 2010 GAME-BY-GAME STATS |
|---|
| 2009 STATISTICAL LEADERS |
|---|
| Player | Att | Yds | YPC | TD | Player | Comp | Att | % | Yds | YPA | TD | INT | Rating | Player | Rec | Yds | YPC | TD | ||
| Shawnbrey McNeal | 224 | 1125 | 5.02 | 9 | BL Mitchell | 149 | 266 | 56.0% | 1725 | 6.5 | 12 | 10 | 117.9 | Emmanuel Sanders | 91 | 1215 | 13.4 | 6 | ||
| Zach Line | 45 | 180 | 4.00 | 6 | Kyle Pardon | 103 | 160 | 64.4% | 1462 | 9.1 | 8 | 4 | 152.6 | Aldrick Robinson | 38 | 624 | 16.4 | 5 | ||
| Braden Smith | 12 | 86 | 7.17 | 1 | Braden Smith | 2 | 5 | 40.0% | 19 | 3.8 | 0 | 0 | 71.9 | Terrance Wilkerson | 40 | 509 | 12.7 | 4 |
| 2009 GAME-BY-GAME STATS |
|---|
2009 RESULTS |
2008 RESULTS |
||||||||||||||||||||||||||||||||||||||||||||||||||||||||||||||||||||||||||||||||||||||||||||||||||||||||||||||||||||||||||||||||||||||||||||||||||||||
|
|
||||||||||||||||||||||||||||||||||||||||||||||||||||||||||||||||||||||||||||||||||||||||||||||||||||||||||||||||||||||||||||||||||||||||||||||||||||||
| 2008 Individual Player Stats • 2007 Individual Player Stats |
|---|