
| TULANE GREEN WAVE |
|---|
|
STADIUM: Yulman Stadium PLAYING SURFACE: UBU Speed Series 5M • CAPACITY: 30,000 STARTERS RETURNING (O/D): 6*/8 LETTERMAN RETURNING: 20 (9,11,0) LETTERMAN LOST: 39 (16,20,3) |
 |
|
| LOCATION: New Orleans, LA | |
| FOUNDED: 1834 | |
| ENROLLMENT: 6,773 | |
| COLORS: Olive Green & Sky Blue | |
| MASCOT: Riptide | |
| CONFERENCE: AAC | |
| Head Coach: Jon Sumrall | |
| YEARS WITH TM: 2nd | |
| OVERALL RECORD: 32-9 | |
| Record with Team: 9-5 | |
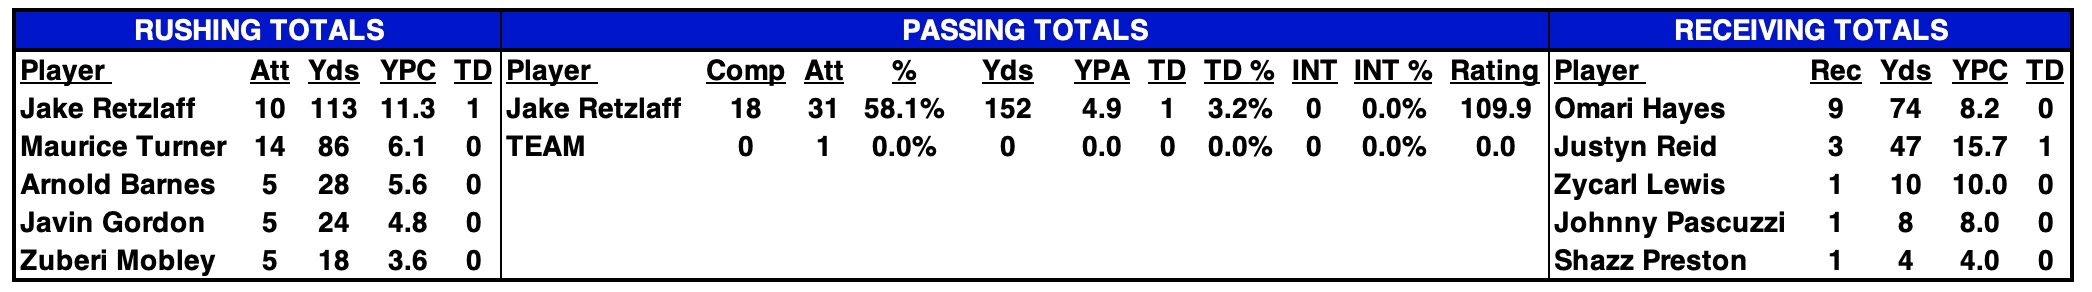
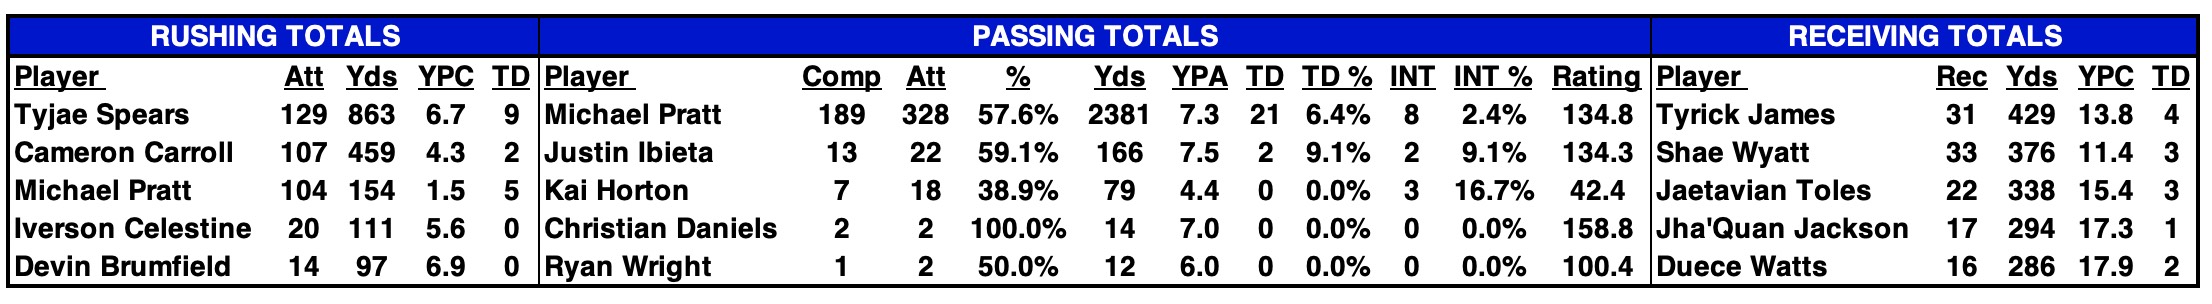
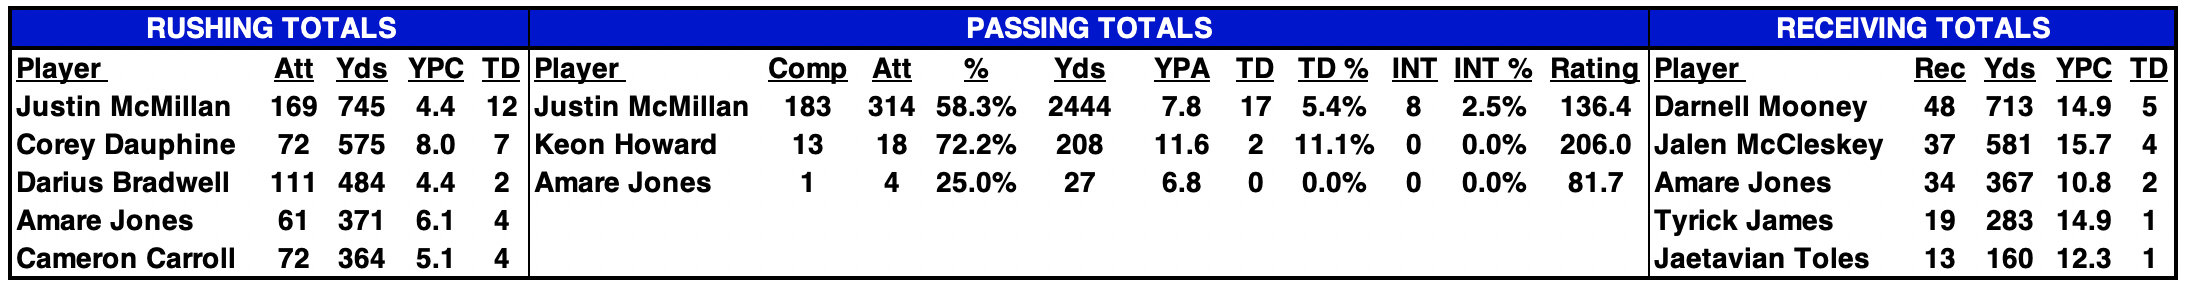
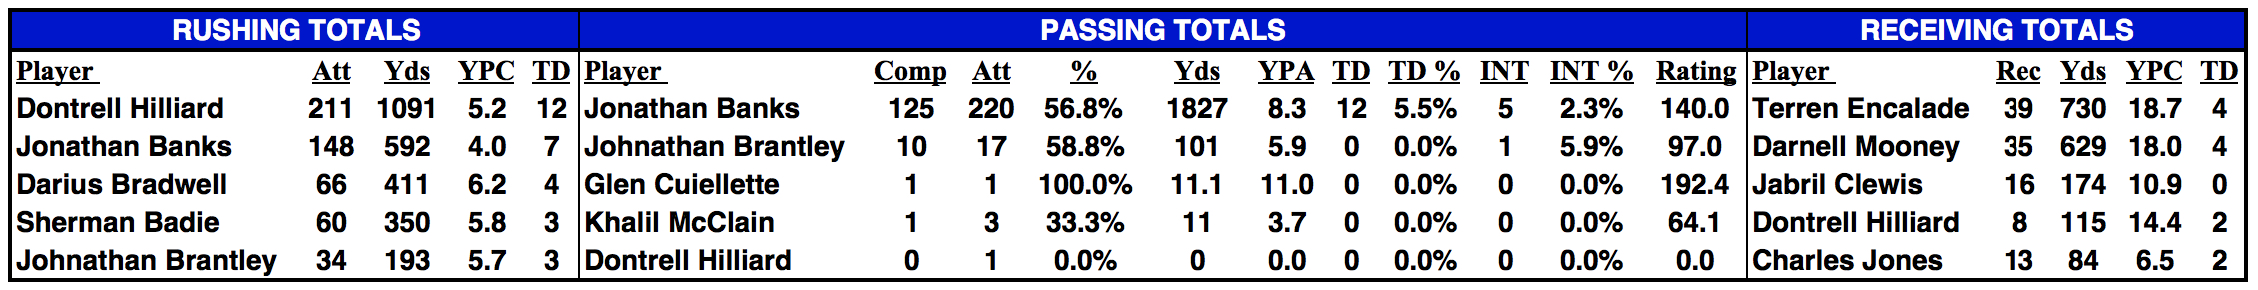
| 2025 STATISTICAL LEADERS |
|---|
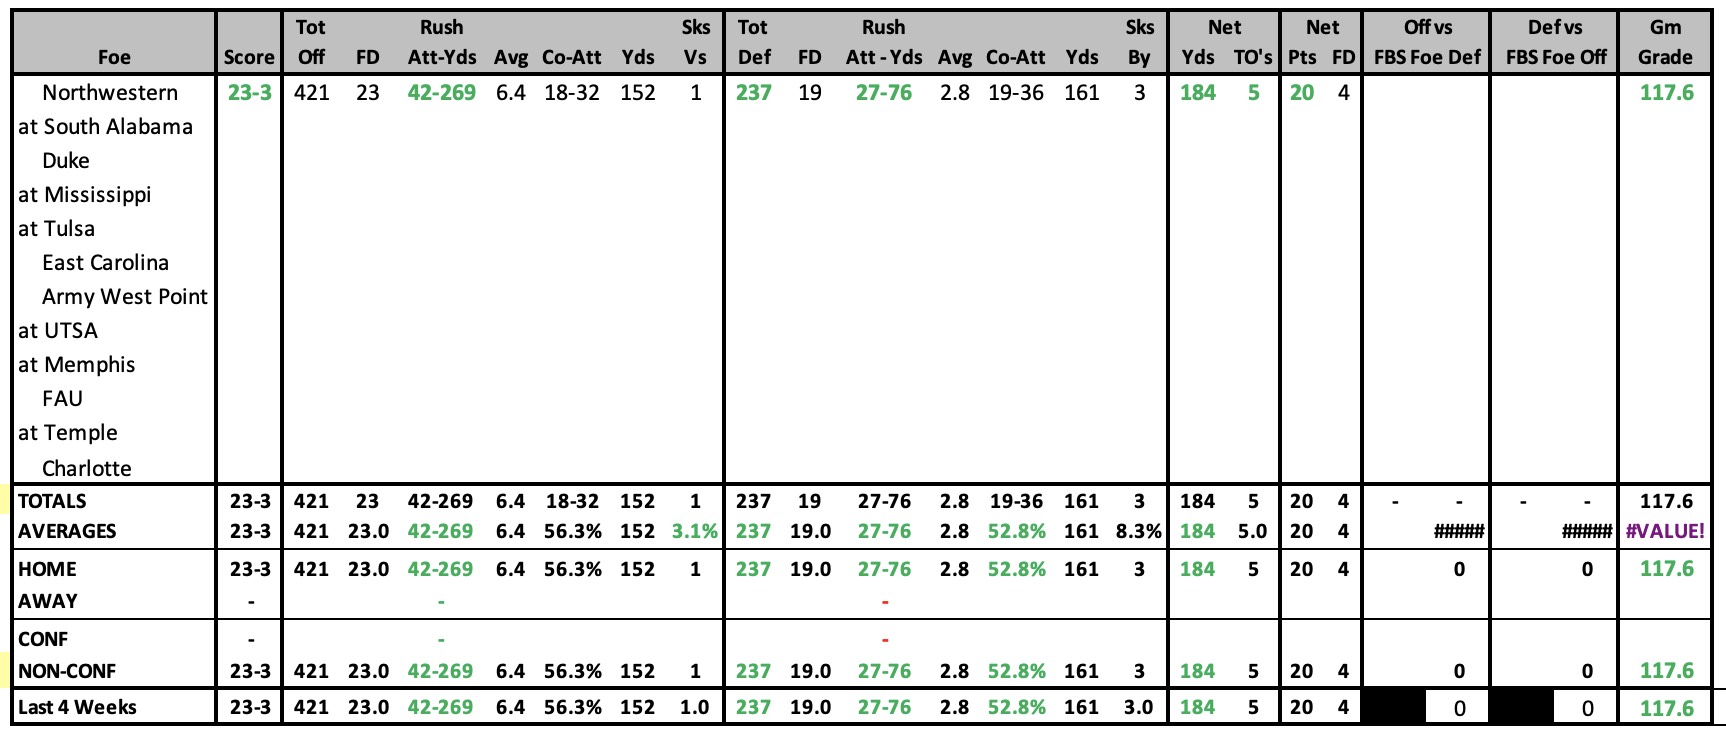
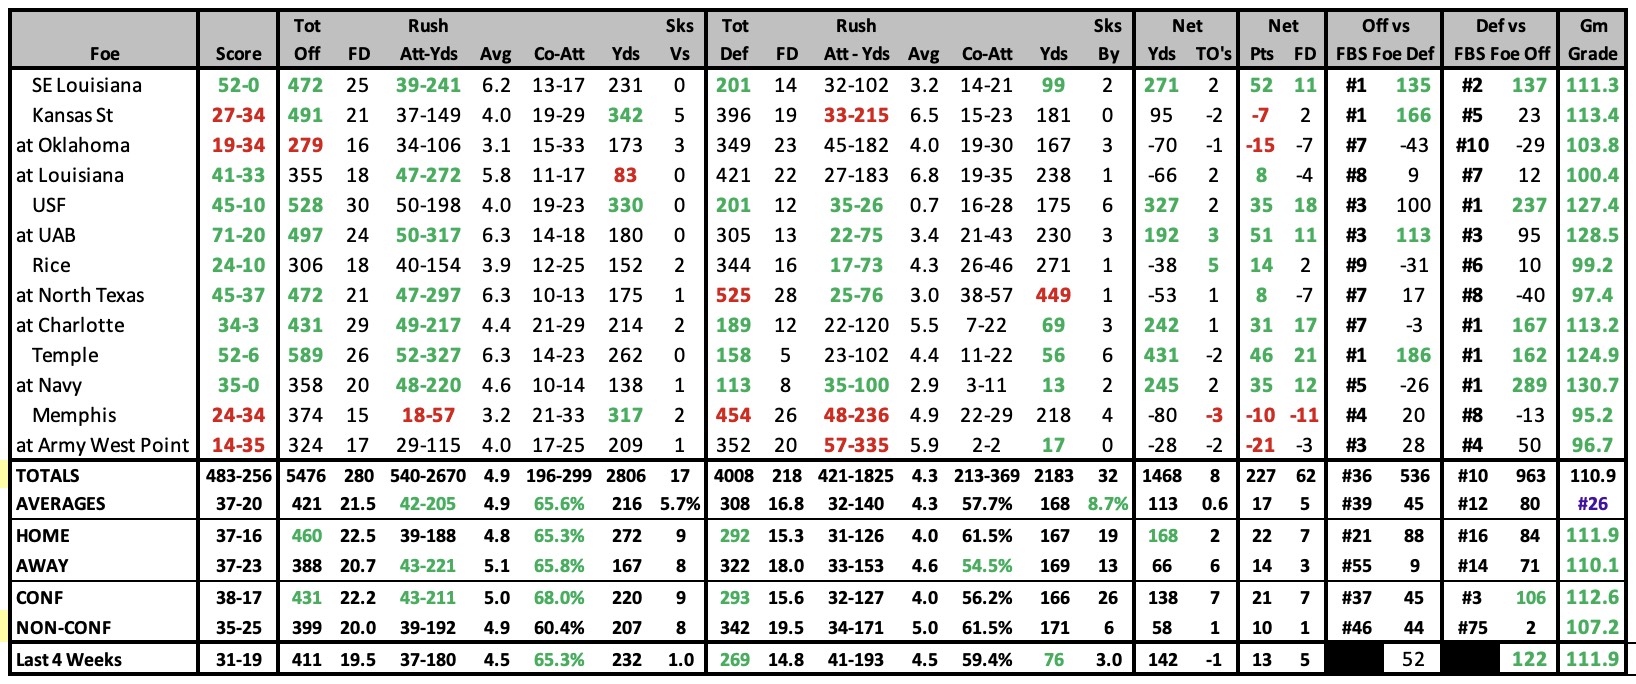
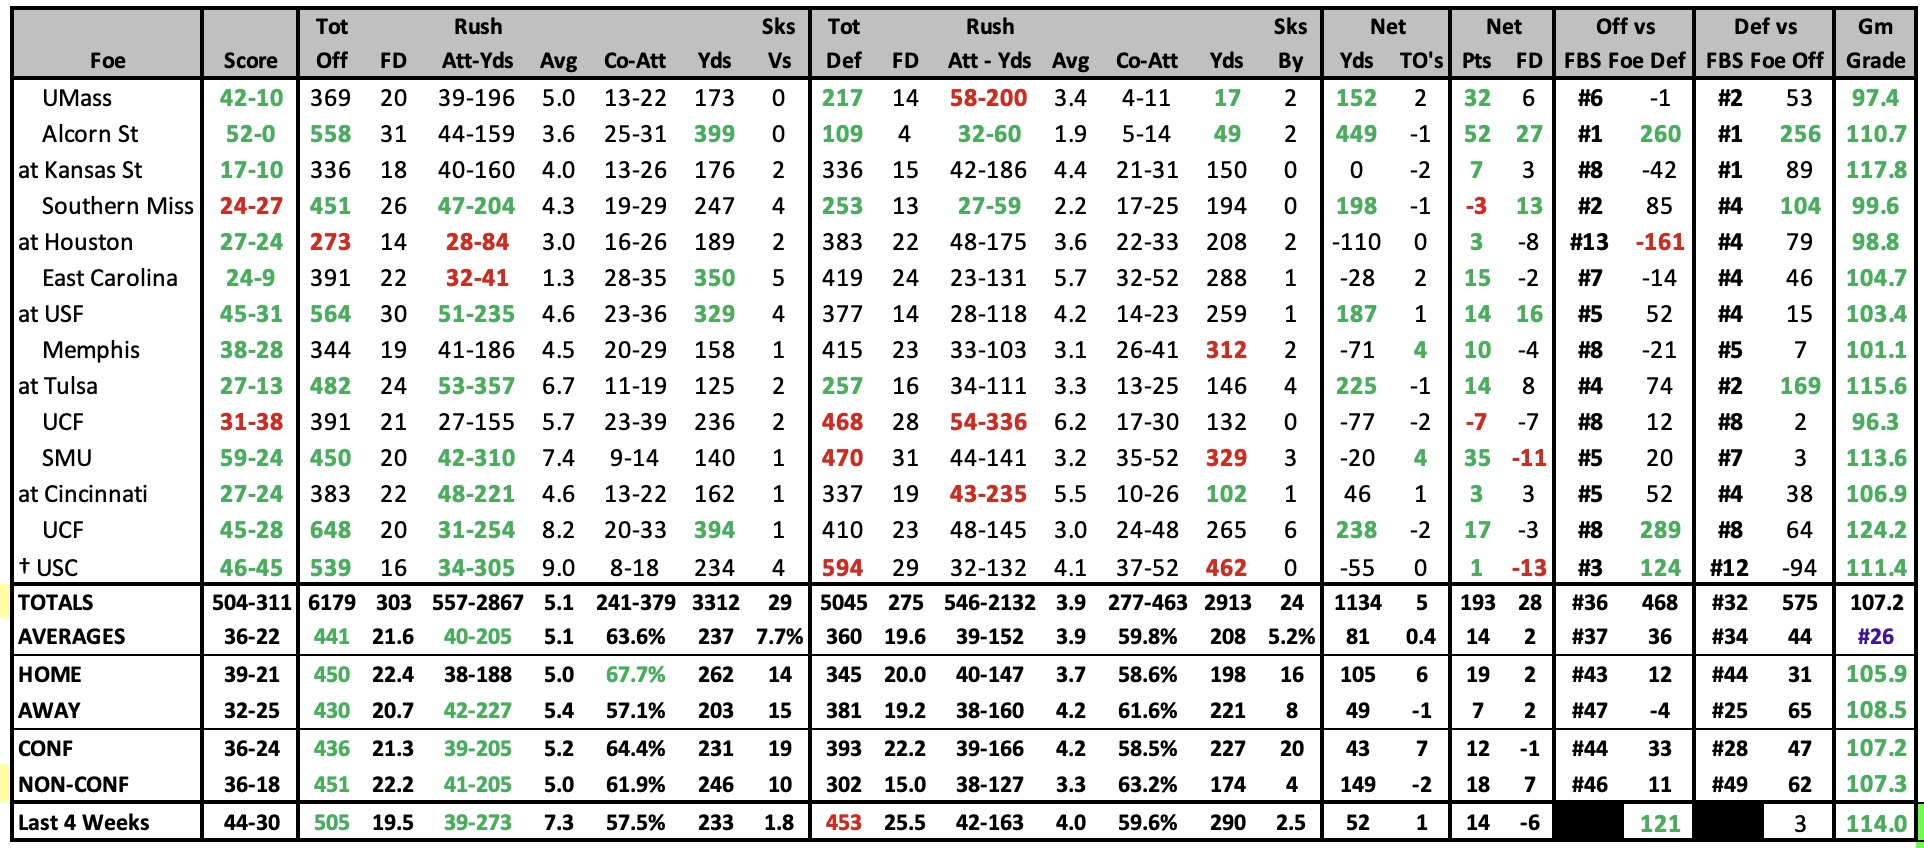
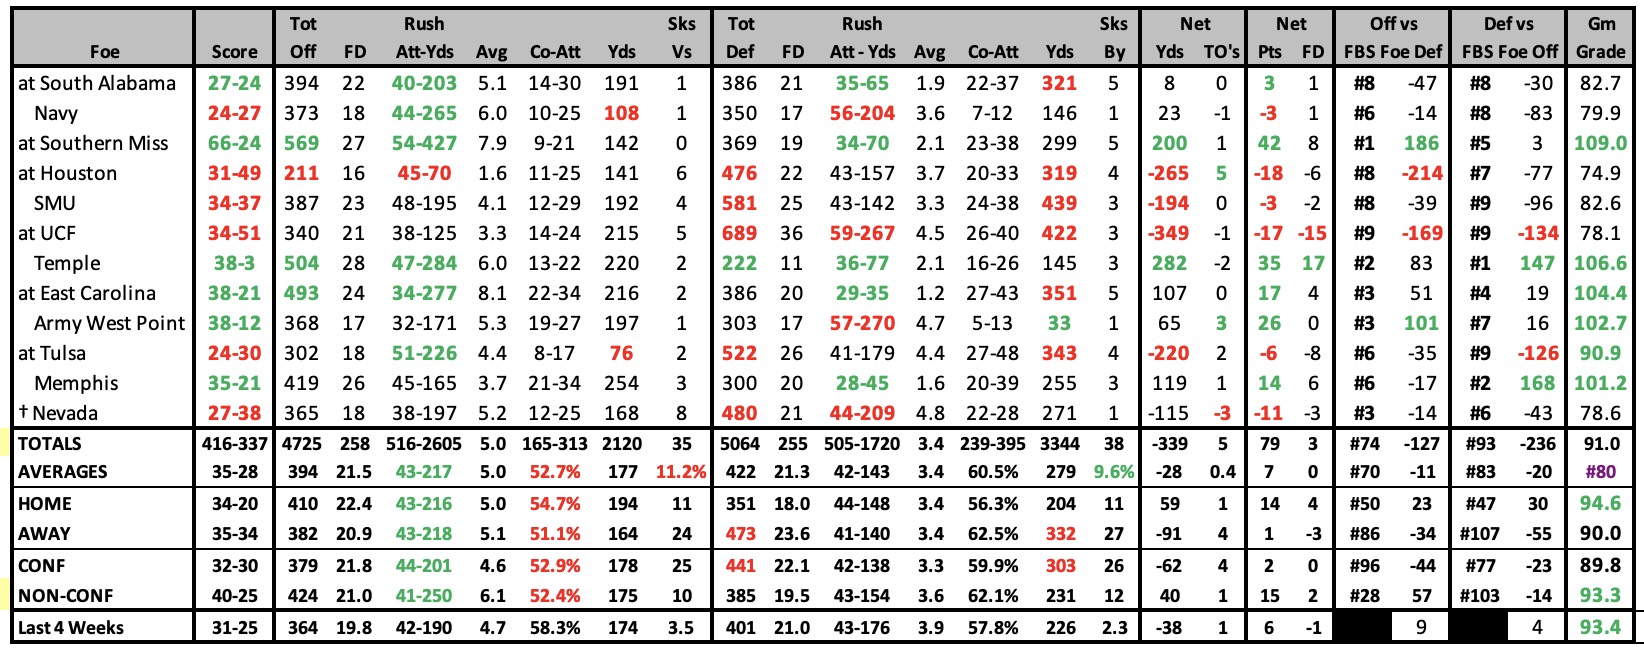
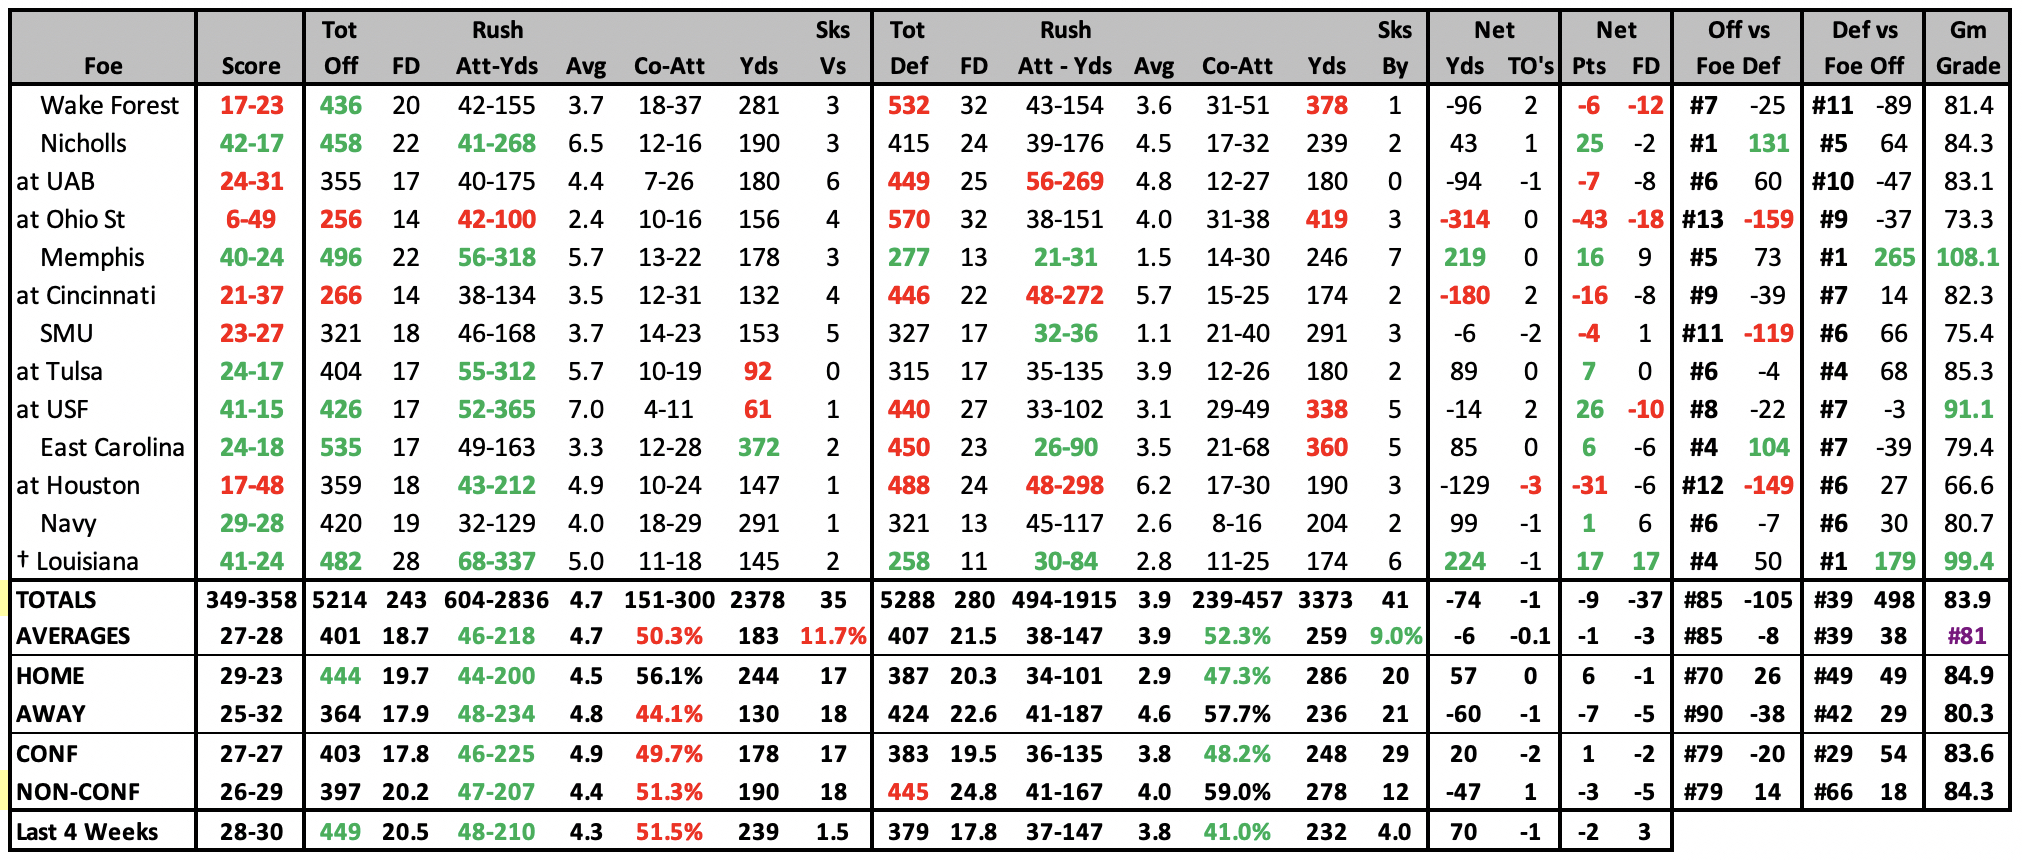
| 2025 GAME BY GAME STATS |
|---|
 |
2025 SCHEDULE |
2024 RESULTS |
||||||||||||||||||||||||||||||||||||||||||||||||||||||||||||||||||||||||||||||||||||||||||||||||||||||||||||||||||||||||||||||||||||||||||||||||||||||||||||||||||||||||||||||||||||||||||||||||||||||||||||||||||||||||||||||||||||||||||
|
|
||||||||||||||||||||||||||||||||||||||||||||||||||||||||||||||||||||||||||||||||||||||||||||||||||||||||||||||||||||||||||||||||||||||||||||||||||||||||||||||||||||||||||||||||||||||||||||||||||||||||||||||||||||||||||||||||||||||||||
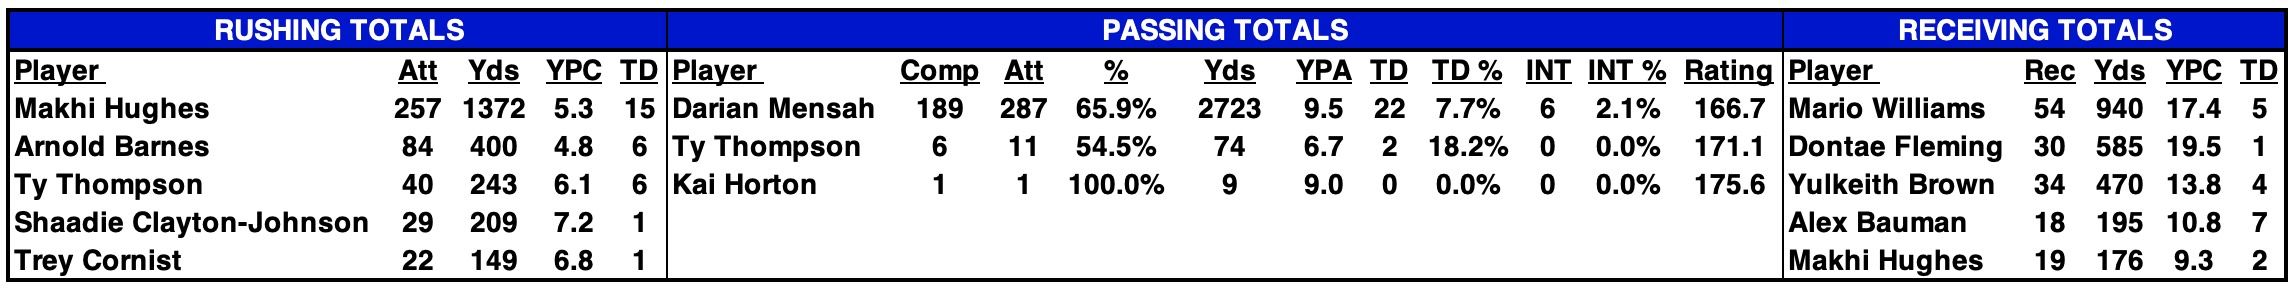
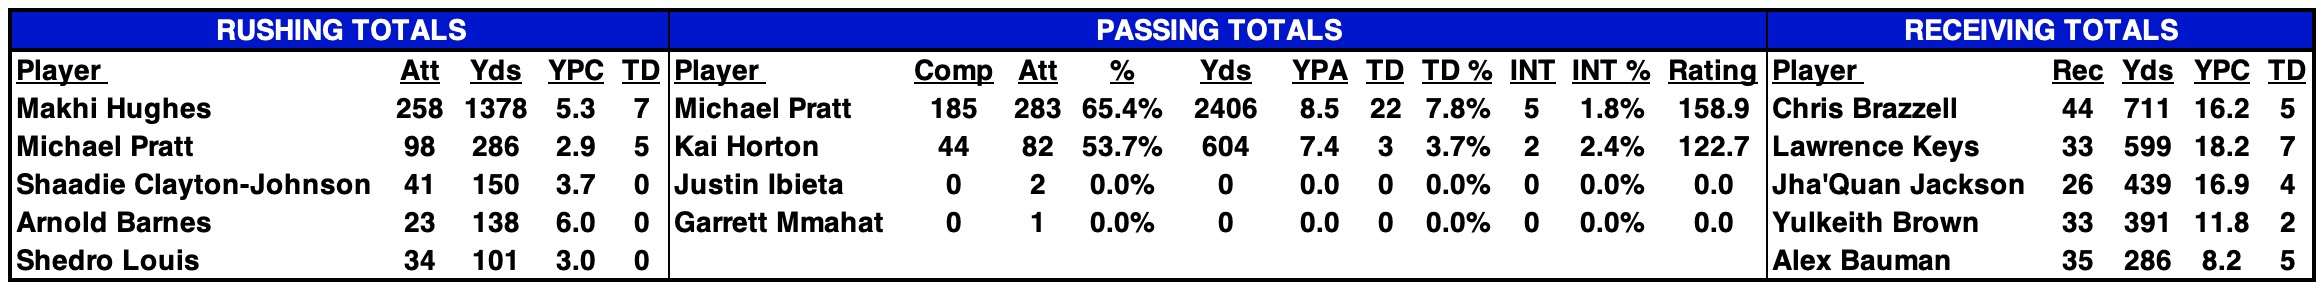
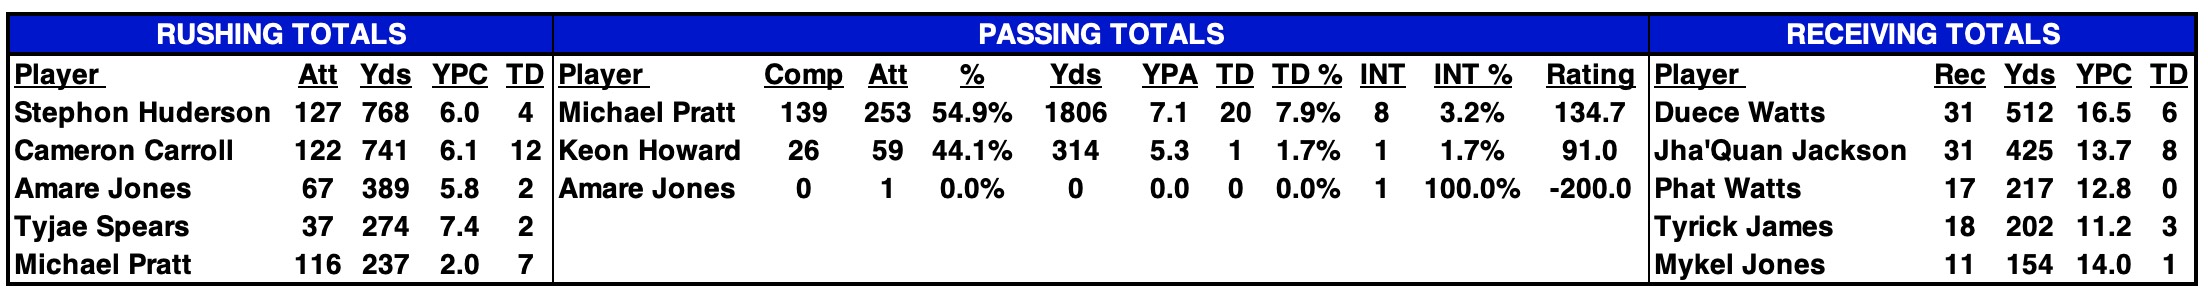
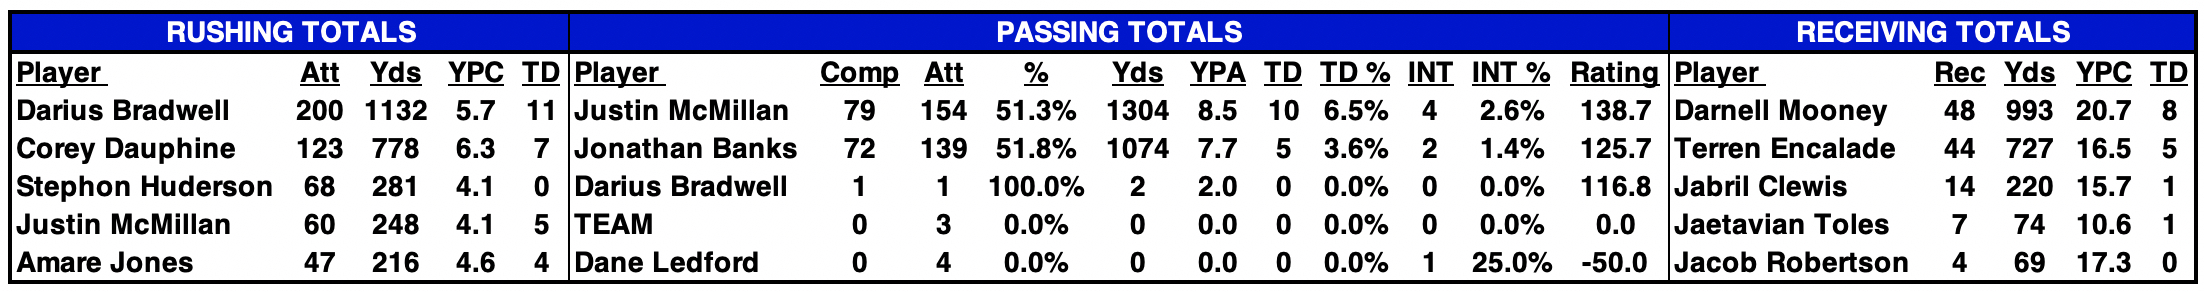
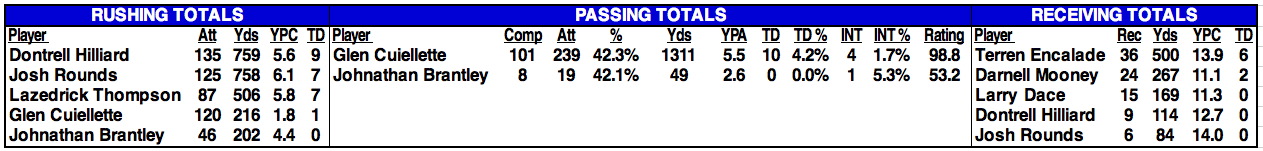
| 2024 STATISTICAL LEADERS |
|---|
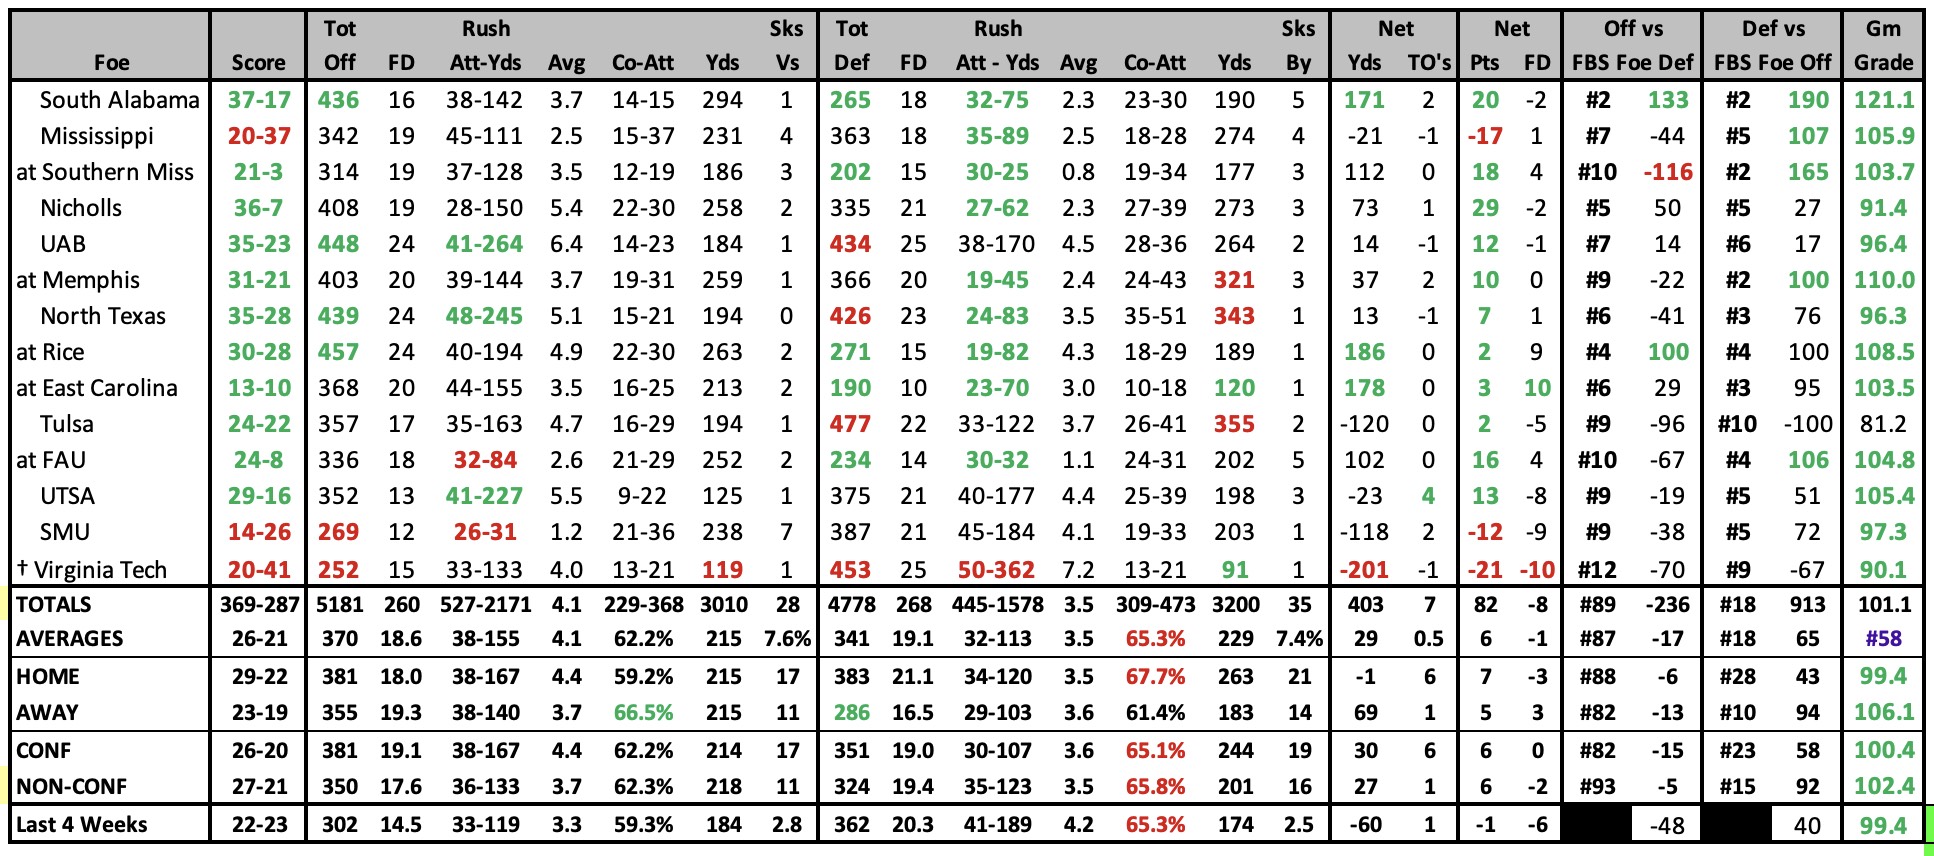
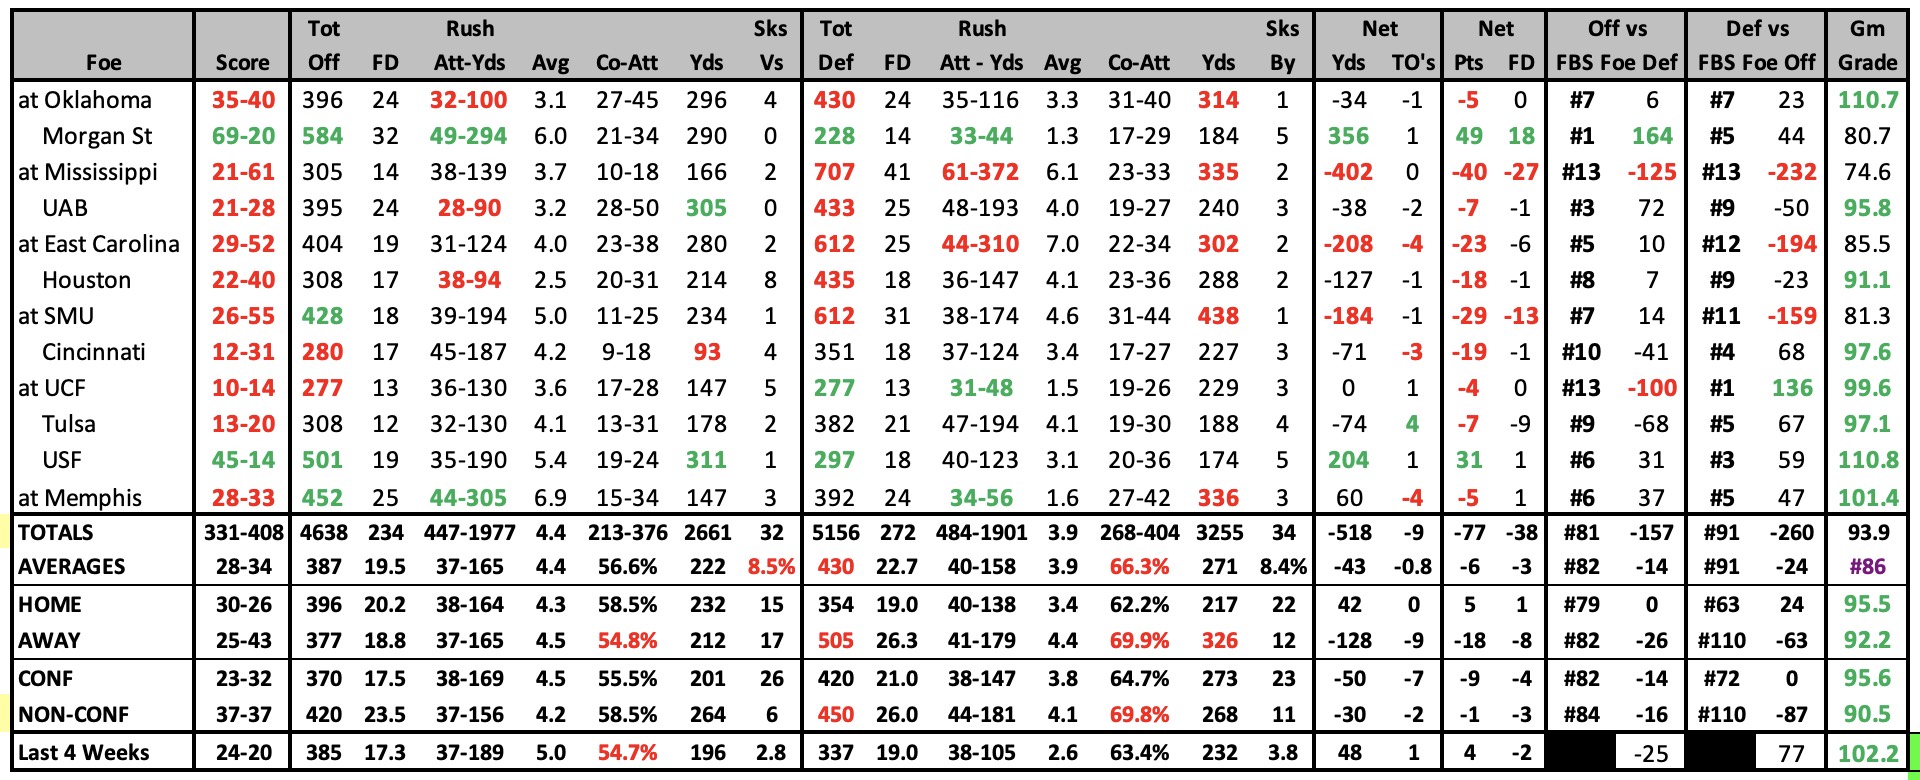
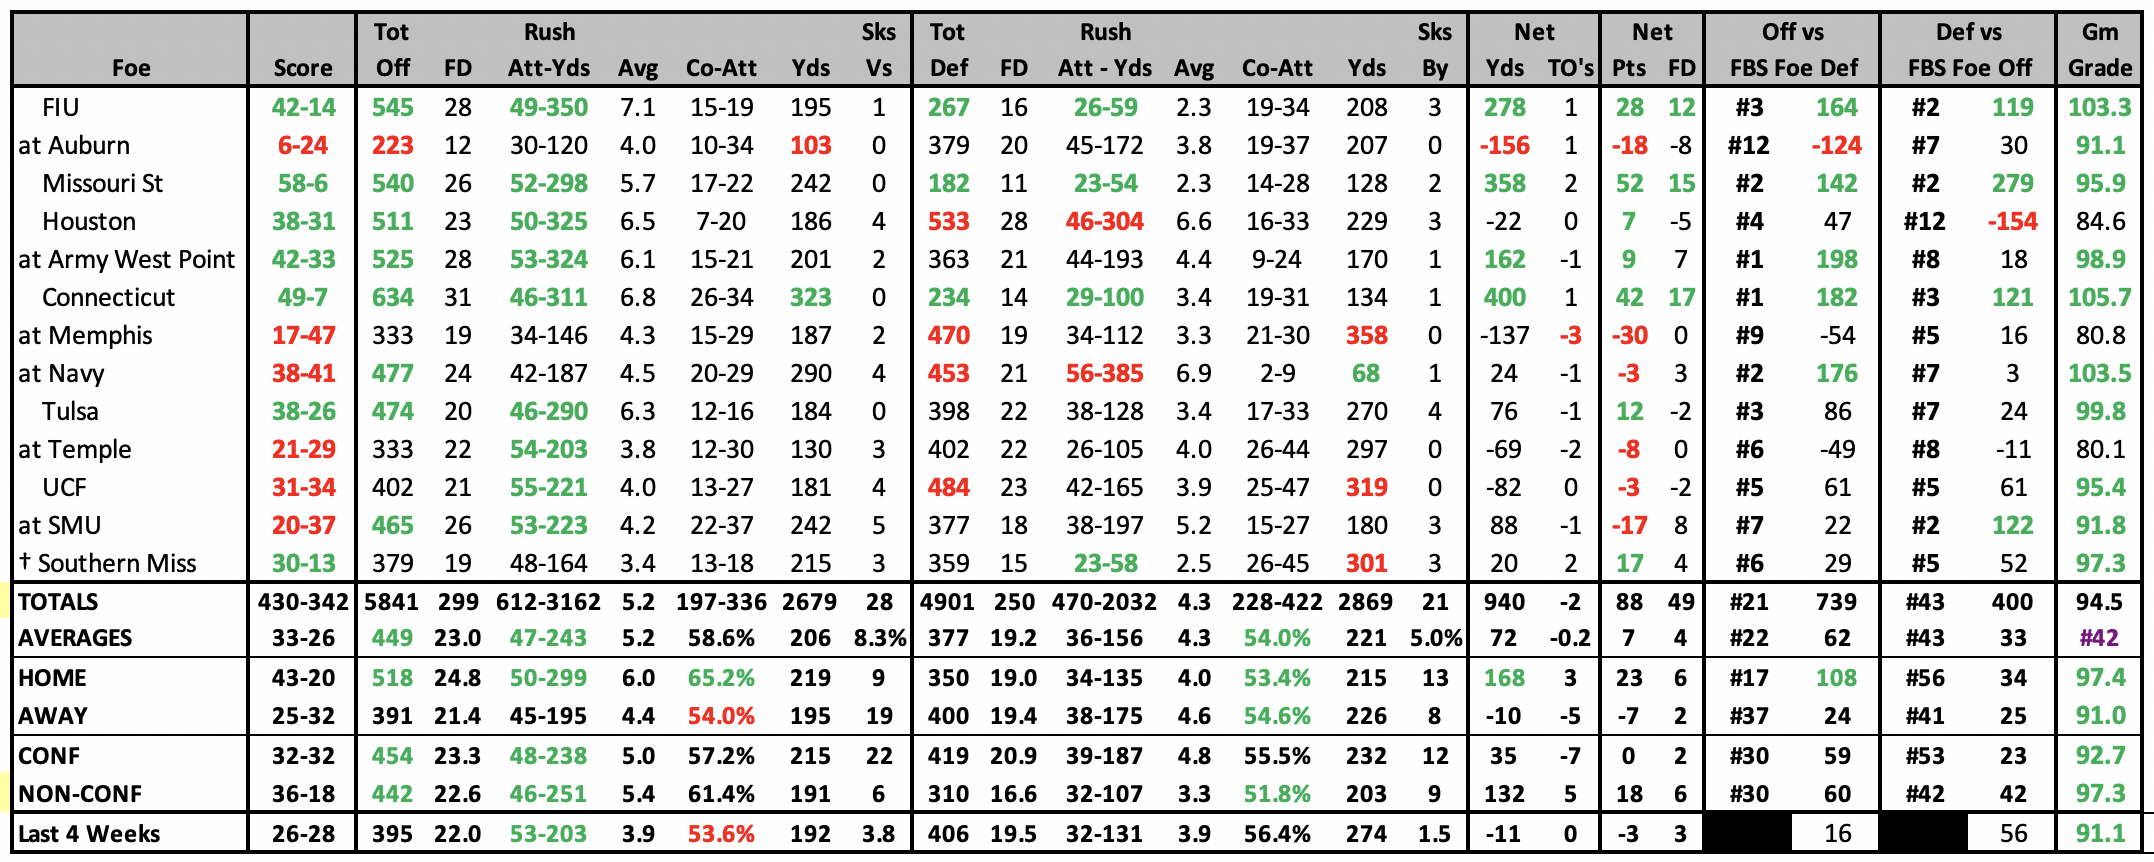
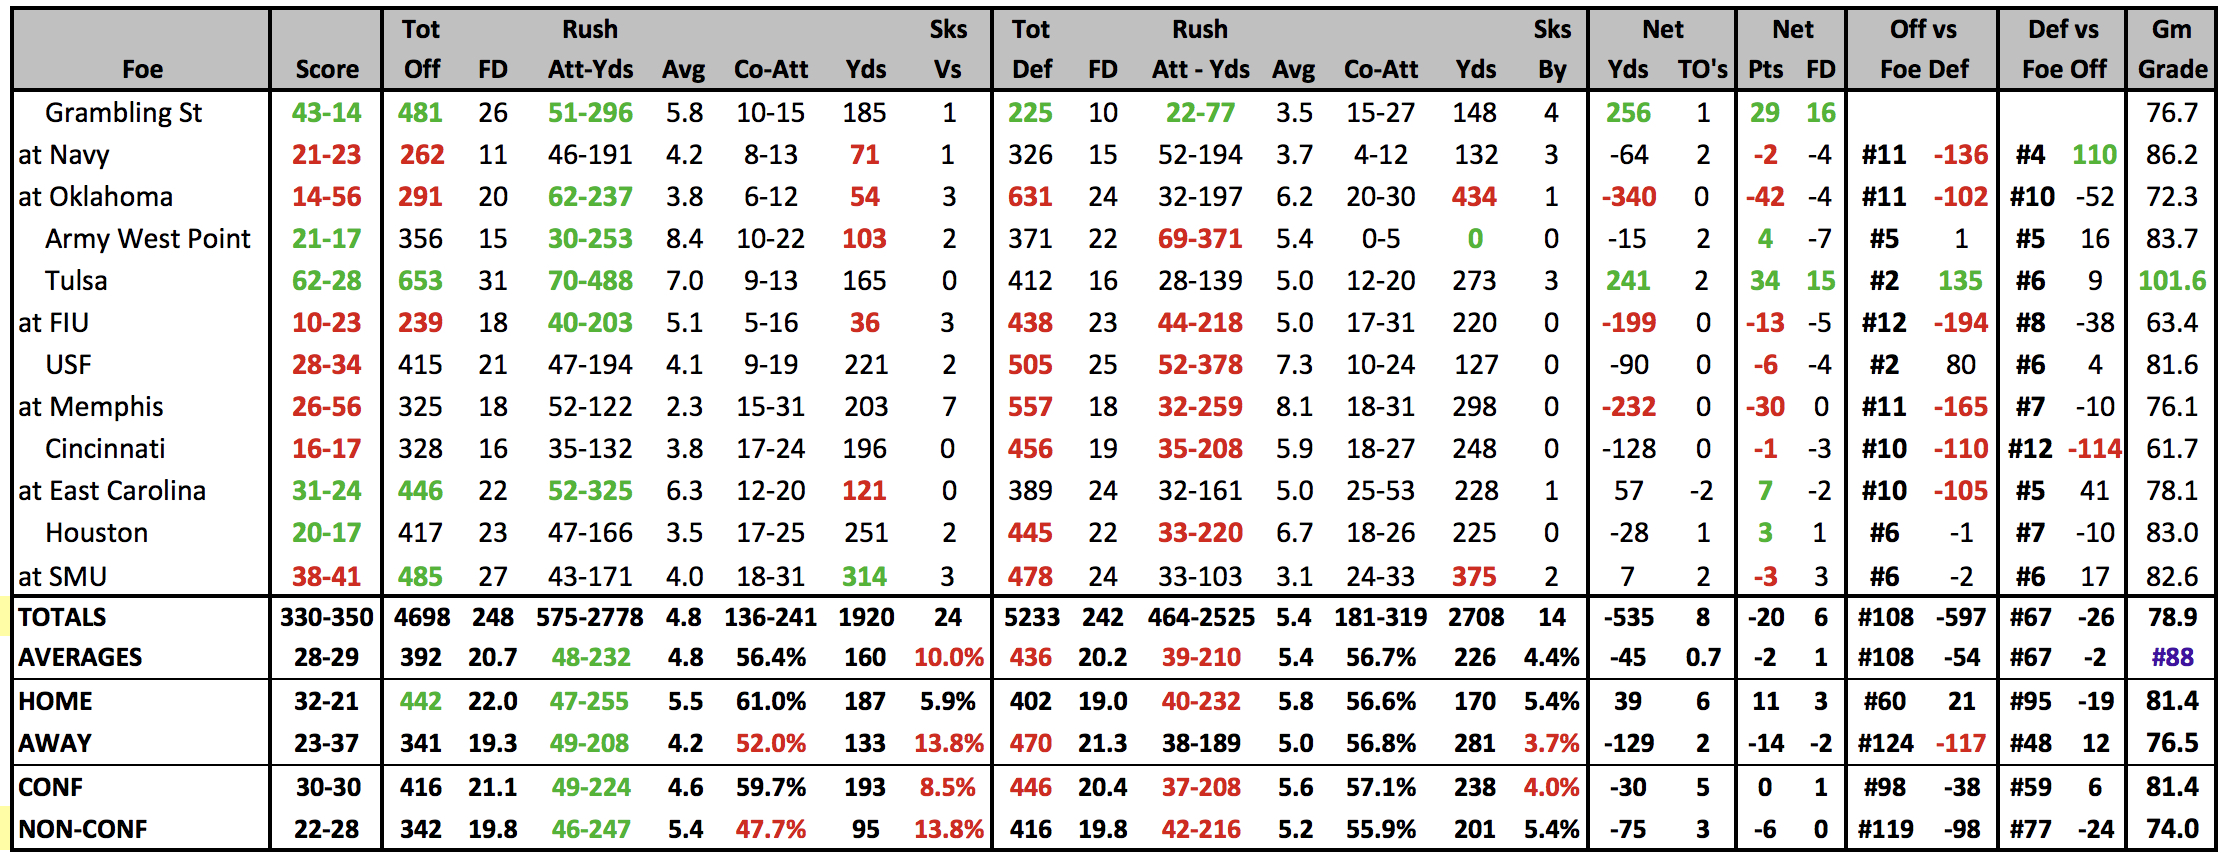
| 2024 GAME BY GAME STATS |
|---|
 |
| 2023 STATISTICAL LEADERS |
|---|
| 2023 GAME BY GAME STATS |
|---|
 |
2023 SCHEDULE |
2022 RESULTS |
||||||||||||||||||||||||||||||||||||||||||||||||||||||||||||||||||||||||||||||||||||||||||||||||||||||||||||||||||||||||||||||||||||||||||||||||||||||||||||||||||||||||||||||||||||||||||||||||||||||||||||||||||||||||||||||
|
|
||||||||||||||||||||||||||||||||||||||||||||||||||||||||||||||||||||||||||||||||||||||||||||||||||||||||||||||||||||||||||||||||||||||||||||||||||||||||||||||||||||||||||||||||||||||||||||||||||||||||||||||||||||||||||||||
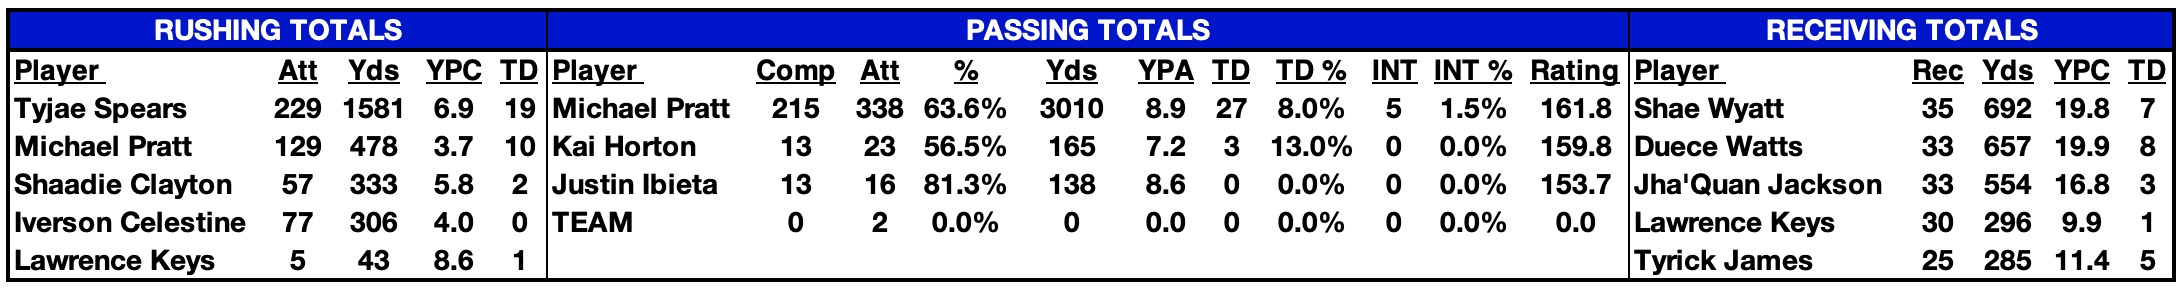
| 2022 STATISTICAL LEADERS |
|---|
| 2022 GAME BY GAME STATS |
|---|
 |
2022 SCHEDULE |
2021 RESULTS |
||||||||||||||||||||||||||||||||||||||||||||||||||||||||||||||||||||||||||||||||||||||||||||||||||||||||||||||||||||||||||||||||||||||||||||||||||||||||||||||||||||||||||||||||||||||||||||||||||||||||||||
|
|
||||||||||||||||||||||||||||||||||||||||||||||||||||||||||||||||||||||||||||||||||||||||||||||||||||||||||||||||||||||||||||||||||||||||||||||||||||||||||||||||||||||||||||||||||||||||||||||||||||||||||||
| 2021 STATISTICAL LEADERS |
|---|
| 2021 GAME BY GAME STATS |
|---|
 |
2021 SCHEDULE |
2020 RESULTS |
||||||||||||||||||||||||||||||||||||||||||||||||||||||||||||||||||||||||||||||||||||||||||||||||||||||||||||||||||||||||||||||||||||||||||||||||||||||||||||||||||||||||||||||||||||||||||
|
|
||||||||||||||||||||||||||||||||||||||||||||||||||||||||||||||||||||||||||||||||||||||||||||||||||||||||||||||||||||||||||||||||||||||||||||||||||||||||||||||||||||||||||||||||||||||||||
| 2020 STATISTICAL LEADERS |
|---|
| 2020 GAME BY GAME STATS |
|---|
 |
2020 SCHEDULE |
2019 RESULTS |
||||||||||||||||||||||||||||||||||||||||||||||||||||||||||||||||||||||||||||||||||||||||||||||||||||||||||||||||||||||||||||||||||||||||||||||||||||||||||||||||||||||||||||||||||||||||||||||||||||||||||||
|
|
||||||||||||||||||||||||||||||||||||||||||||||||||||||||||||||||||||||||||||||||||||||||||||||||||||||||||||||||||||||||||||||||||||||||||||||||||||||||||||||||||||||||||||||||||||||||||||||||||||||||||||
| 2019 STATISTICAL LEADERS |
|---|
| 2019 GAME BY GAME STATS |
|---|
 |
2019 SCHEDULE |
2018 RESULTS |
||||||||||||||||||||||||||||||||||||||||||||||||||||||||||||||||||||||||||||||||||||||||||||||||||||||||||||||||||||||||||||||||||||||||||||||||||||||||||||||||||||||||||||||||||||||||||||||||||||||||||||||||||||||||||||
|
|
||||||||||||||||||||||||||||||||||||||||||||||||||||||||||||||||||||||||||||||||||||||||||||||||||||||||||||||||||||||||||||||||||||||||||||||||||||||||||||||||||||||||||||||||||||||||||||||||||||||||||||||||||||||||||||
| 2018 STATISTICAL LEADERS |
|---|
| 2018 GAME BY GAME STATS |
|---|
 |
2018 SCHEDULE |
2017 RESULTS |
|||||||||||||||||||||||||||||||||||||||||||||||||||||||||||||||||||||||||||||||||||||||||||||||||||||||||||||||||||||||||||||||||||||||||||||||||||||||||||||||||||||||||||||||||||||||||||||||||||||||||||||||||||||||||
|
|
|||||||||||||||||||||||||||||||||||||||||||||||||||||||||||||||||||||||||||||||||||||||||||||||||||||||||||||||||||||||||||||||||||||||||||||||||||||||||||||||||||||||||||||||||||||||||||||||||||||||||||||||||||||||||
| 2017 STATISTICAL LEADERS |
|---|
| 2017 GAME BY GAME STATS |
|---|
 |
2017 SCHEDULE |
2016 RESULTS |
||||||||||||||||||||||||||||||||||||||||||||||||||||||||||||||||||||||||||||||||||||||||||||||||||||||||||||||||||||||||||||||||||||||||||||||||||||||||||||||||||||||||||||||||||||||||||||||||||||||||||||||||||
|
|
||||||||||||||||||||||||||||||||||||||||||||||||||||||||||||||||||||||||||||||||||||||||||||||||||||||||||||||||||||||||||||||||||||||||||||||||||||||||||||||||||||||||||||||||||||||||||||||||||||||||||||||||||
| 2016 STATISTICAL LEADERS |
|---|
| 2016 GAME BY GAME STATS |
|---|
 |
| 2015 STATISTICAL LEADERS |
|---|

| 2015 GAME BY GAME STATS |
|---|
 |
2015 SCHEDULE |
2014 RESULTS |
||||||||||||||||||||||||||||||||||||||||||||||||||||||||||||||||||||||||||||||||||||||||||||||||||||||||||||||||||||||||||||||||||||||||||||||||||||||||||||||||||||||||||||||||||||||||||||||||||||||||||||||||||||||||||||||||
|
|
||||||||||||||||||||||||||||||||||||||||||||||||||||||||||||||||||||||||||||||||||||||||||||||||||||||||||||||||||||||||||||||||||||||||||||||||||||||||||||||||||||||||||||||||||||||||||||||||||||||||||||||||||||||||||||||||
| 2014 STATISTICAL LEADERS |
|---|
| 2014 GAME BY GAME STATS |
|---|
 |
| 2013 STATISTICAL LEADERS |
|---|
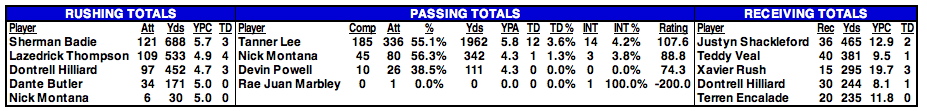
| Player | Att | Yds | YPC | TD | Player | Comp | Att | % | Yds | YPA | TD | INT | Rating | Player | Rec | Yds | YPC | TD |
| Orleans Darkwa | 188 | 863 | 4.6 | 12 | Nick Montana | 158 | 296 | 53.4% | 1717 | 5.8 | 14 | 10 | 111.0 | Ryan Grant | 77 | 1039 | 13.5 | 9 |
| Rob Kelley | 98 | 420 | 4.3 | 3 | Devin Powell | 60 | 110 | 54.5% | 681 | 6.2 | 5 | 5 | 112.5 | Justyn Shackleford | 36 | 419 | 11.6 | 5 |
| Josh Rounds | 49 | 163 | 3.3 | 0 | Jordy Joseph | 1 | 1 | 100.0% | 1 | 1.0 | 0 | 0 | 108.4 | Xavier Rush | 17 | 196 | 11.5 | 1 |
| 2013 GAME BY GAME STATS |
|---|
 |
2013 RESULTS |
2012 RESULTS |
|||||||||||||||||||||||||||||||||||||||||||||||||||||||||||||||||||||||||||||||||||||||||||||||||||||||||||||||||||||||||||||||||||||||||||||||||||||||||||||||||||||||||||||||||||||||||||||||||||||||||||||||||||||||||||||||||||||||||||||||||||||||||||||||||||||||||||||||||||||
|
|
|||||||||||||||||||||||||||||||||||||||||||||||||||||||||||||||||||||||||||||||||||||||||||||||||||||||||||||||||||||||||||||||||||||||||||||||||||||||||||||||||||||||||||||||||||||||||||||||||||||||||||||||||||||||||||||||||||||||||||||||||||||||||||||||||||||||||||||||||||||
| 2012 STATISTICAL LEADERS |
|---|
| Player | Att | Yds | YPC | TD | Player | Comp | Att | % | Yds | YPA | TD | INT | Rating | Player | Rec | Yds | YPC | TD | ||
| Rob Kelley | 81 | 286 | 3.5 | 0 | Ryan Griffin | 245 | 394 | 62.2% | 2771 | 7.0 | 19 | 11 | 131.6 | Ryan Grant | 76 | 1149 | 15.1 | 6 | ||
| Orleans Darkwa | 82 | 241 | 2.9 | 3 | DJ Ponder | 35 | 83 | 42.2% | 333 | 4.0 | 2 | 5 | 71.8 | Xavier Rush | 43 | 520 | 12.1 | 5 | ||
| Dante Butler | 40 | 157 | 3.9 | 0 | Devin Powell | 30 | 57 | 52.6% | 255 | 4.5 | 1 | 3 | 85.5 | Justyn Shackleford | 28 | 431 | 15.4 | 2 |
| 2012 Individual Player Stats • 2012 Start Chart/Starters Lost |
|---|
| 2012 GAME BY GAME STATS |
|---|
 |
| 2011 STATISTICAL LEADERS |
|---|
| Player | Att | Yds | YPC | TD | Player | Comp | Att | % | Yds | YPA | TD | INT | Rating | Player | Rec | Yds | YPC | TD | ||
| Orleans Darkwa | 190 | 853 | 4.5 | 11 | Ryan Griffin | 215 | 380 | 56.6% | 2400 | 6.3 | 13 | 9 | 116.2 | Wilson Van Hooser | 34 | 462 | 13.6 | 4 | ||
| Albert Williams | 58 | 260 | 4.5 | 1 | DJ Ponder | 18 | 48 | 37.5% | 214 | 4.5 | 0 | 4 | 58.3 | Justyn Shackleford | 31 | 404 | 13.0 | 1 | ||
| Robert Kelley | 58 | 240 | 4.1 | 2 | Joe Kemp | 1 | 1 | 100.0% | 35 | 35.0 | 0 | 0 | 394.0 | Xavier Rush | 24 | 338 | 14.1 | 3 |
| 2011 Individual Player Stats • 2011 Start Chart/ Starters Lost |
|---|
| 2011 GAME BY GAME STATS |
|---|
2011 RESULTS |
2010 RESULTS |
||||||||||||||||||||||||||||||||||||||||||||||||||||||||||||||||||||||||||||||||||||||||||||||||||||||||||||||||||||||||||||||||||||||||||||||||||||||||||||||||||||||||
|
|
||||||||||||||||||||||||||||||||||||||||||||||||||||||||||||||||||||||||||||||||||||||||||||||||||||||||||||||||||||||||||||||||||||||||||||||||||||||||||||||||||||||||
| 2010 STATISTICAL LEADERS |
|---|
| Player | Att | Yds | YPC | TD | Player | Comp | Att | % | Yds | YPA | TD | INT | Rating | Player | Rec | Yds | YPC | TD | ||
| Orleans Darkwa | 184 | 925 | 5.03 | 11 | Ryan Griffin | 223 | 372 | 59.9% | 2371 | 6.4 | 14 | 8 | 121.6 | Casey Robottom | 56 | 663 | 11.8 | 4 | ||
| Albert Williams | 86 | 370 | 4.30 | 1 | Kevin Moore | 28 | 62 | 45.2% | 316 | 5.1 | 2 | 3 | 88.9 | Ryan Grant | 33 | 515 | 15.6 | 4 | ||
| Payten Jason | 64 | 224 | 3.50 | 2 | Joe Kemp | 4 | 8 | 50.0% | 115 | 14.4 | 0 | 0 | 170.8 | Cody Sparks | 43 | 427 | 9.9 | 6 |
| 2010 Individual Player Stats |
|---|
| 2010 GAME BY GAME STATS |
|---|
| 2009 STATISTICAL LEADERS |
|---|
| Player | Att | Yds | YPC | TD | Player | Comp | Att | % | Yds | YPA | TD | INT | Rating | Player | Rec | Yds | YPC | TD | ||
| Andre Anderson | 238 | 1016 | 4.27 | 8 | Ryan Griffin | 141 | 222 | 63.5% | 1382 | 6.2 | 9 | 6 | 123.8 | Jeremy Williams | 84 | 1113 | 13.3 | 7 | ||
| Jeremy Williams | 38 | 167 | 4.39 | 0 | Joe Kemp | 84 | 130 | 64.6% | 1038 | 8.0 | 4 | 6 | 132.6 | Casey Robottom | 50 | 584 | 11.7 | 2 | ||
| Payten Jason | 19 | 85 | 4.47 | 0 | DJ Banks | 1 | 3 | 33.3% | 39 | 13.0 | 0 | 1 | 75.9 | Andre Anderson | 30 | 230 | 7.7 | 1 |
| 2009 Individual Player Stats |
|---|
| 2009 GAME BY GAME STATS |
|---|
2009 RESULTS |
2008 RESULTS |
|||||||||||||||||||||||||||||||||||||||||||||||||||||||||||||||||||||||||||||||||||||||||||||||||||||||||||||||||||||||||||||||||||||||||||||||||
|
|
|||||||||||||||||||||||||||||||||||||||||||||||||||||||||||||||||||||||||||||||||||||||||||||||||||||||||||||||||||||||||||||||||||||||||||||||||
| 2008 Individual Player Stats • 2007 Individual Player Stats |
|---|