
| MARSHALL THUNDERING HERD |
|---|
|
STADIUM: Joan C Edwards Stadium PLAYING SURFACE: Field Turf • CAPACITY: 38,227 STARTERS RETURNING (O/D): 2/2 LETTERMAN RETURNING: 16 (8,7,1) • LETTERMAN LOST: 36 (14,19,3) |
 |
|
| CONF: Sun Belt | |
| LOCATION: Huntington, WV | |
| FOUNDED: 1837 | |
| ENROLLMENT: 9,593 | |
| COLORS: Green & White | |
| MASCOT: Marco | |
| Head Coach: Tony Gibson | |
| Yrs with Tm: 1st | |
| Overall Record: 0-0 | |
| Record with Tm: 0-0 |
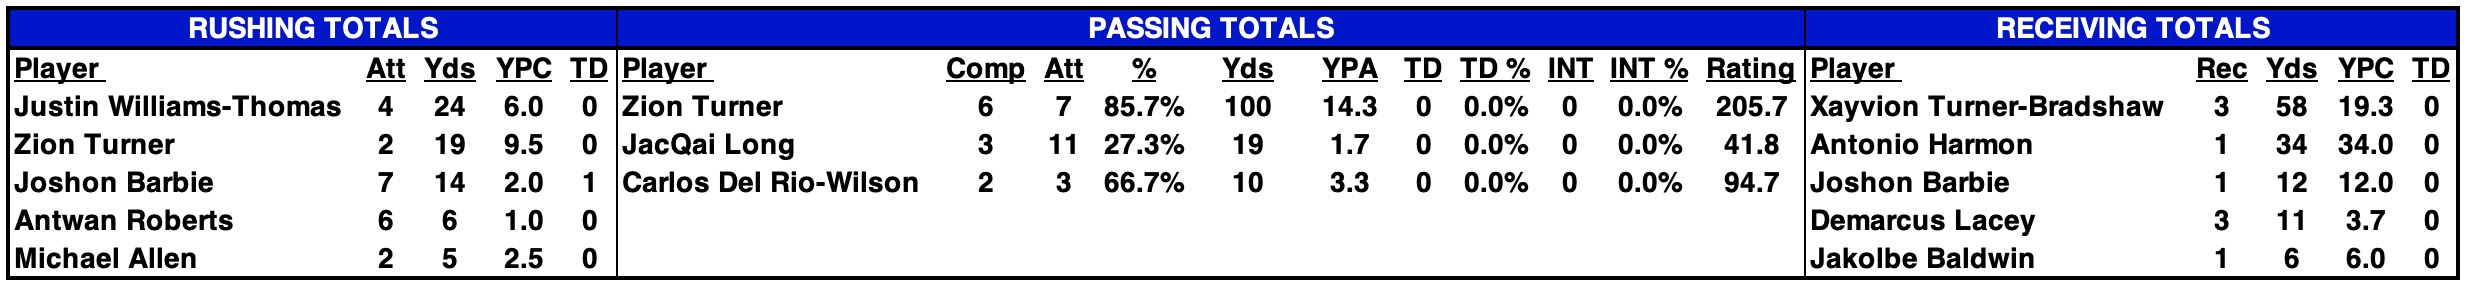
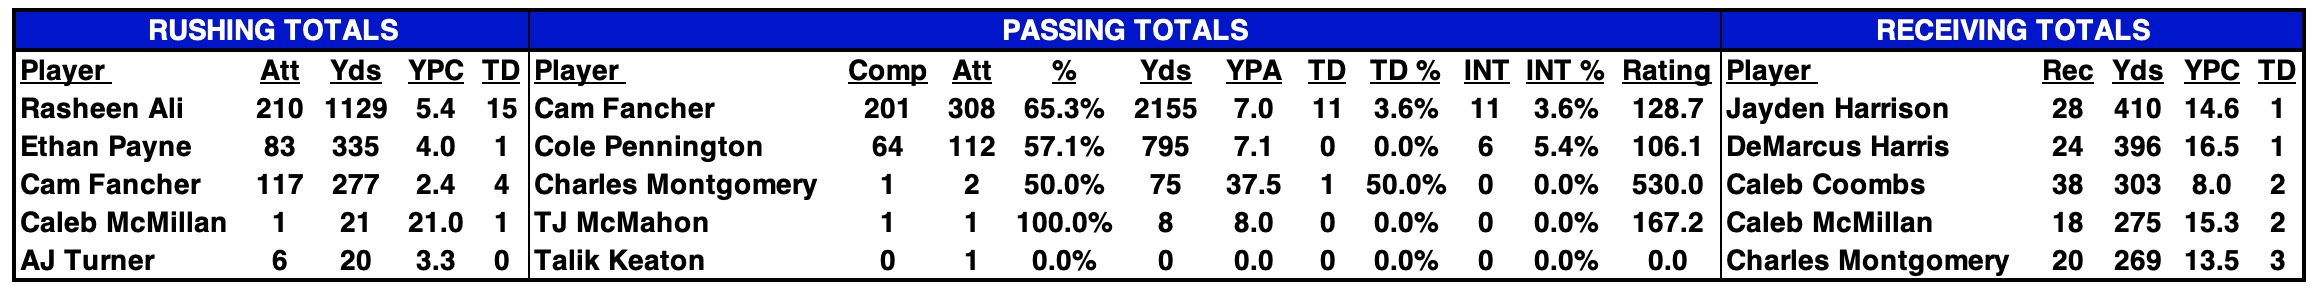
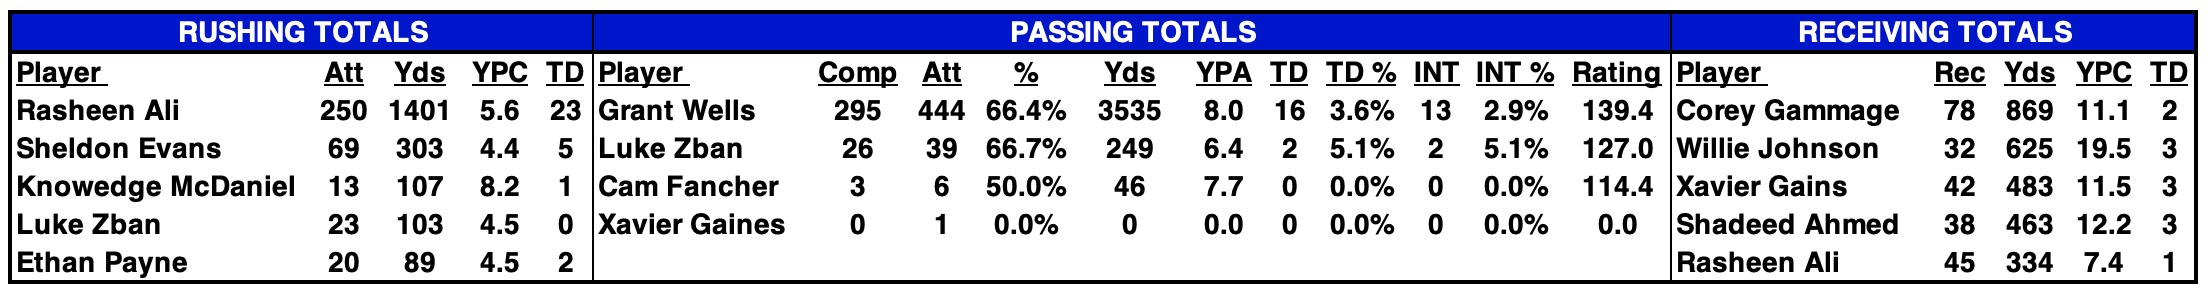
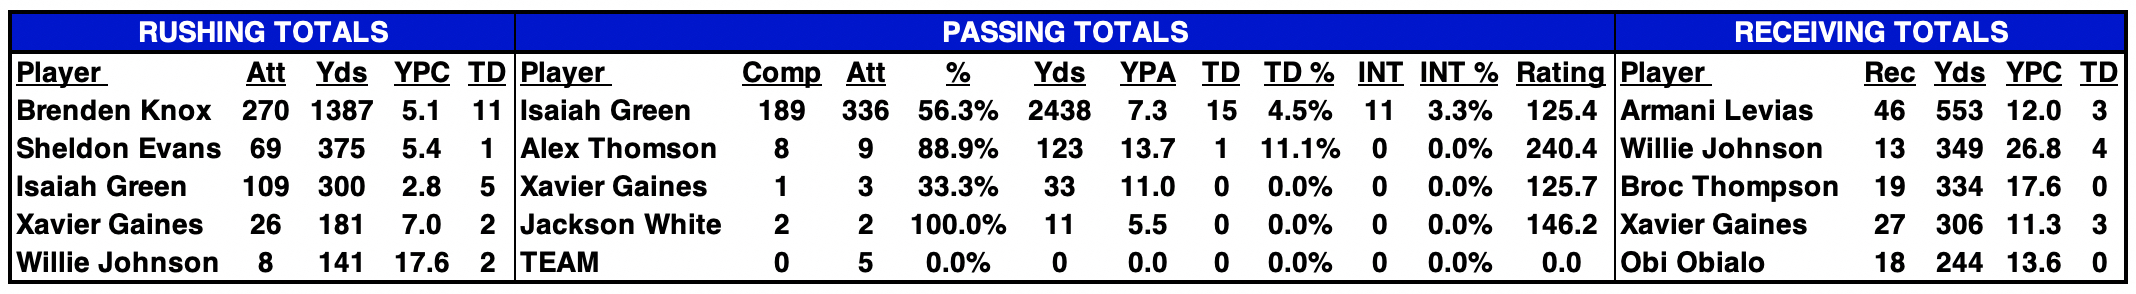
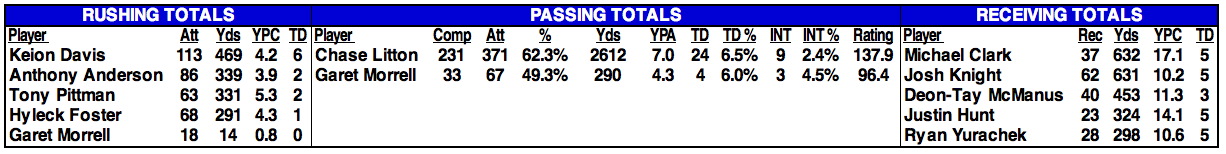
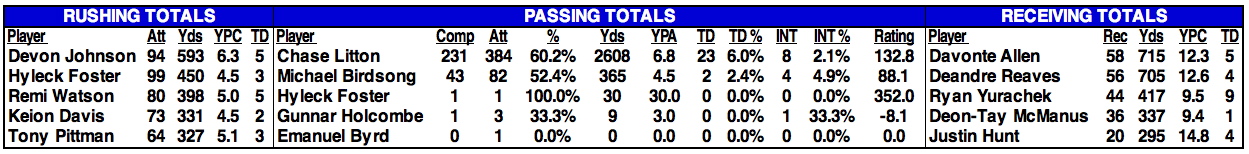
| 2025 STATISTICAL LEADERS |
|---|
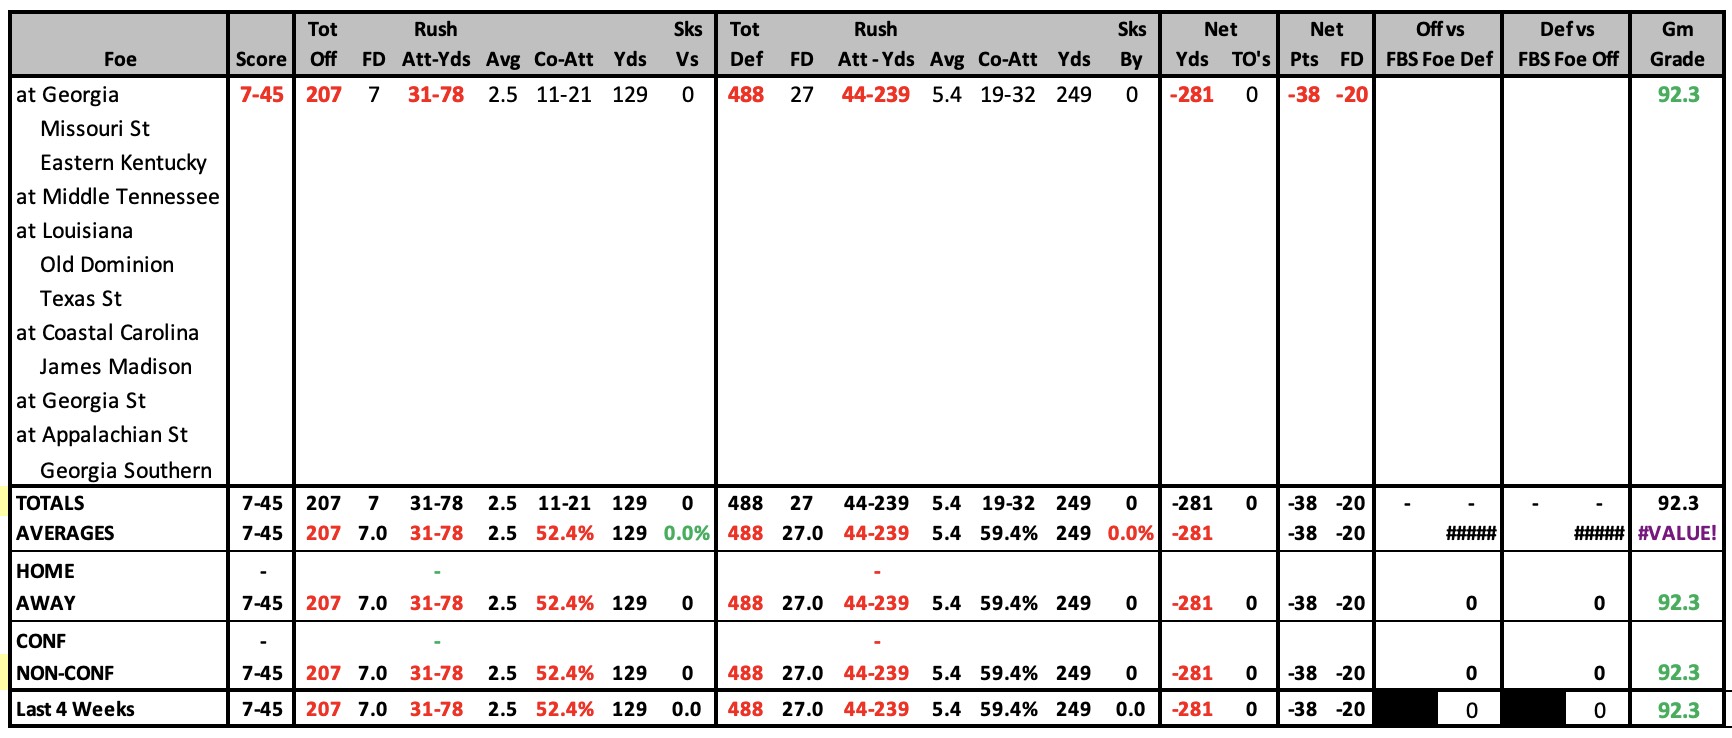
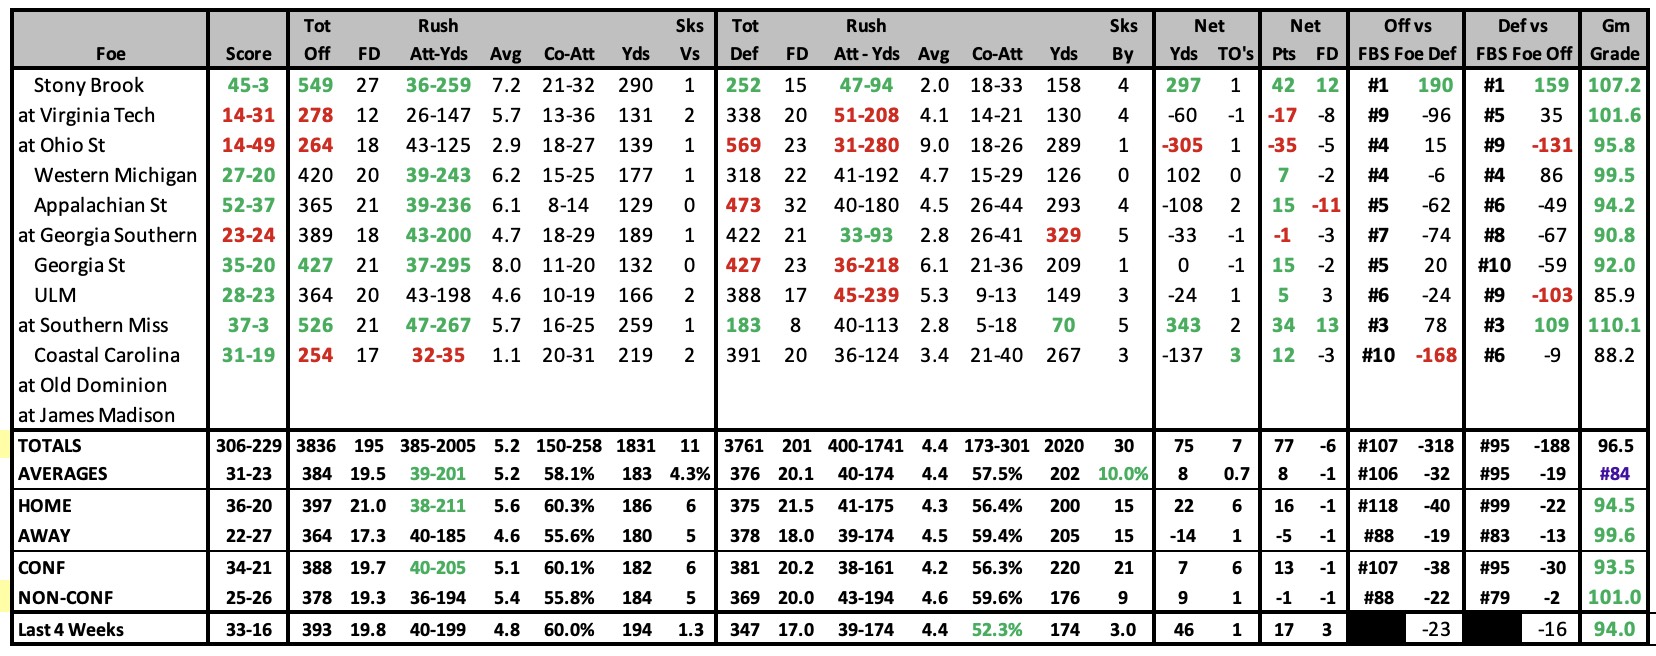
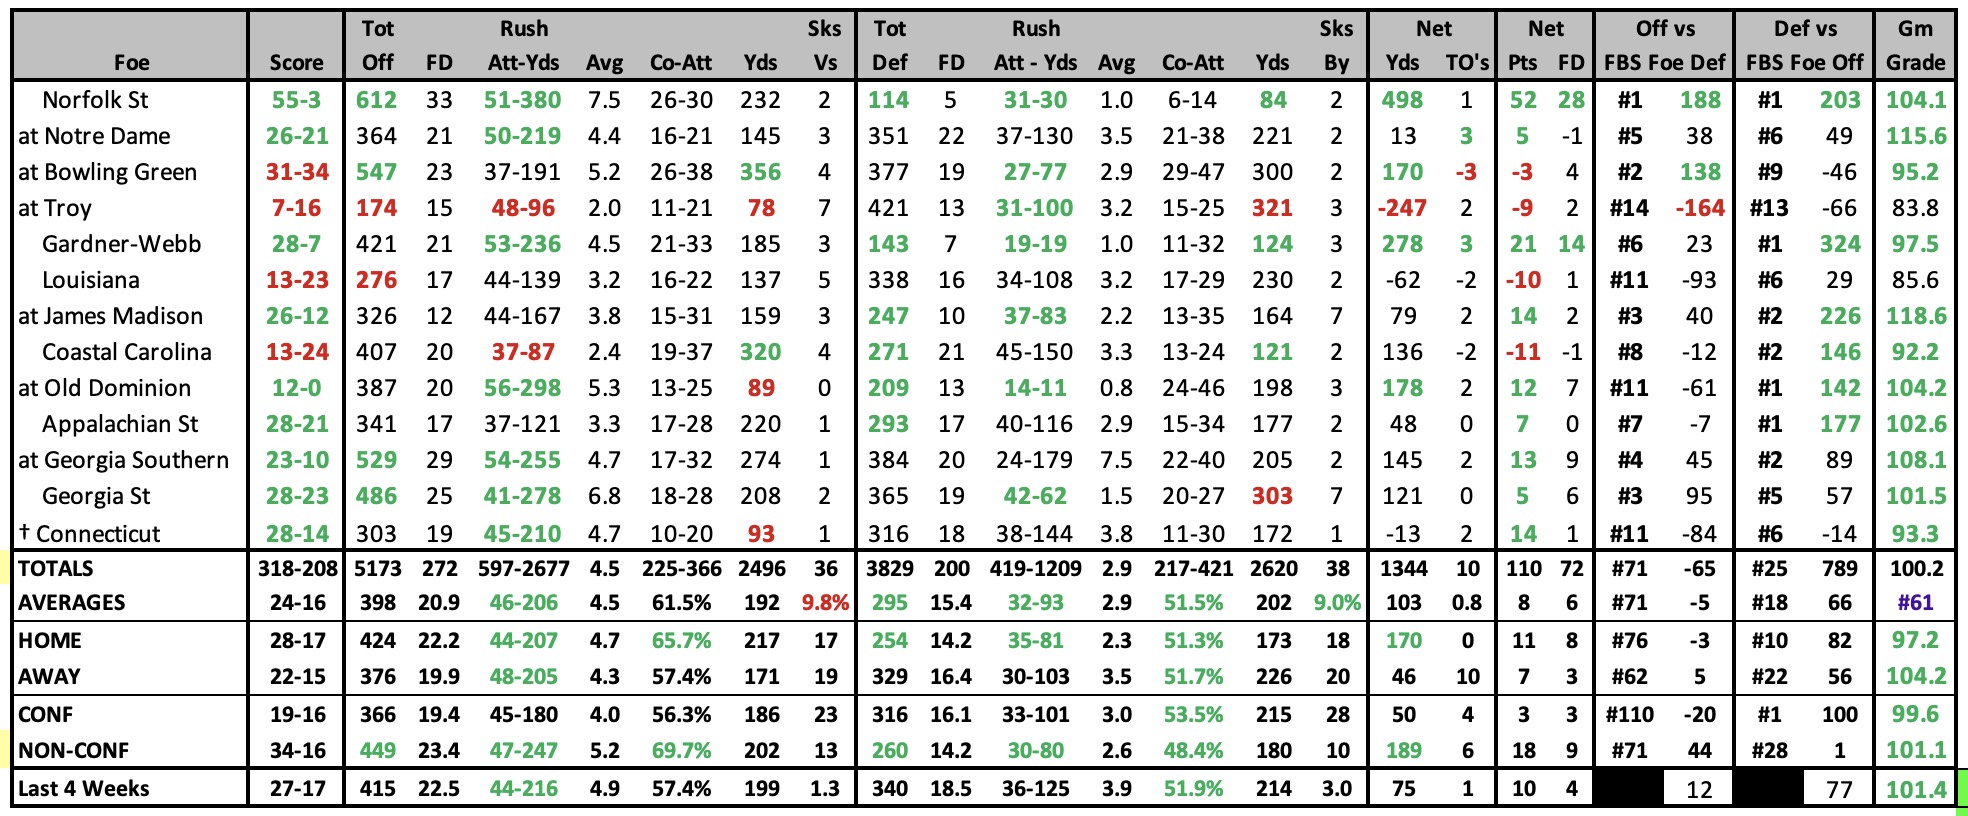
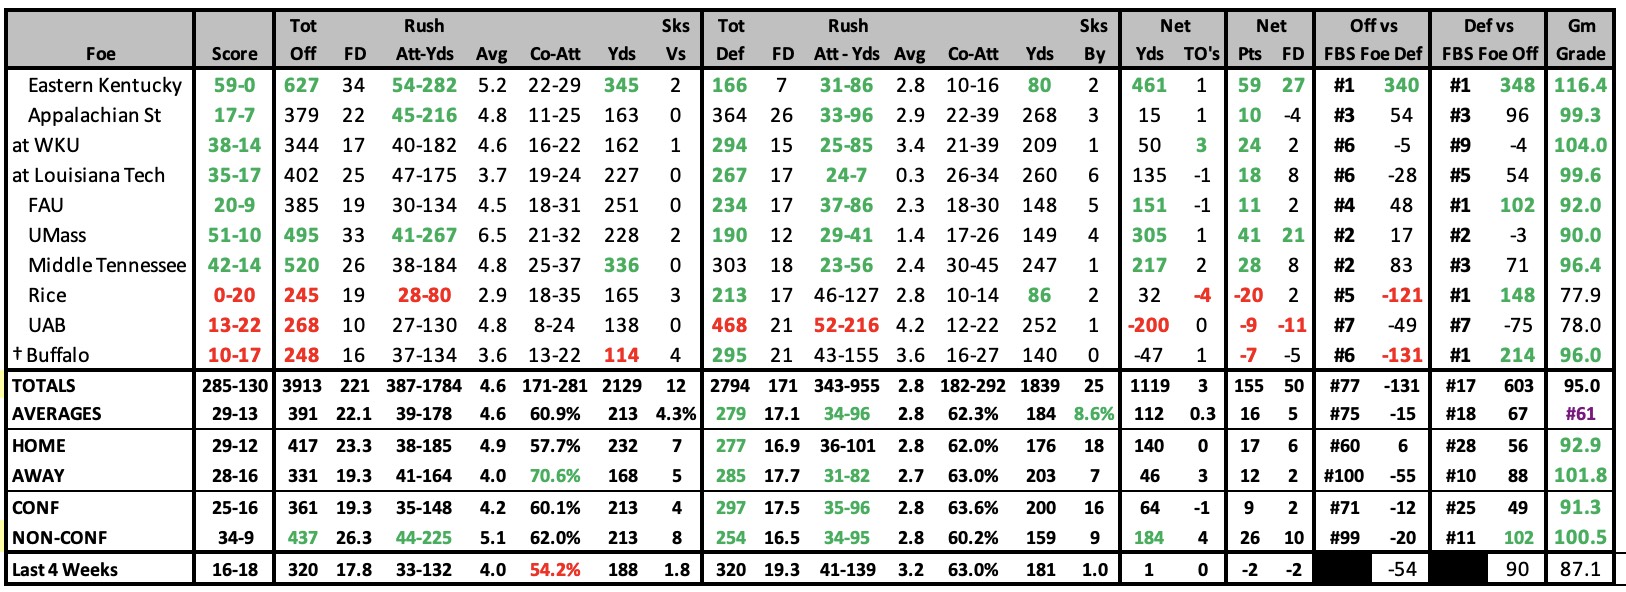
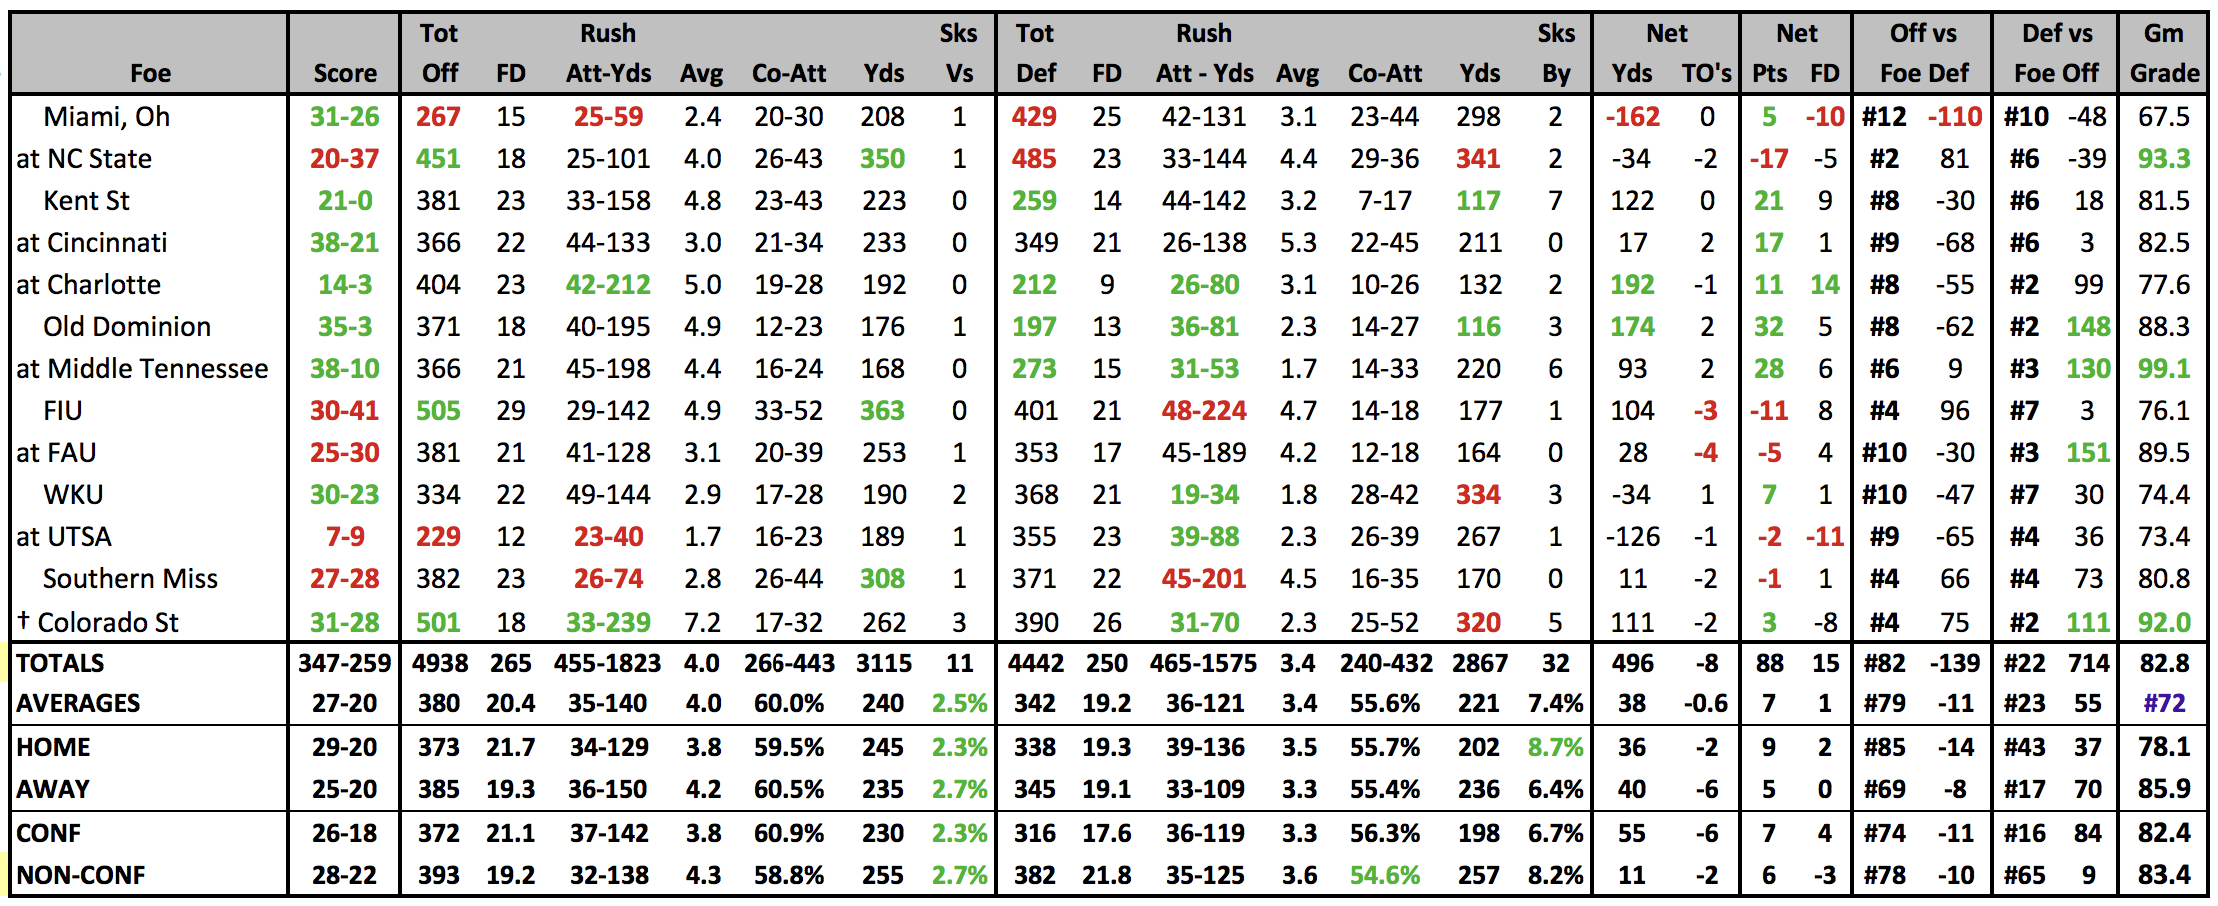
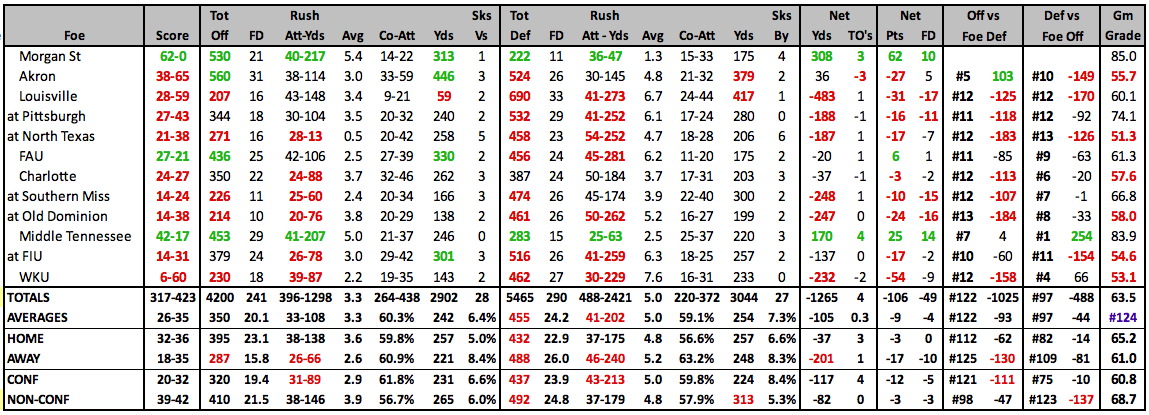
| 2025 GAME BY GAME STATS |
|---|
 |
2025 SCHEDULE |
2024 RESULTS |
||||||||||||||||||||||||||||||||||||||||||||||||||||||||||||||||||||||||||||||||||||||||||||||||||||||||||||||||||||||||||||||||||||||||||||||||||||||||||||||||||||||||||||||||||||||||||||||||||||||||||||
|
|
||||||||||||||||||||||||||||||||||||||||||||||||||||||||||||||||||||||||||||||||||||||||||||||||||||||||||||||||||||||||||||||||||||||||||||||||||||||||||||||||||||||||||||||||||||||||||||||||||||||||||||
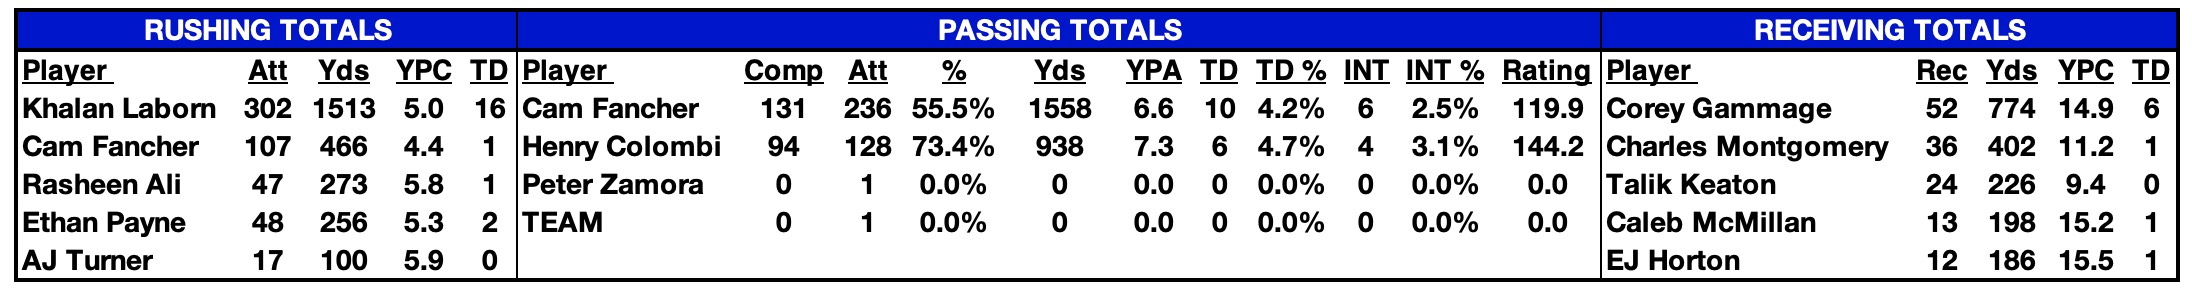
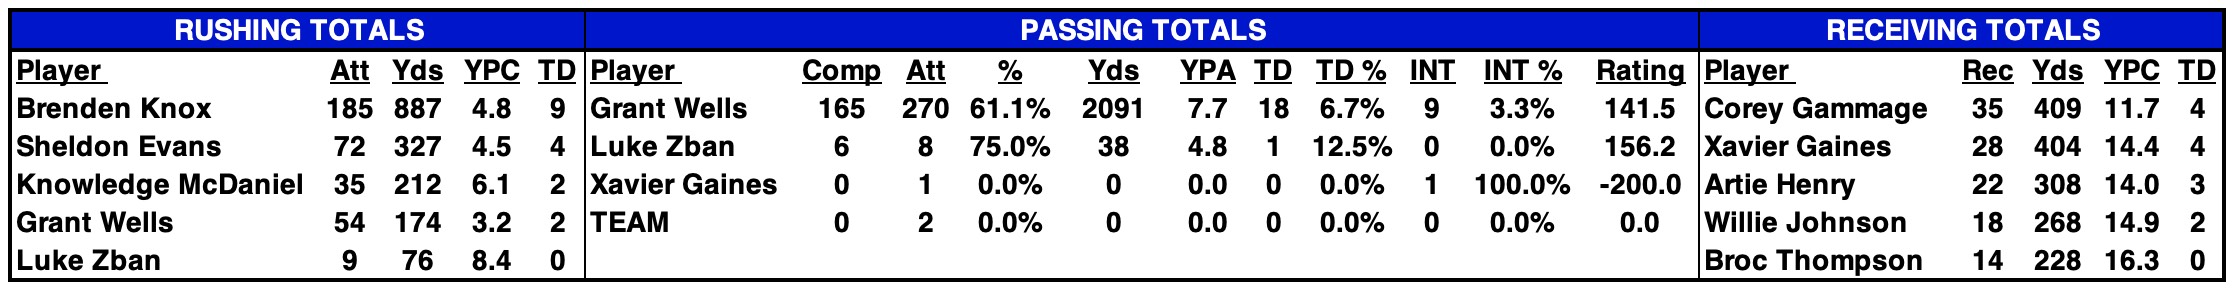
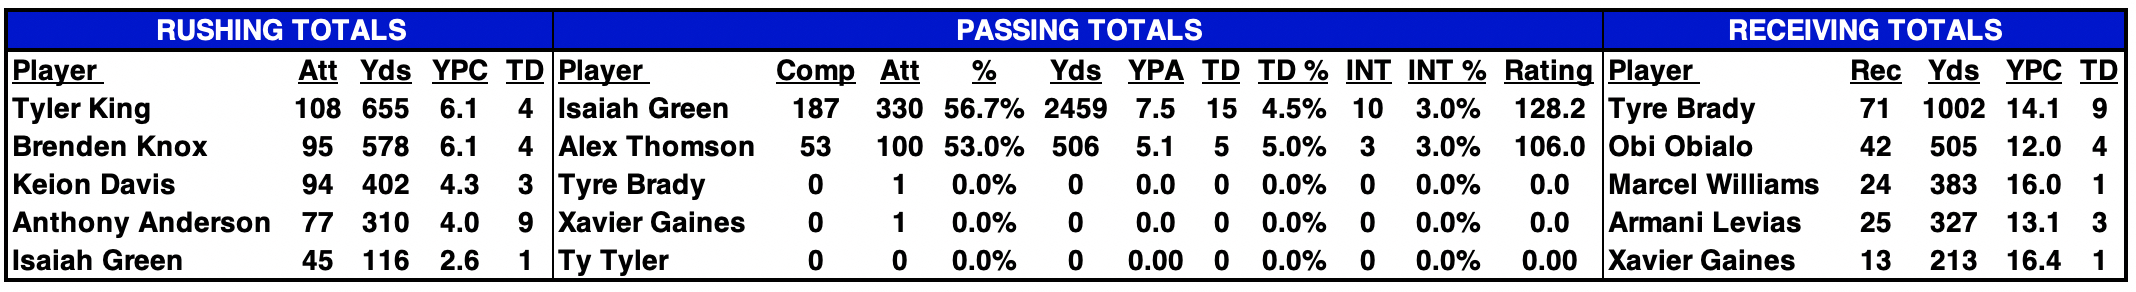
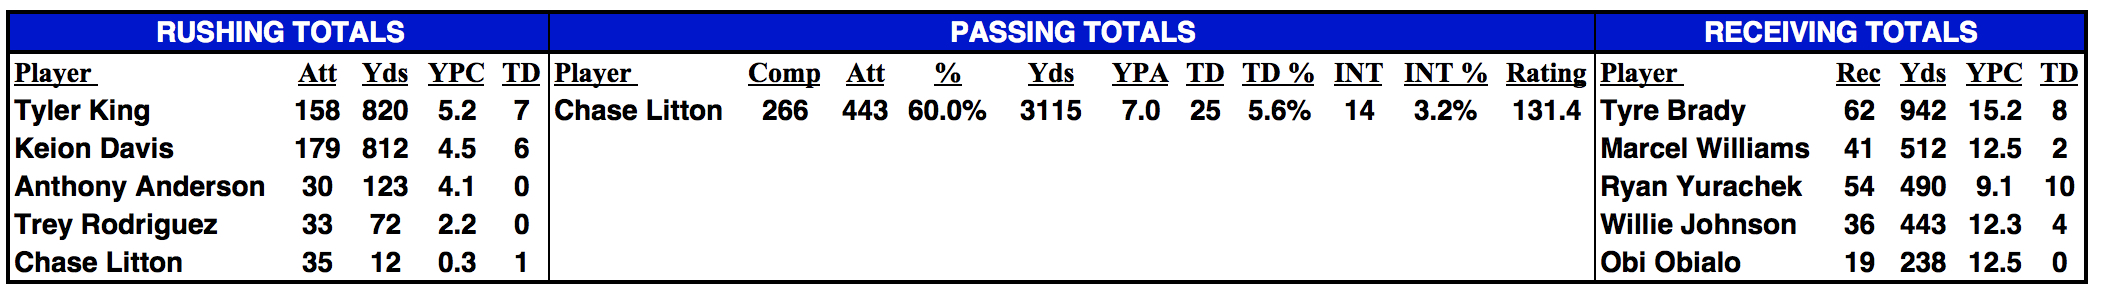
| 2024 STATISTICAL LEADERS |
|---|
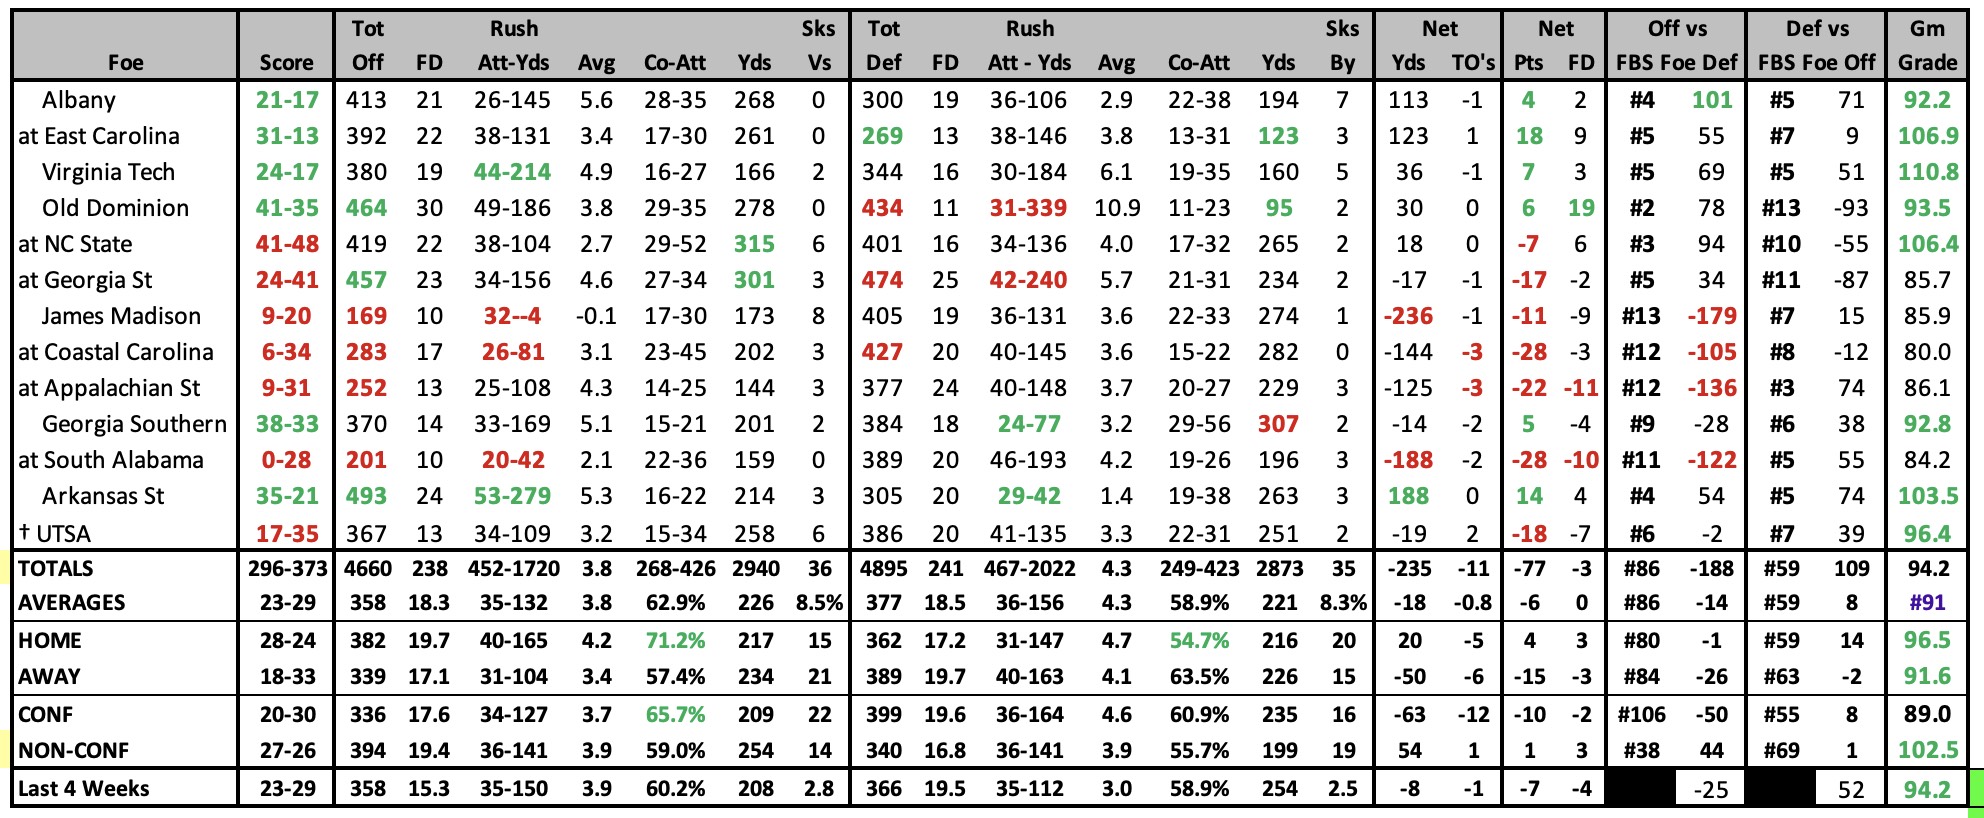
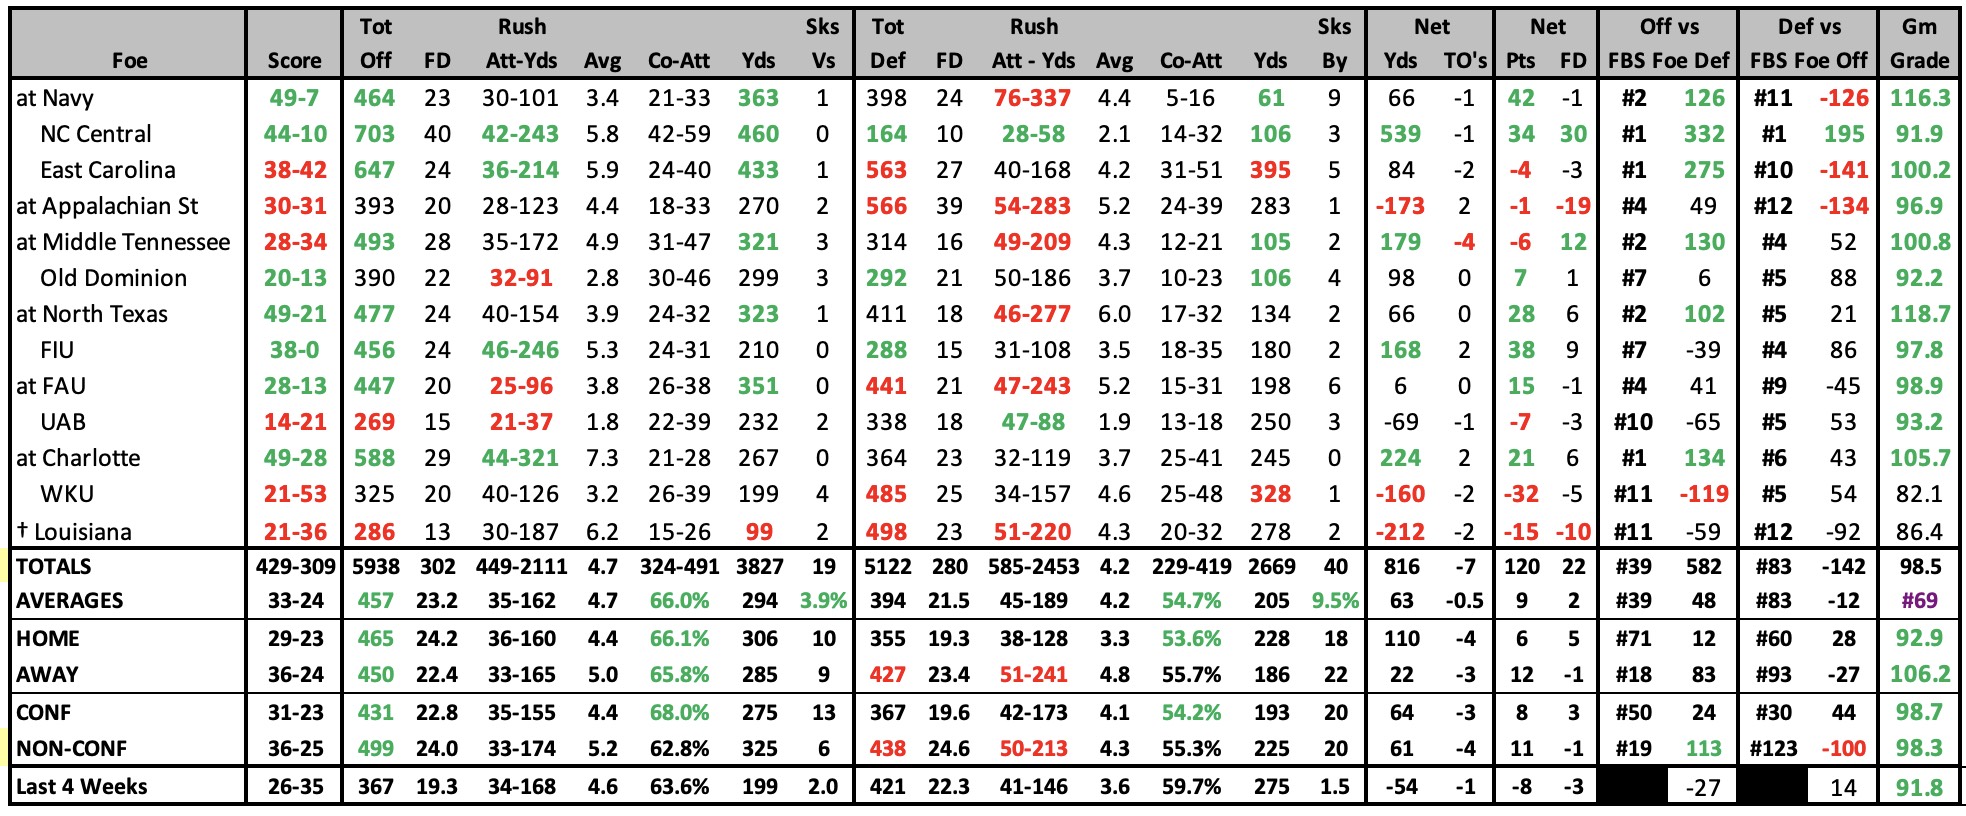
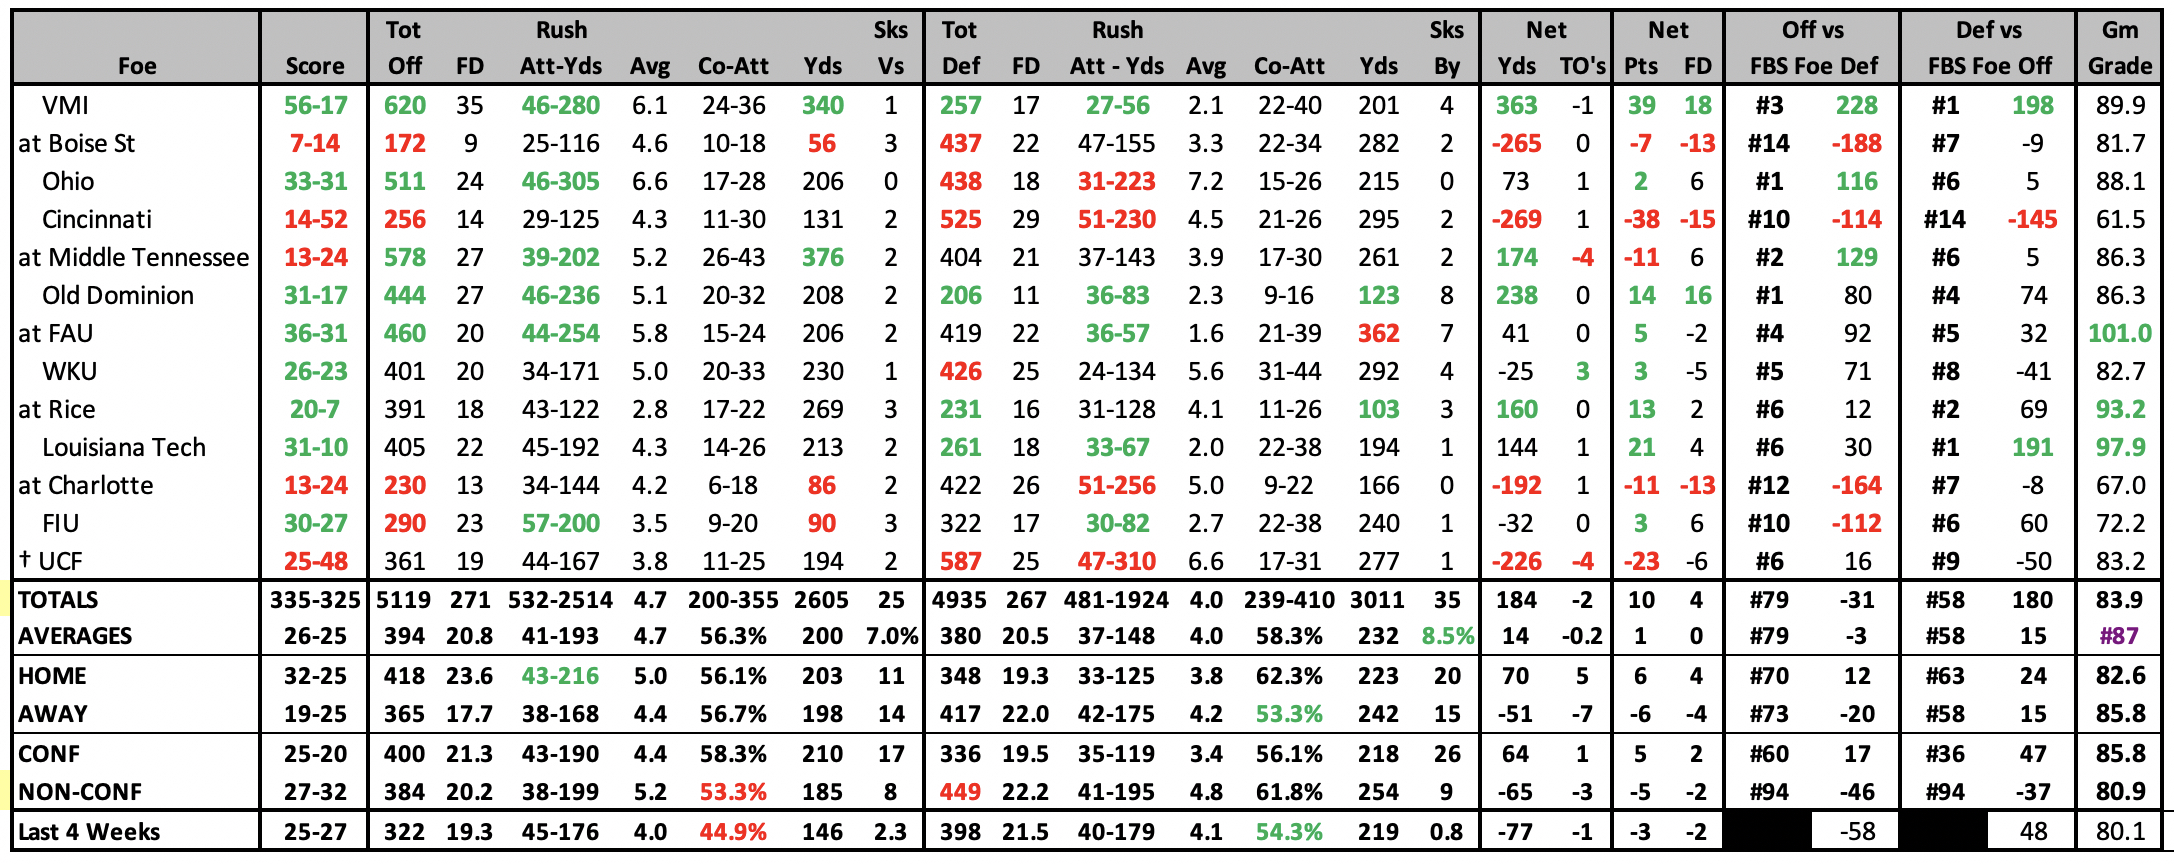
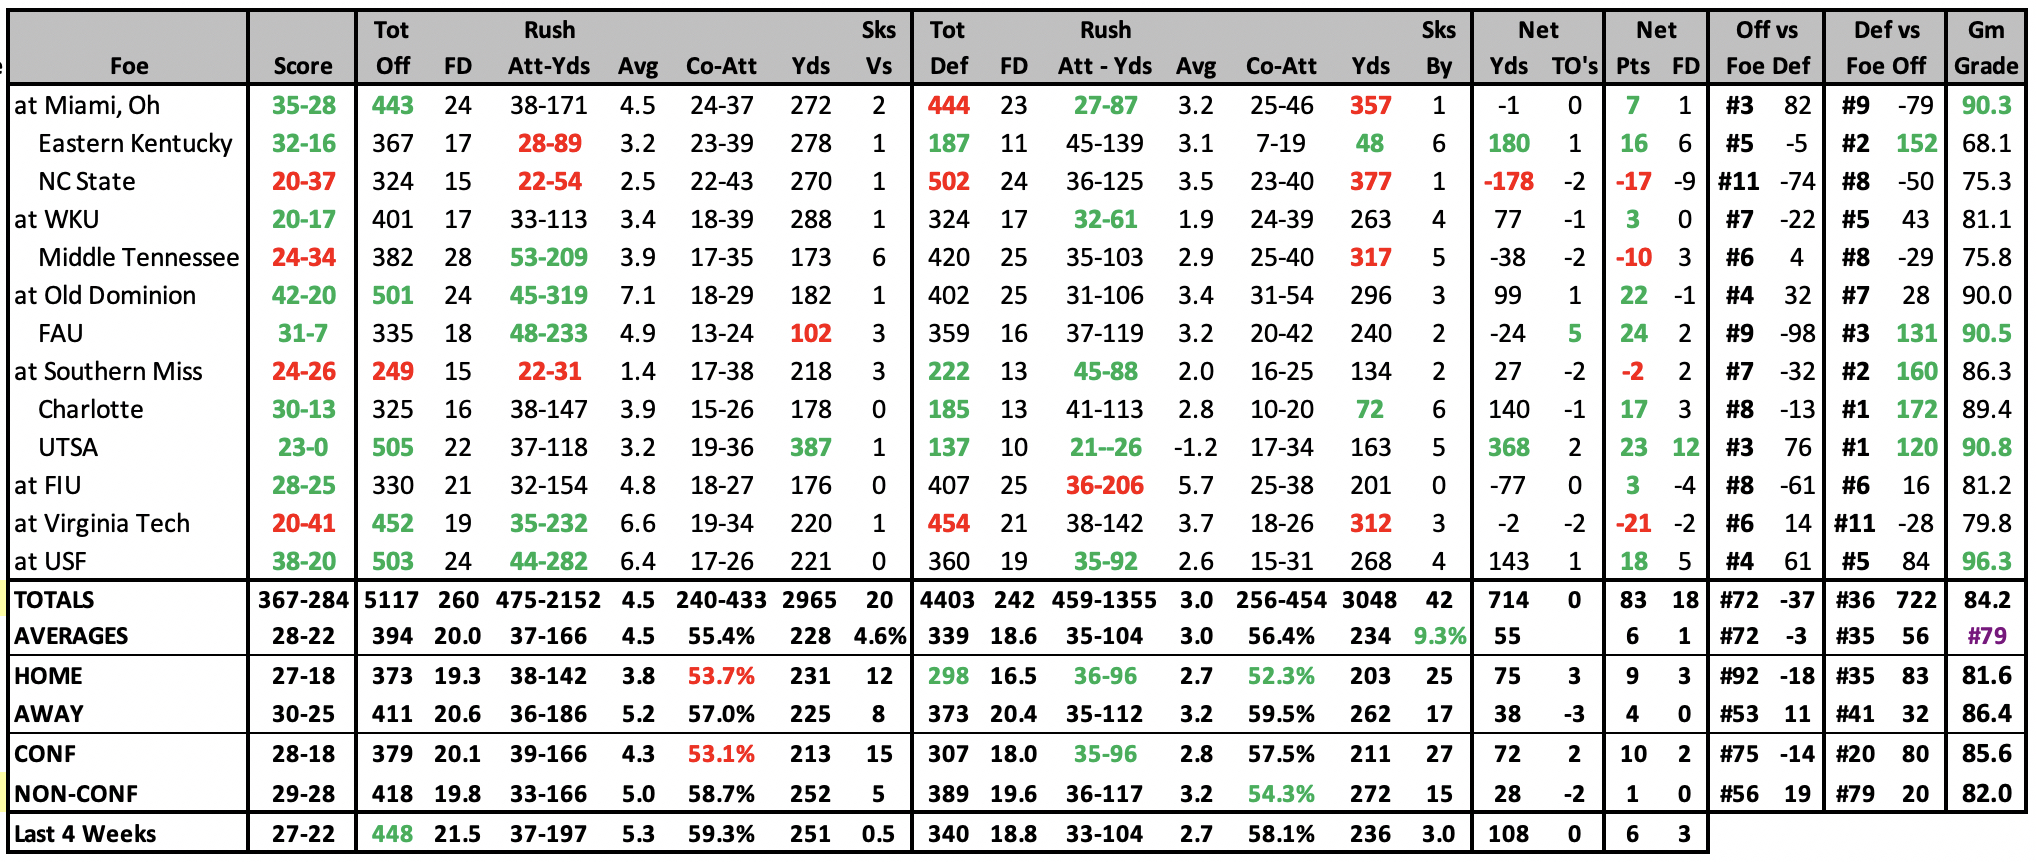
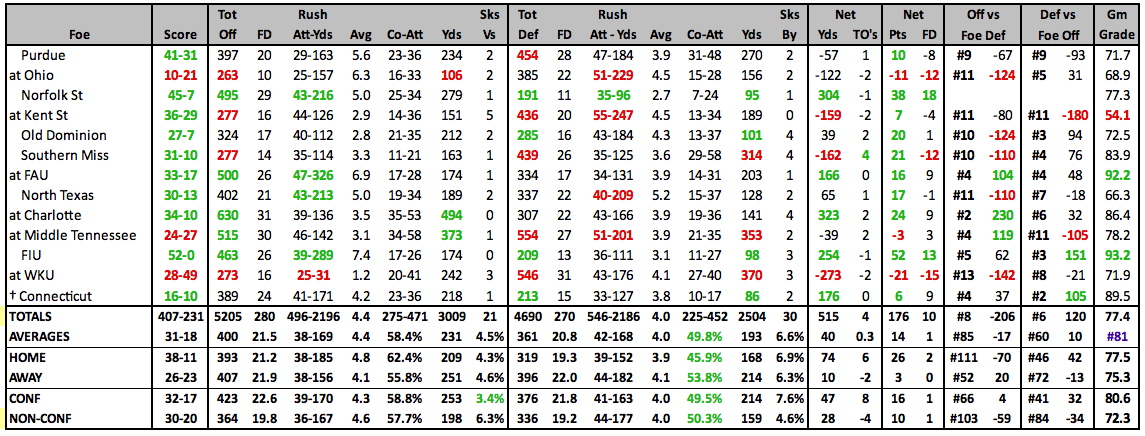
| 2024 GAME BY GAME STATS |
|---|
 |
2024 SCHEDULE |
2023 RESULTS |
||||||||||||||||||||||||||||||||||||||||||||||||||||||||||||||||||||||||||||||||||||||||||||||||||||||||||||||||||||||||||||||||||||||||||||||||||||||||||||||||||||||||||||||||||||||||||||||||||||||||||||
|
|
||||||||||||||||||||||||||||||||||||||||||||||||||||||||||||||||||||||||||||||||||||||||||||||||||||||||||||||||||||||||||||||||||||||||||||||||||||||||||||||||||||||||||||||||||||||||||||||||||||||||||||
| 2023 STATISTICAL LEADERS |
|---|
| 2023 GAME BY GAME STATS |
|---|
 |
2023 SCHEDULE |
2022 RESULTS |
||||||||||||||||||||||||||||||||||||||||||||||||||||||||||||||||||||||||||||||||||||||||||||||||||||||||||||||||||||||||||||||||||||||||||||||||||||||||||||||||||||||||||||||||||||||||||||||||||||||
|
|
||||||||||||||||||||||||||||||||||||||||||||||||||||||||||||||||||||||||||||||||||||||||||||||||||||||||||||||||||||||||||||||||||||||||||||||||||||||||||||||||||||||||||||||||||||||||||||||||||||||
| 2022 STATISTICAL LEADERS |
|---|
| 2022 GAME BY GAME STATS |
|---|
 |
2022 SCHEDULE |
2021 RESULTS |
||||||||||||||||||||||||||||||||||||||||||||||||||||||||||||||||||||||||||||||||||||||||||||||||||||||||||||||||||||||||||||||||||||||||||||||||||||||||||||||||||||||||||||||||||||||||||||||||||||||
|
|
||||||||||||||||||||||||||||||||||||||||||||||||||||||||||||||||||||||||||||||||||||||||||||||||||||||||||||||||||||||||||||||||||||||||||||||||||||||||||||||||||||||||||||||||||||||||||||||||||||||
| 2021 STATISTICAL LEADERS |
|---|
| 2021 GAME BY GAME STATS |
|---|
 |
2021 SCHEDULE |
2020 RESULTS |
||||||||||||||||||||||||||||||||||||||||||||||||||||||||||||||||||||||||||||||||||||||||||||||||||||||||||||||||||||||||||||||||||||||||||||||||||||||||||||||||||||||||||||||||||||||||||||||||||||||
|
|
||||||||||||||||||||||||||||||||||||||||||||||||||||||||||||||||||||||||||||||||||||||||||||||||||||||||||||||||||||||||||||||||||||||||||||||||||||||||||||||||||||||||||||||||||||||||||||||||||||||
| 2020 STATISTICAL LEADERS |
|---|
| 2020 GAME BY GAME STATS |
|---|
 |
2020 SCHEDULE |
2019 RESULTS |
||||||||||||||||||||||||||||||||||||||||||||||||||||||||||||||||||||||||||||||||||||||||||||||||||||||||||||||||||||||||||||||||||||||||||||||||||||||||||||||||||||||||||||||||||||||||||||||||||||||||||||||||||
|
|
||||||||||||||||||||||||||||||||||||||||||||||||||||||||||||||||||||||||||||||||||||||||||||||||||||||||||||||||||||||||||||||||||||||||||||||||||||||||||||||||||||||||||||||||||||||||||||||||||||||||||||||||||
| 2019 STATISTICAL LEADERS |
|---|
| 2019 GAME BY GAME STATS |
|---|
 |
2019 SCHEDULE |
2018 RESULTS |
|||||||||||||||||||||||||||||||||||||||||||||||||||||||||||||||||||||||||||||||||||||||||||||||||||||||||||||||||||||||||||||||||||||||||||||||||||||||||||||||||||||||||||||||||||||||||||||||||||||||||||||||||||||||||||||||||||
|
|
|||||||||||||||||||||||||||||||||||||||||||||||||||||||||||||||||||||||||||||||||||||||||||||||||||||||||||||||||||||||||||||||||||||||||||||||||||||||||||||||||||||||||||||||||||||||||||||||||||||||||||||||||||||||||||||||||||
| 2018 STATISTICAL LEADERS |
|---|
| 2018 GAME BY GAME STATS |
|---|
 |
2018 SCHEDULE |
2017 RESULTS |
|||||||||||||||||||||||||||||||||||||||||||||||||||||||||||||||||||||||||||||||||||||||||||||||||||||||||||||||||||||||||||||||||||||||||||||||||||||||||||||||||||||||||||||||||||||||||||||||||||||||||||||||||||||||||||||||||||||||
|
|
|||||||||||||||||||||||||||||||||||||||||||||||||||||||||||||||||||||||||||||||||||||||||||||||||||||||||||||||||||||||||||||||||||||||||||||||||||||||||||||||||||||||||||||||||||||||||||||||||||||||||||||||||||||||||||||||||||||||
| 2017 STATISTICAL LEADERS |
|---|
| 2017 GAME BY GAME STATS |
|---|
 |
2017 SCHEDULE |
2016 RESULTS |
|||||||||||||||||||||||||||||||||||||||||||||||||||||||||||||||||||||||||||||||||||||||||||||||||||||||||||||||||||||||||||||||||||||||||||||||||||||||||||||||||||||||||||||||||||||||||||||||||||||||||||||||||||||||||
|
|
|||||||||||||||||||||||||||||||||||||||||||||||||||||||||||||||||||||||||||||||||||||||||||||||||||||||||||||||||||||||||||||||||||||||||||||||||||||||||||||||||||||||||||||||||||||||||||||||||||||||||||||||||||||||||
| 2016 STATISTICAL LEADERS |
|---|
| 2016 GAME BY GAME STATS |
|---|
 |
| 2015 STATISTICAL LEADERS |
|---|
| 2015 GAME BY GAME STATS |
|---|
 |
2015 SCHEDULE |
2014 RESULTS |
||||||||||||||||||||||||||||||||||||||||||||||||||||||||||||||||||||||||||||||||||||||||||||||||||||||||||||||||||||||||||||||||||||||||||||||||||||||||||||||||||||||||||||||||||||||||||||||||||||||||||||||||||||||||||||||||||||||||||||||||||||||||||||||||||||||||||
|
|
||||||||||||||||||||||||||||||||||||||||||||||||||||||||||||||||||||||||||||||||||||||||||||||||||||||||||||||||||||||||||||||||||||||||||||||||||||||||||||||||||||||||||||||||||||||||||||||||||||||||||||||||||||||||||||||||||||||||||||||||||||||||||||||||||||||||||
| 2014 STATISTICAL LEADERS |
|---|
| 2014 GAME BY GAME STATS |
|---|
 |
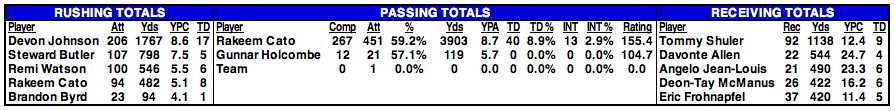
| 2013 STATISTICAL LEADERS |
|---|
| Player | Att | Yds | YPC | TD | Player | Comp | Att | % | Yds | YPA | TD | INT | Rating | Player | Rec | Yds | YPC | TD |
| Essray Taliaferro | 221 | 1140 | 5.2 | 10 | Rakeem Cato | 298 | 499 | 59.7% | 3916 | 7.8 | 39 | 10 | 147.4 | Tommy Shuler | 106 | 1165 | 11.0 | 10 |
| Steward Butler | 87 | 765 | 8.8 | 7 | Blake Frohnapfel | 17 | 22 | 77.3% | 206 | 9.4 | 3 | 1 | 191.8 | Gator Hoskins | 50 | 821 | 16.4 | 15 |
| Kevin Grooms | 91 | 503 | 5.5 | 6 | Devon Smith | 39 | 653 | 16.7 | 4 |
| 2013 GAME BY GAME STATS |
|---|
 |
2013 RESULTS |
2012 RESULTS |
||||||||||||||||||||||||||||||||||||||||||||||||||||||||||||||||||||||||||||||||||||||||||||||||||||||||||||||||||||||||||||||||||||||||||||||||||||||||||||||||||||||||||||||||||||||||||||||||||||||||||||||||||||||||||||||||||||||||||||||||||||||||||||||||||||||||||||||||||||||||||||
|
|
||||||||||||||||||||||||||||||||||||||||||||||||||||||||||||||||||||||||||||||||||||||||||||||||||||||||||||||||||||||||||||||||||||||||||||||||||||||||||||||||||||||||||||||||||||||||||||||||||||||||||||||||||||||||||||||||||||||||||||||||||||||||||||||||||||||||||||||||||||||||||||
| 2012 STATISTICAL LEADERS |
|---|
| Player | Att | Yds | YPC | TD | Player | Comp | Att | % | Yds | YPA | TD | INT | Rating | Player | Rec | Yds | YPC | TD | ||
| Kevin Grooms | 121 | 737 | 6.1 | 8 | Rakeem Cato | 406 | 584 | 69.5% | 4201 | 7.2 | 37 | 11 | 147.1 | Tommy Shuler | 110 | 1138 | 10.3 | 6 | ||
| Steward Butler | 101 | 500 | 5.0 | 3 | Blake Frohnapfel | 18 | 23 | 78.3% | 180 | 7.8 | 2 | 1 | 164.0 | Antavious Wilson | 69 | 741 | 10.7 | 9 | ||
| Remi Watson | 79 | 380 | 4.8 | 7 | Aaron Dobson | 57 | 679 | 11.9 | 3 |
| 2012 Individual Player Stats • 2012 Start Chart/Starters Lost |
|---|
| 2012 GAME BY GAME STATS |
|---|
 |
| 2011 STATISTICAL LEADERS |
|---|
| Player | Att | Yds | YPC | TD | Player | Comp | Att | % | Yds | YPA | TD | INT | Rating | Player | Rec | Yds | YPC | TD | ||
| Tron Martinez | 160 | 649 | 4.1 | 3 | Rakeem Cato | 182 | 304 | 59.9% | 2059 | 6.8 | 15 | 11 | 125.8 | Aaron Dobson | 49 | 668 | 13.6 | 12 | ||
| Travon Van | 143 | 551 | 3.9 | 3 | AJ Graham | 64 | 103 | 62.1% | 714 | 6.9 | 7 | 4 | 135.0 | Antavious Wilson | 29 | 462 | 15.9 | 1 | ||
| AJ Graham | 40 | 237 | 5.9 | 3 | Troy Evans | 30 | 337 | 11.2 | 2 |
| 2011 Individual Player Stats •2011 Start Chart/ Starters Lost |
|---|
| 2011 GAME BY GAME STATS |
|---|
2011 RESULTS |
2010 RESULTS |
|||||||||||||||||||||||||||||||||||||||||||||||||||||||||||||||||||||||||||||||||||||||||||||||||||||||||||||||||||||||||||||||||||||||||||||||||||||||||||||||||||||||||||||||||||||||
|
|
|||||||||||||||||||||||||||||||||||||||||||||||||||||||||||||||||||||||||||||||||||||||||||||||||||||||||||||||||||||||||||||||||||||||||||||||||||||||||||||||||||||||||||||||||||||||
| 2010 STATISTICAL LEADERS |
|---|
| Player | Att | Yds | YPC | TD | Player | Comp | Att | % | Yds | YPA | TD | INT | Rating | Player | Rec | Yds | YPC | TD | ||
| Martin Ward | 96 | 345 | 3.59 | 1 | Brian Anderson | 218 | 384 | 56.8% | 2358 | 6.1 | 20 | 15 | 117.7 | Aaron Dobson | 44 | 689 | 15.7 | 5 | ||
| Andre Booker | 67 | 264 | 3.94 | 1 | Eddie Sullivan | 6 | 24 | 25.0% | 134 | 5.6 | 1 | 0 | 85.7 | Lee Smith | 38 | 358 | 9.4 | 3 | ||
| Tron Martinez | 78 | 262 | 3.36 | 1 | AJ Graham | 10 | 12 | 83.3% | 95 | 7.9 | 0 | 0 | 149.8 | Antavious Wilson | 29 | 342 | 11.8 | 5 |
| 2010 Individual Player Stats |
|---|
| 2010 GAME BY GAME STATS |
|---|
| 2009 STATISTICAL LEADERS |
|---|
| Player | Att | Yds | YPC | TD | Player | Comp | Att | % | Yds | YPA | TD | INT | Rating | Player | Rec | Yds | YPC | TD | ||
| Darius Marshall | 207 | 1054 | 5.09 | 11 | Brian Anderson | 206 | 353 | 58.4% | 2324 | 6.6 | 13 | 12 | 119.0 | Antavio Wilson | 57 | 706 | 12.4 | 3 | ||
| Martin Ward | 72 | 318 | 4.42 | 1 | Darius Marshall | 14 | 29 | 48.3% | 264 | 9.1 | 1 | 1 | 129.2 | Cody Slate | 50 | 607 | 12.1 | 4 | ||
| T Edwards-Maye | 54 | 212 | 3.93 | 3 | Press Taylor | 1 | 3 | 33.3% | 10 | 3.3 | 0 | 0 | 61.3 | Aaron Dobson | 15 | 362 | 24.1 | 4 |
| 2009 Individual Player Stats |
|---|
| 2009 GAME BY GAME STATS |
|---|
2009 RESULTS |
2008 RESULTS |
|||||||||||||||||||||||||||||||||||||||||||||||||||||||||||||||||||||||||||||||||||||||||||||||||||||||||||||||||||||||||||||||||||||||||||||||||||||||||||
|
|
|||||||||||||||||||||||||||||||||||||||||||||||||||||||||||||||||||||||||||||||||||||||||||||||||||||||||||||||||||||||||||||||||||||||||||||||||||||||||||
| 2008 Individual Player Stats • 2007 Individual Player Stats |
|---|