
MISSOURI TIGERS |
|
STADIUM: Faurot Field at Memorial Stadium PLAYING SURFACE: FieldTurf • CAPACITY: 61,620 STARTERS RETURNING (O/D): 6/9 LETTERMAN RETURNING: 35 (14,19,2) • LETTERMAN LOST: 30 (15,13,2) |
 |
|
| LOCATION: Columbia, MO | |
| FOUNDED: 1839 | |
| ENROLLMENT: 23,533 | |
| COLORS: Old Gold & Black | |
| MASCOT: Truman the Tiger | |
| CONFERENCE: SEC | |
| HEAD COACH: Eliah Drinkwitz | |
| YEARS WITH TM: 6th | |
| OVERALL RECORD: 50-25 | |
| RECORD With TM: 38-24 |
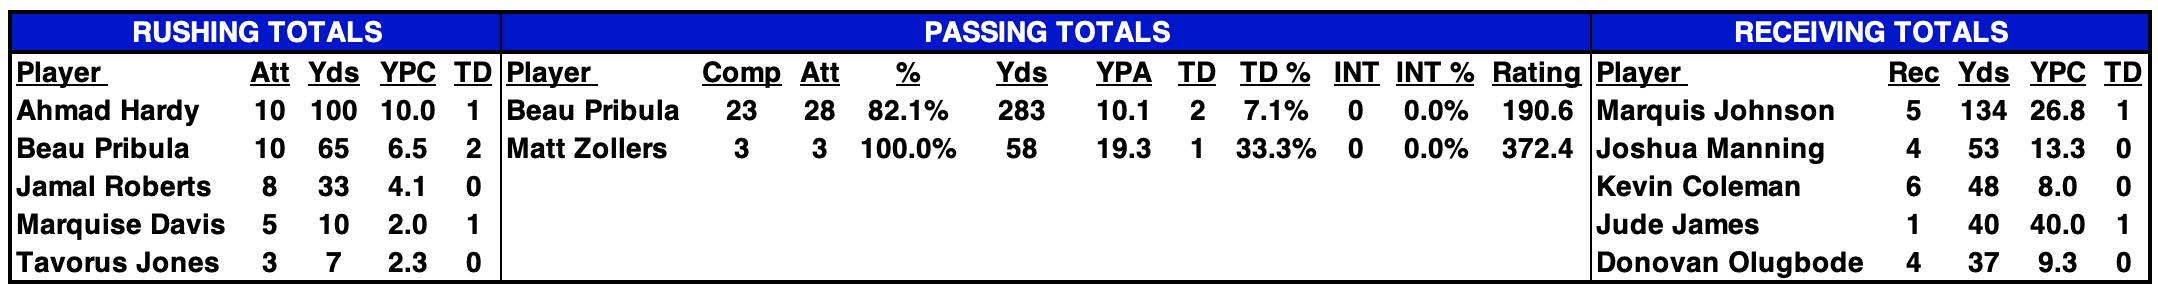
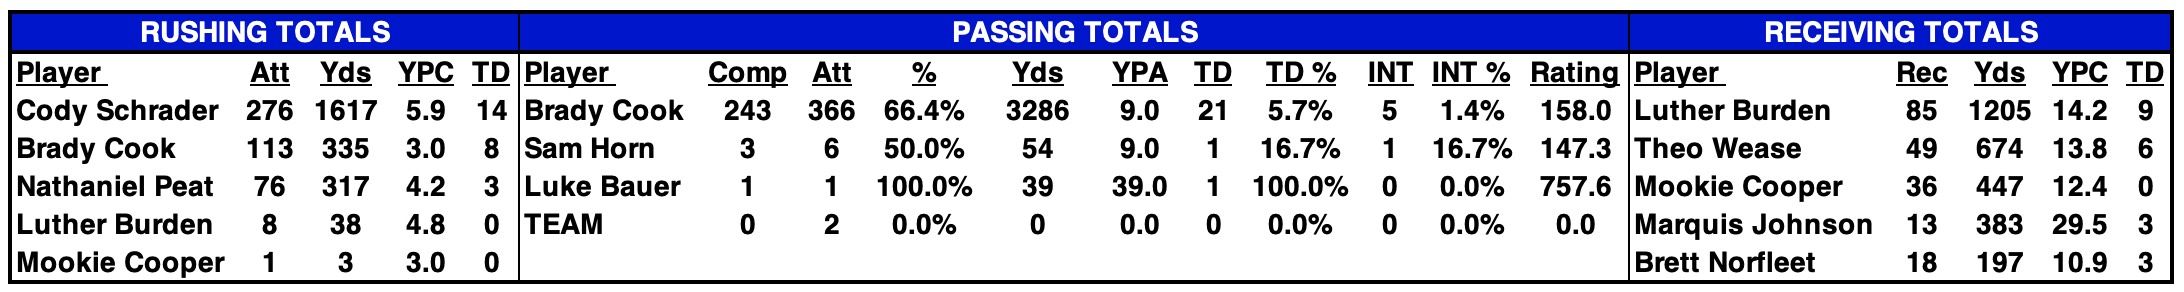
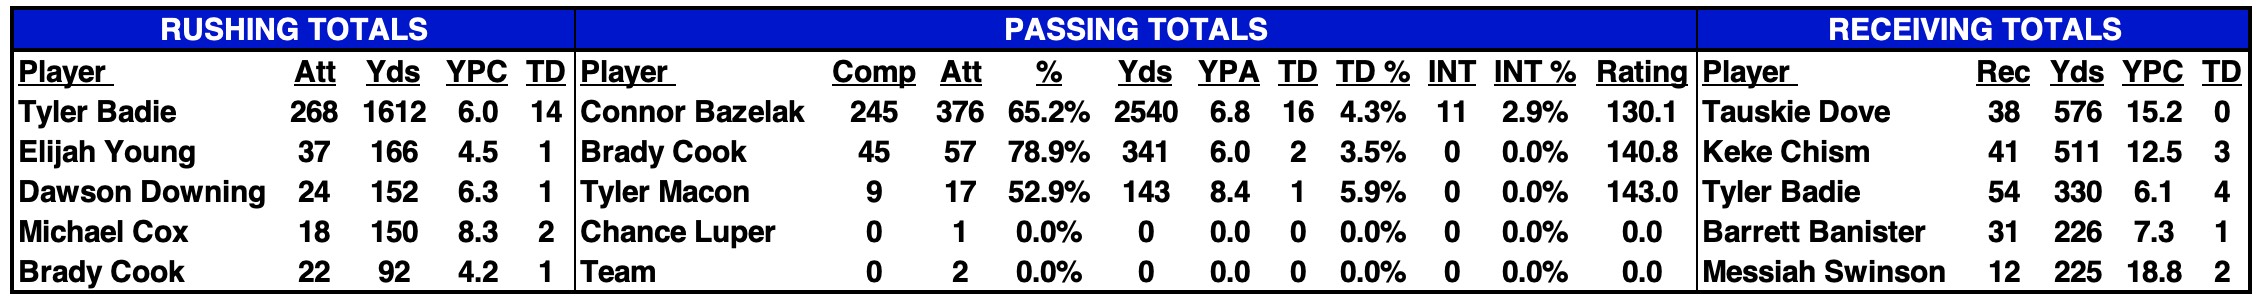
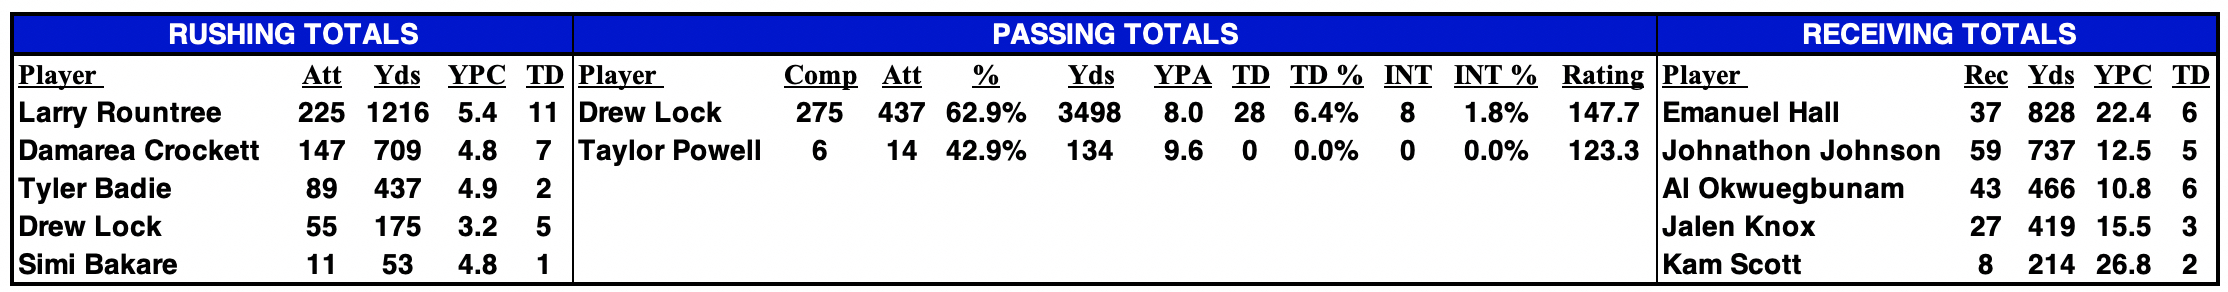
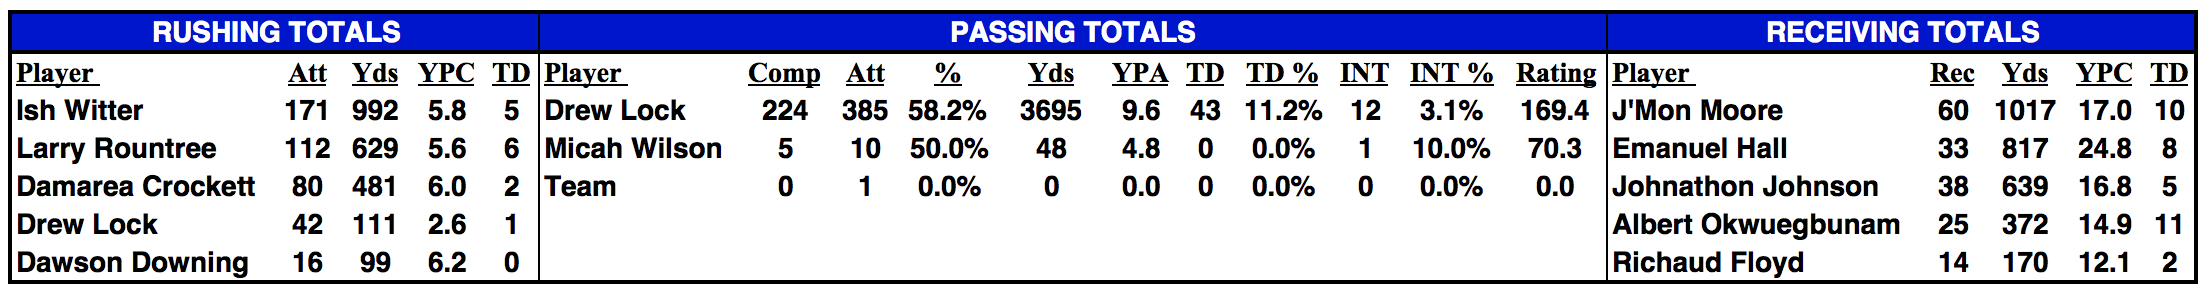
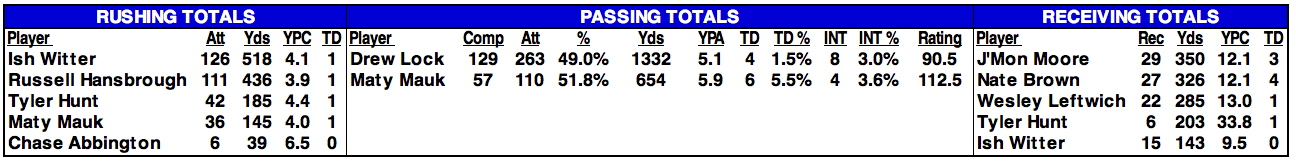
2025 STATISTICAL LEADERS |
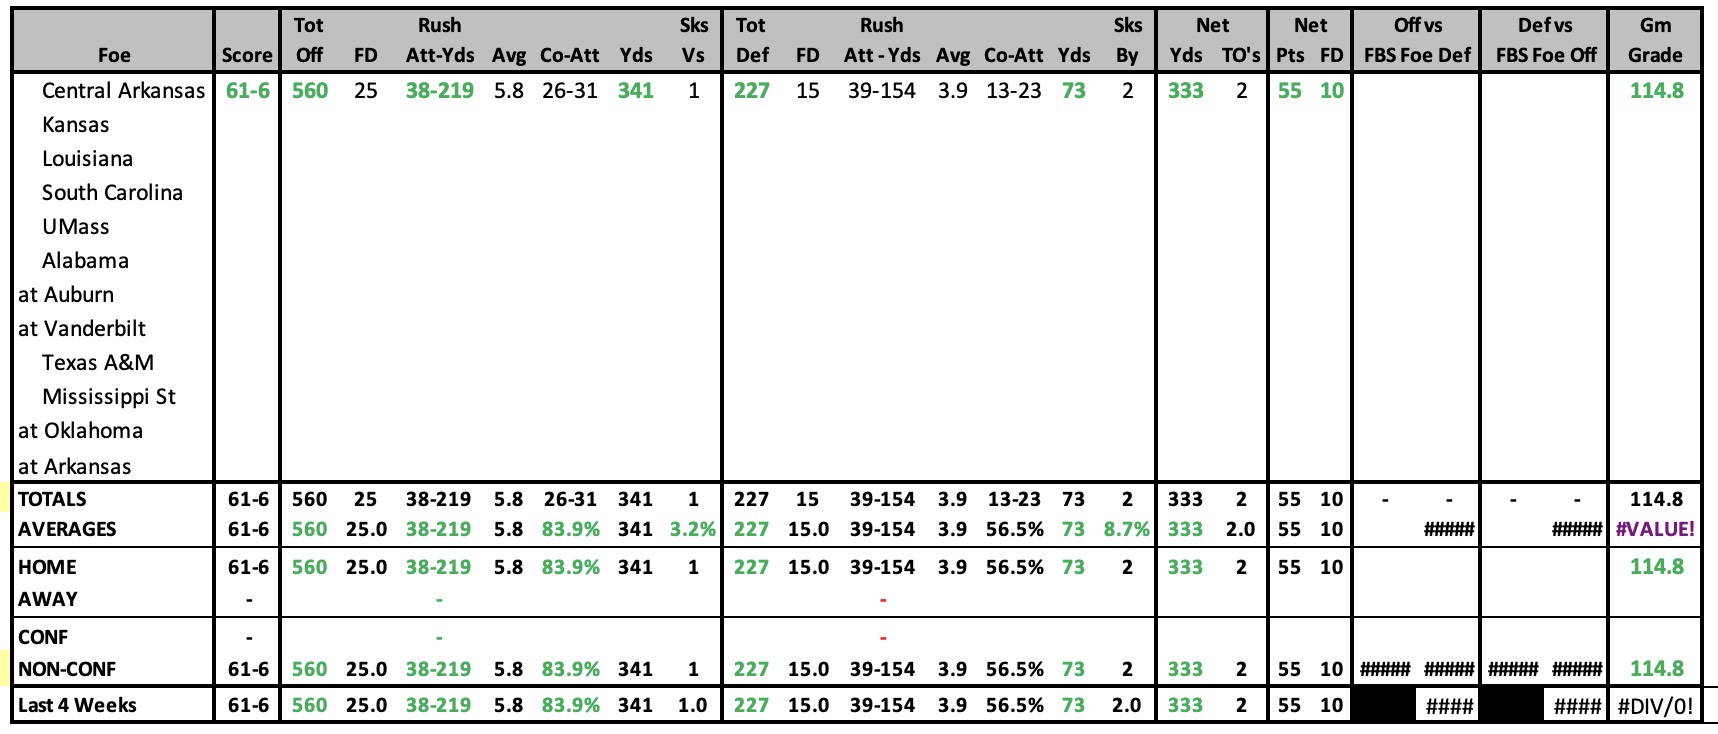
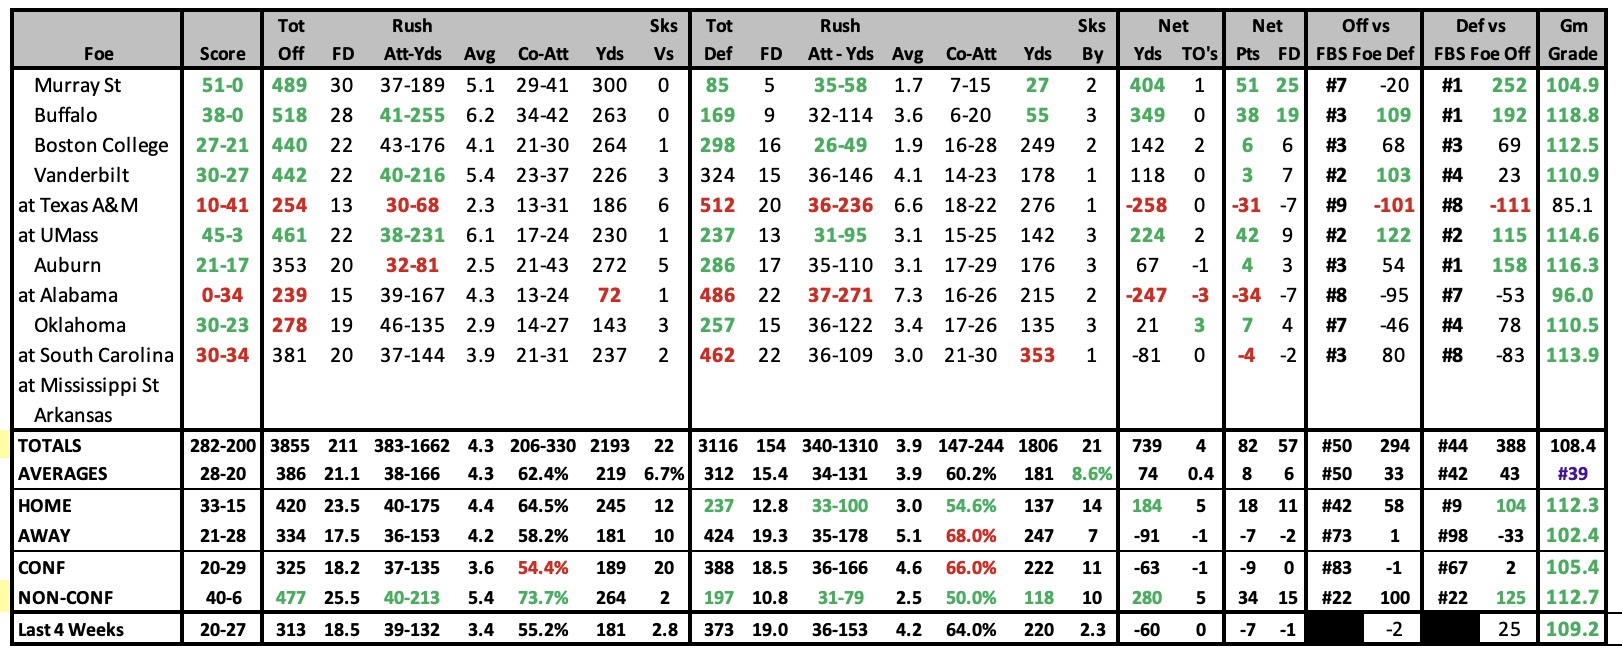
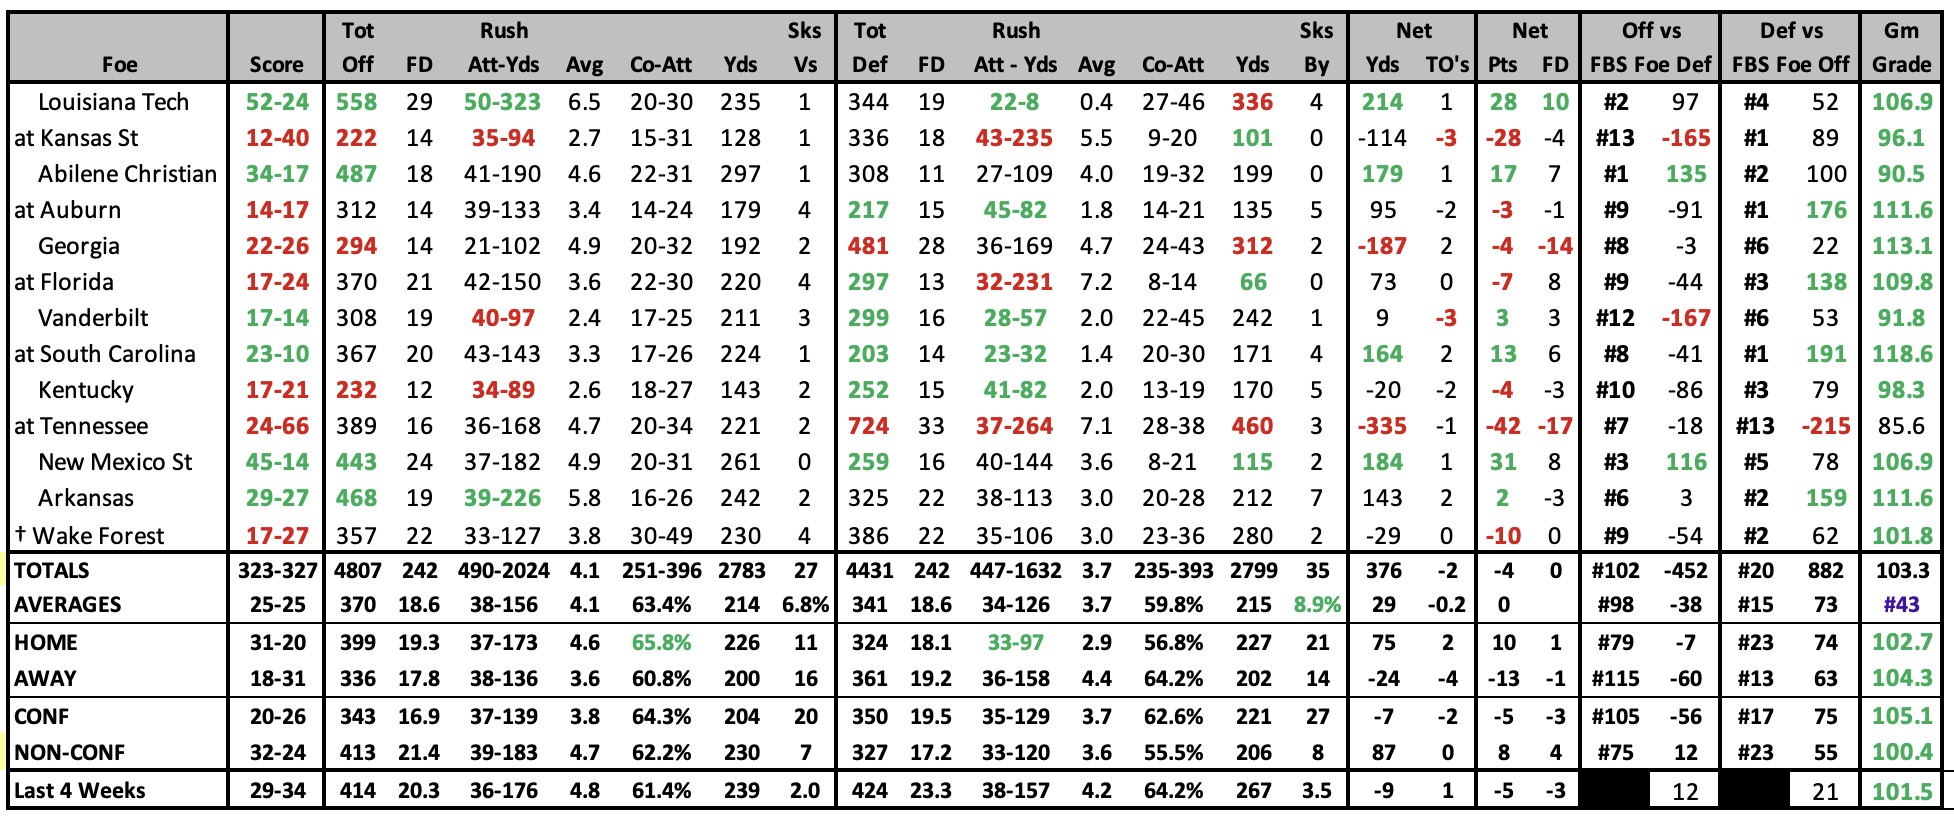
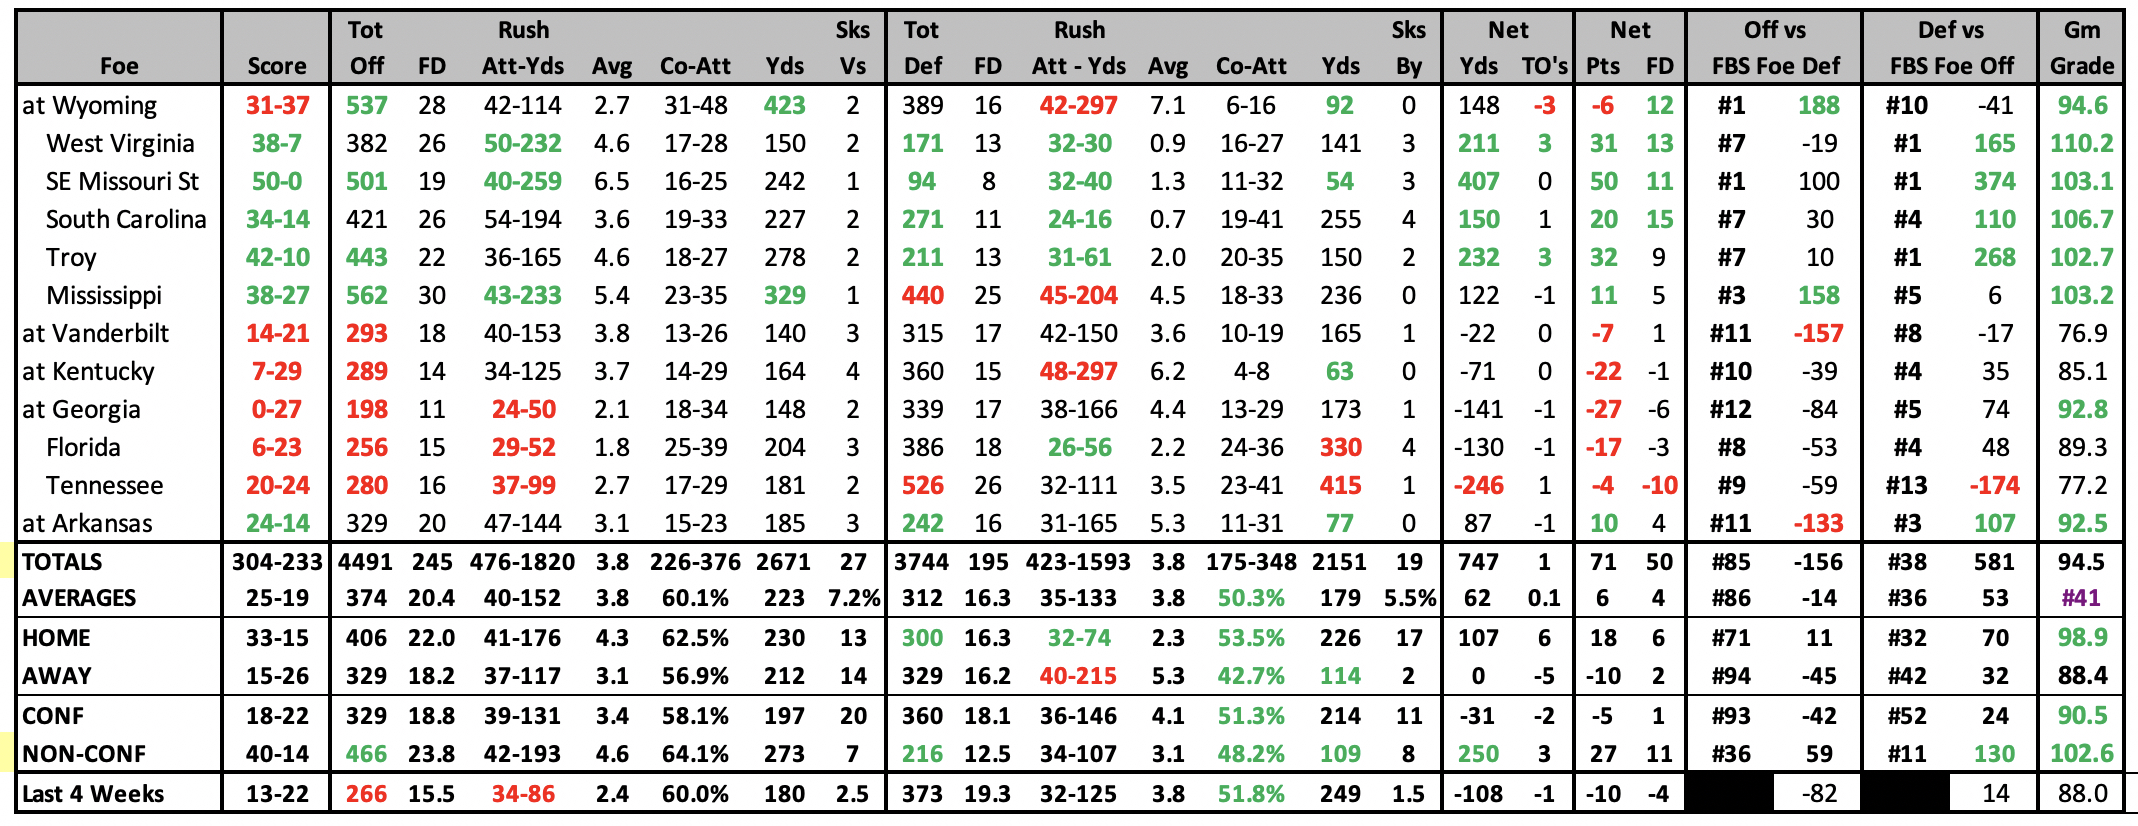
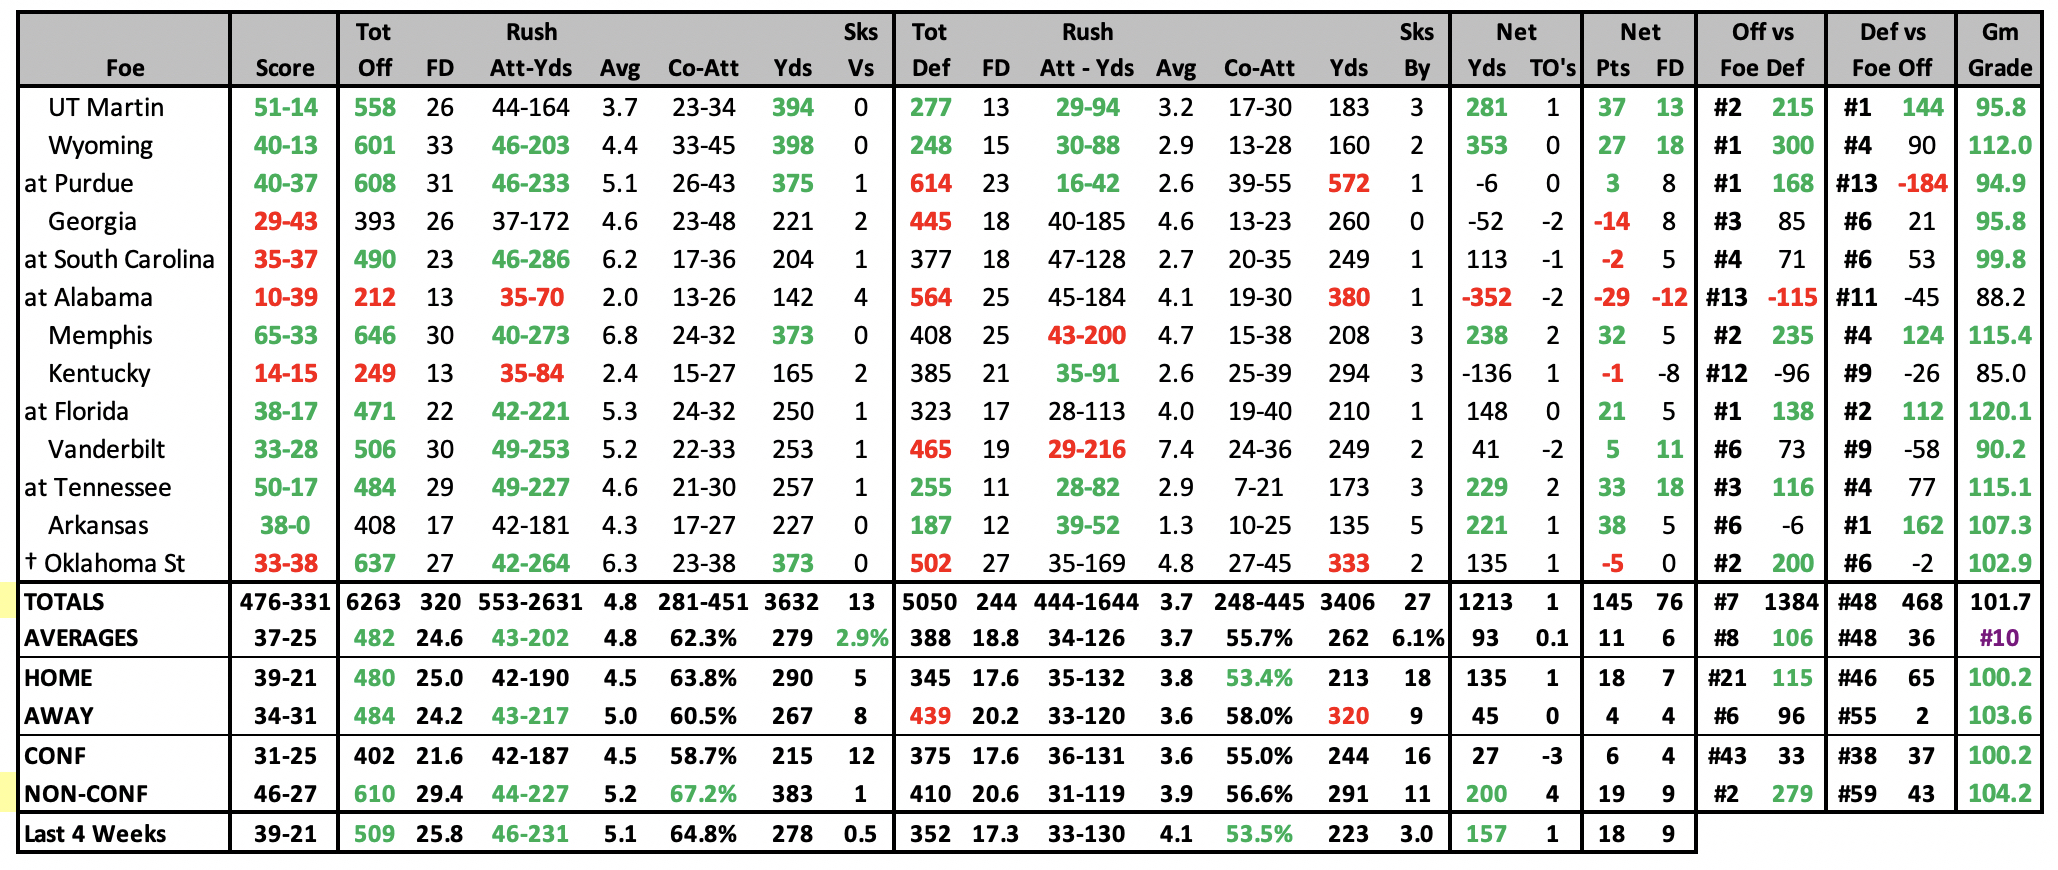
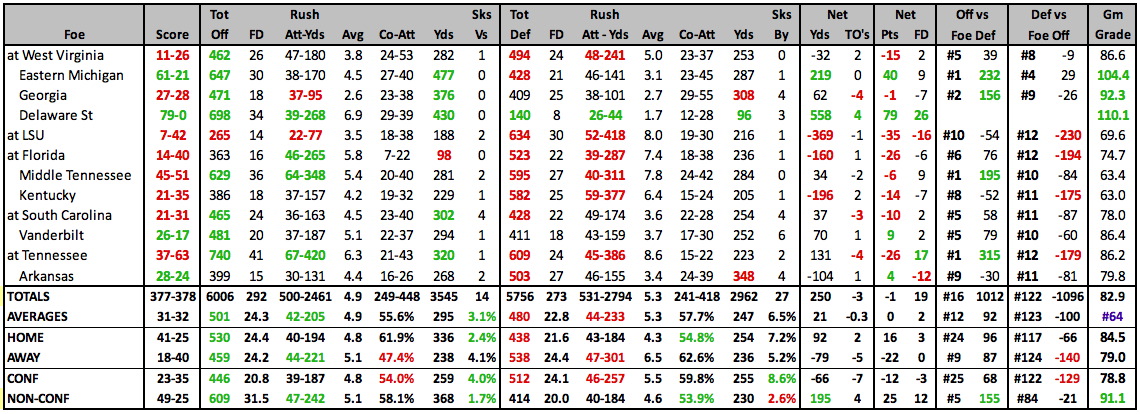
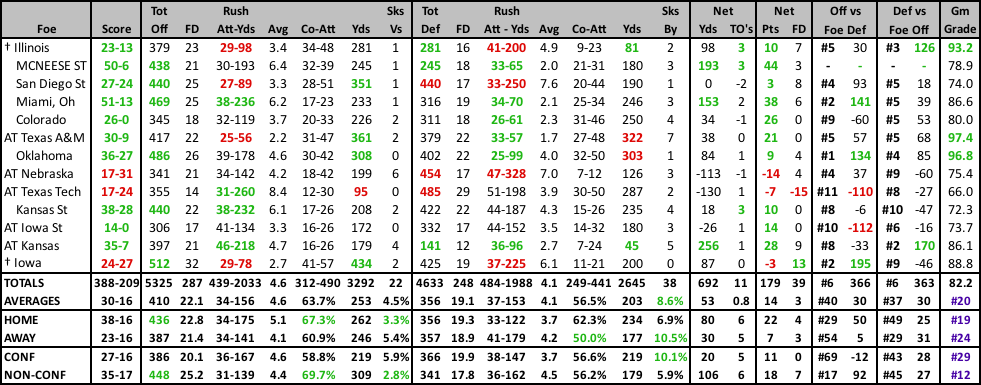
2025 GAME BY GAME STATS |
||||||||||||||||||||||||||||||||||||||||||||||||||||||||||||||||||||||||||||||||||||||||||||||||||||||||||||||||||||||||||||||||||||||||||||||||||||||||||||||||||||||||||||||||||||||||||||||||||||||||||||||||||||||
|
||||||||||||||||||||||||||||||||||||||||||||||||||||||||||||||||||||||||||||||||||||||||||||||||||||||||||||||||||||||||||||||||||||||||||||||||||||||||||||||||||||||||||||||||||||||||||||||||||||||||||||||||||||||
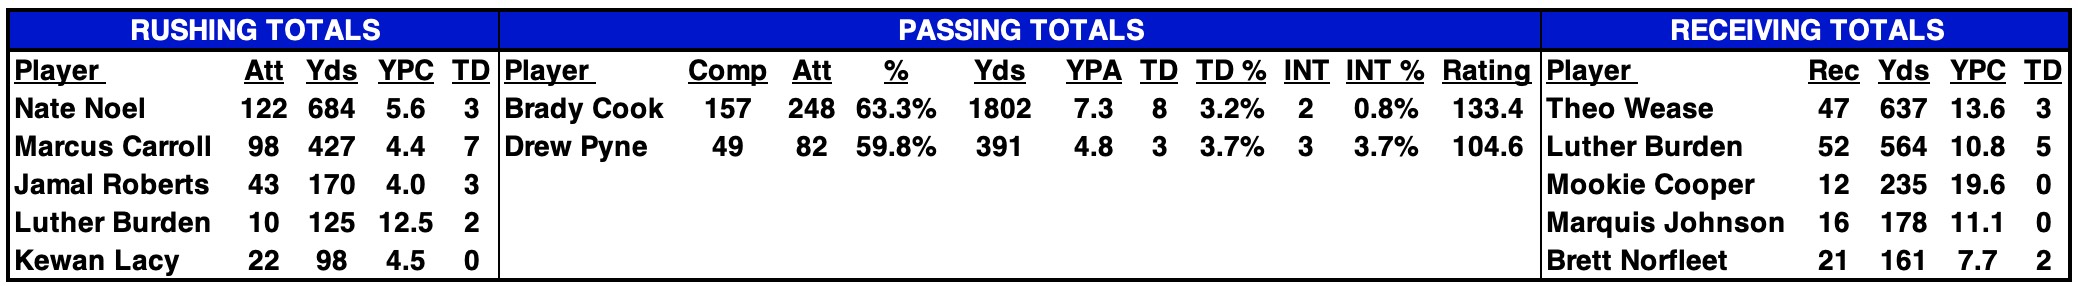
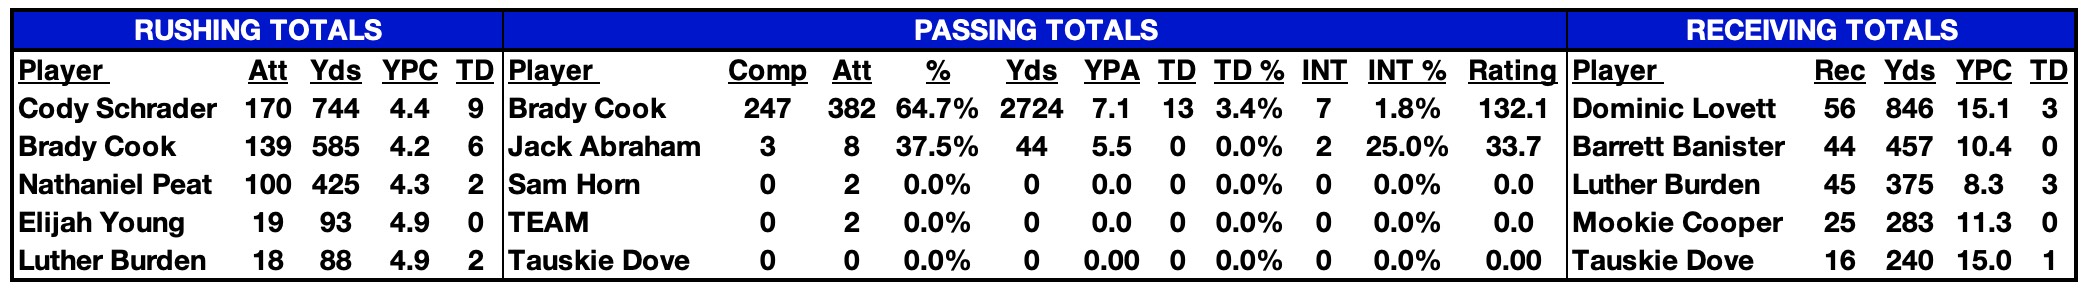
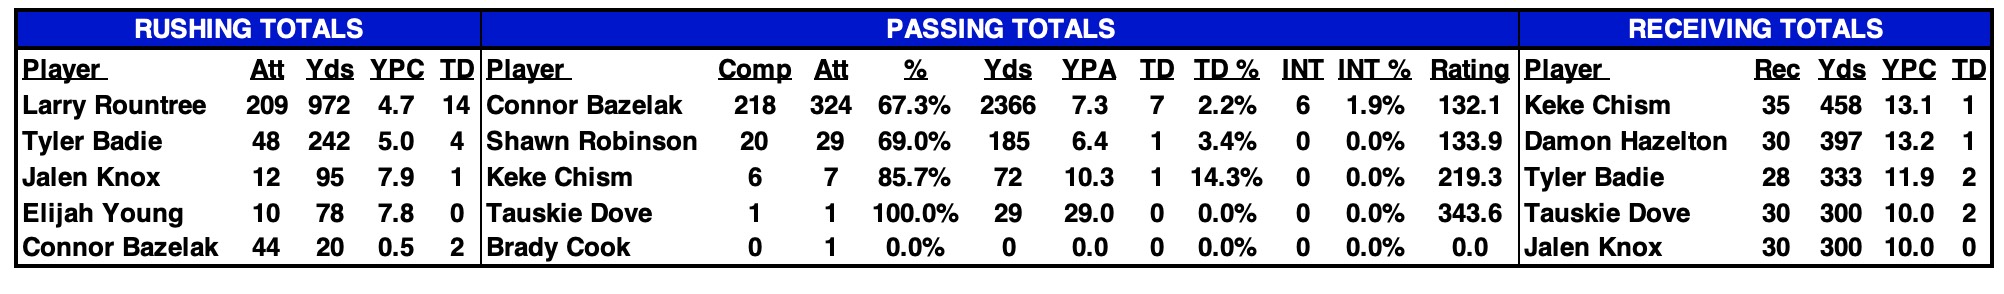
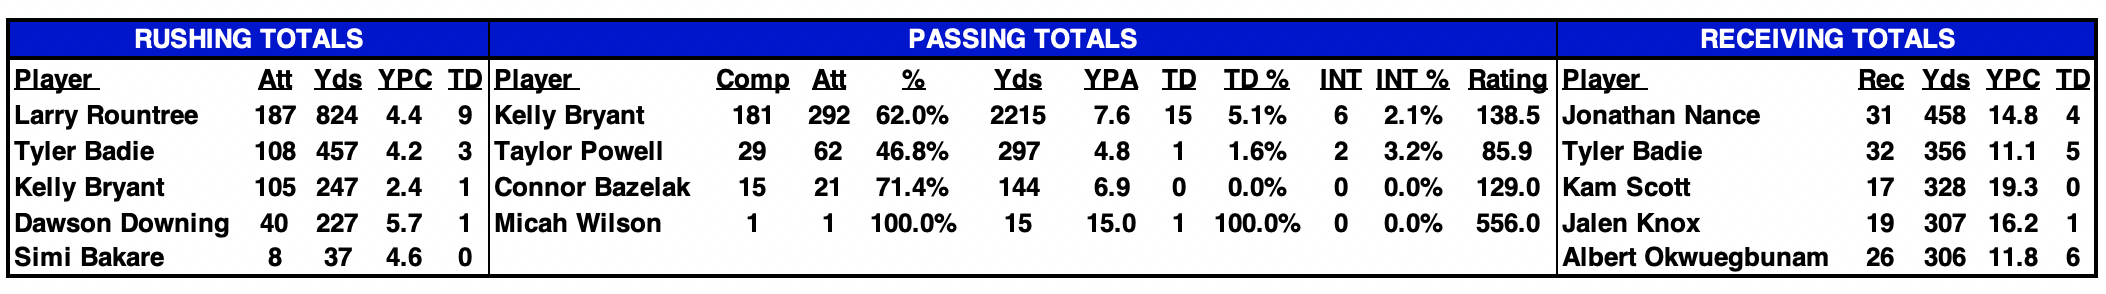
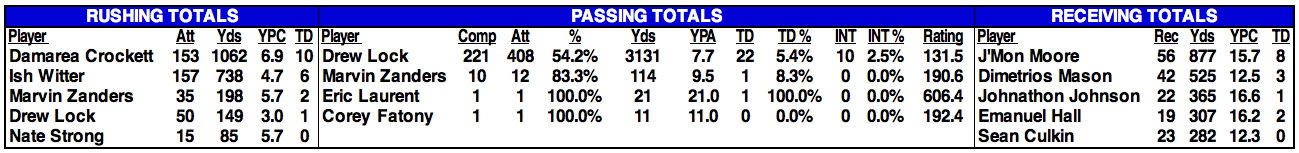
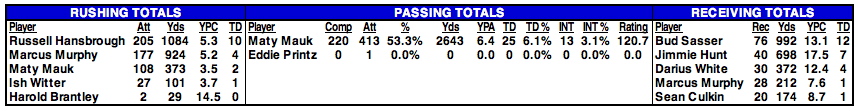
2024 STATISTICAL LEADERS |
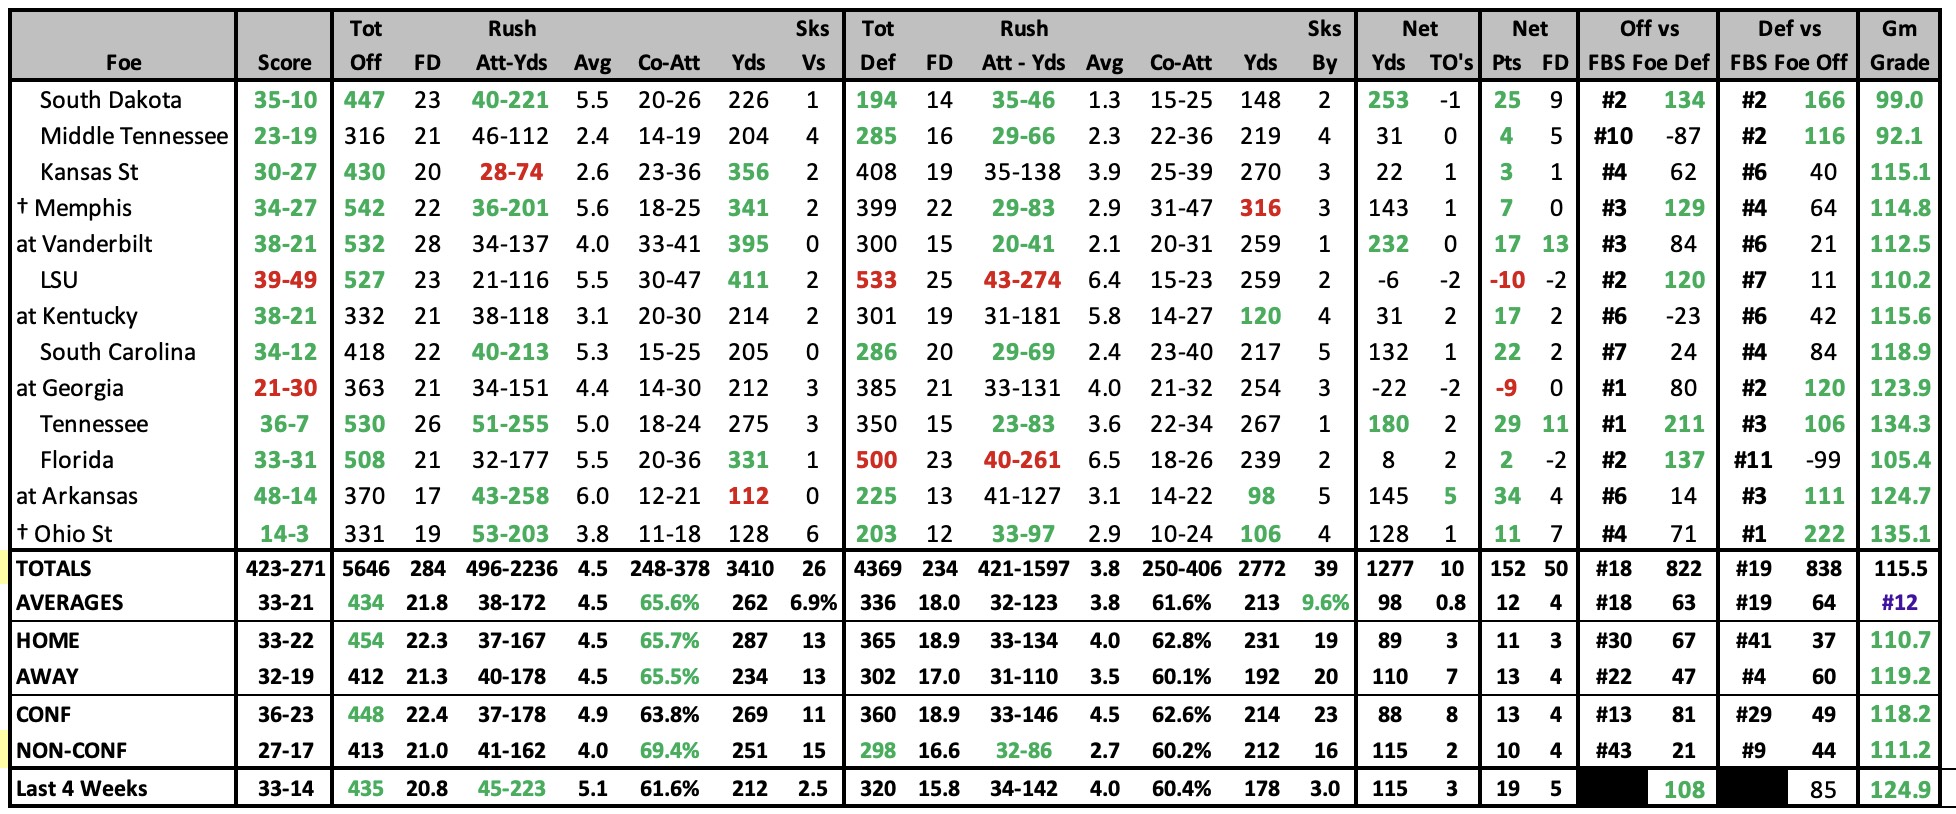
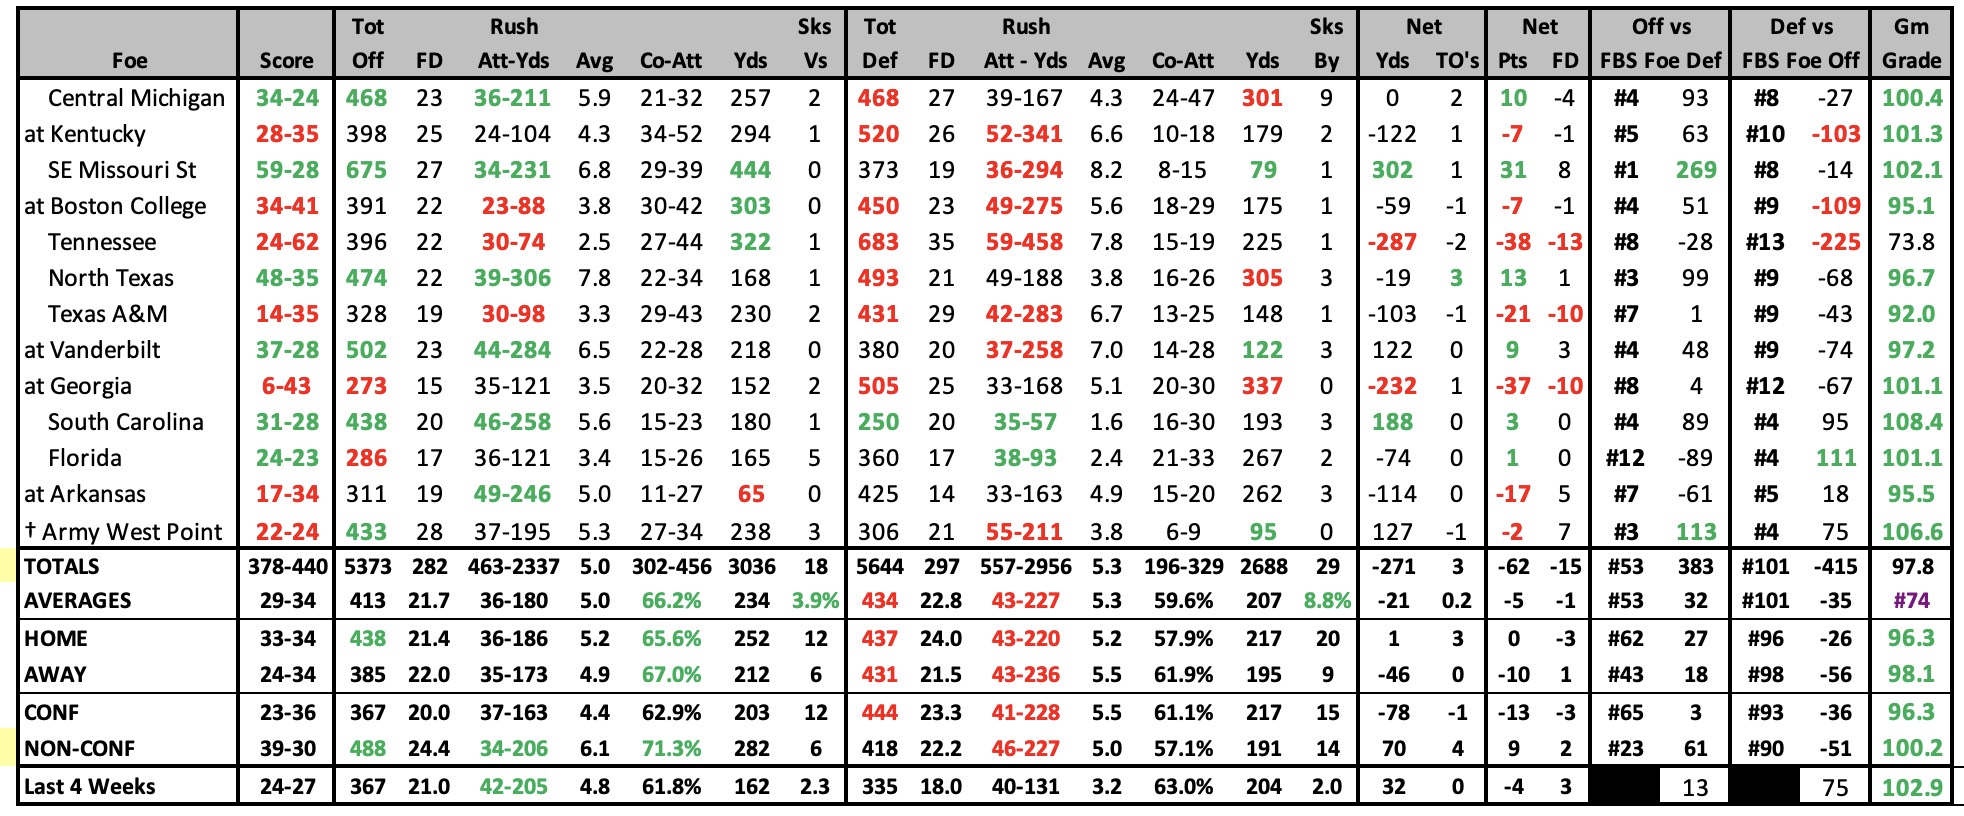
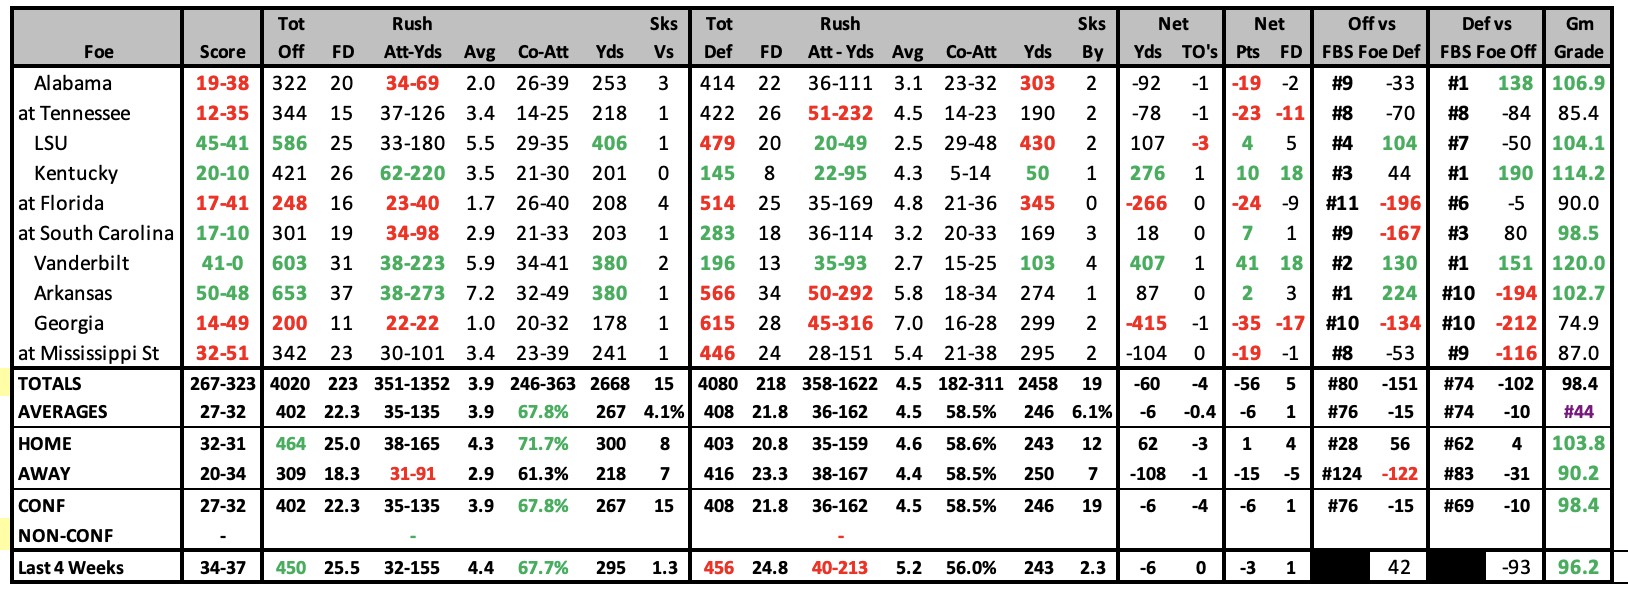
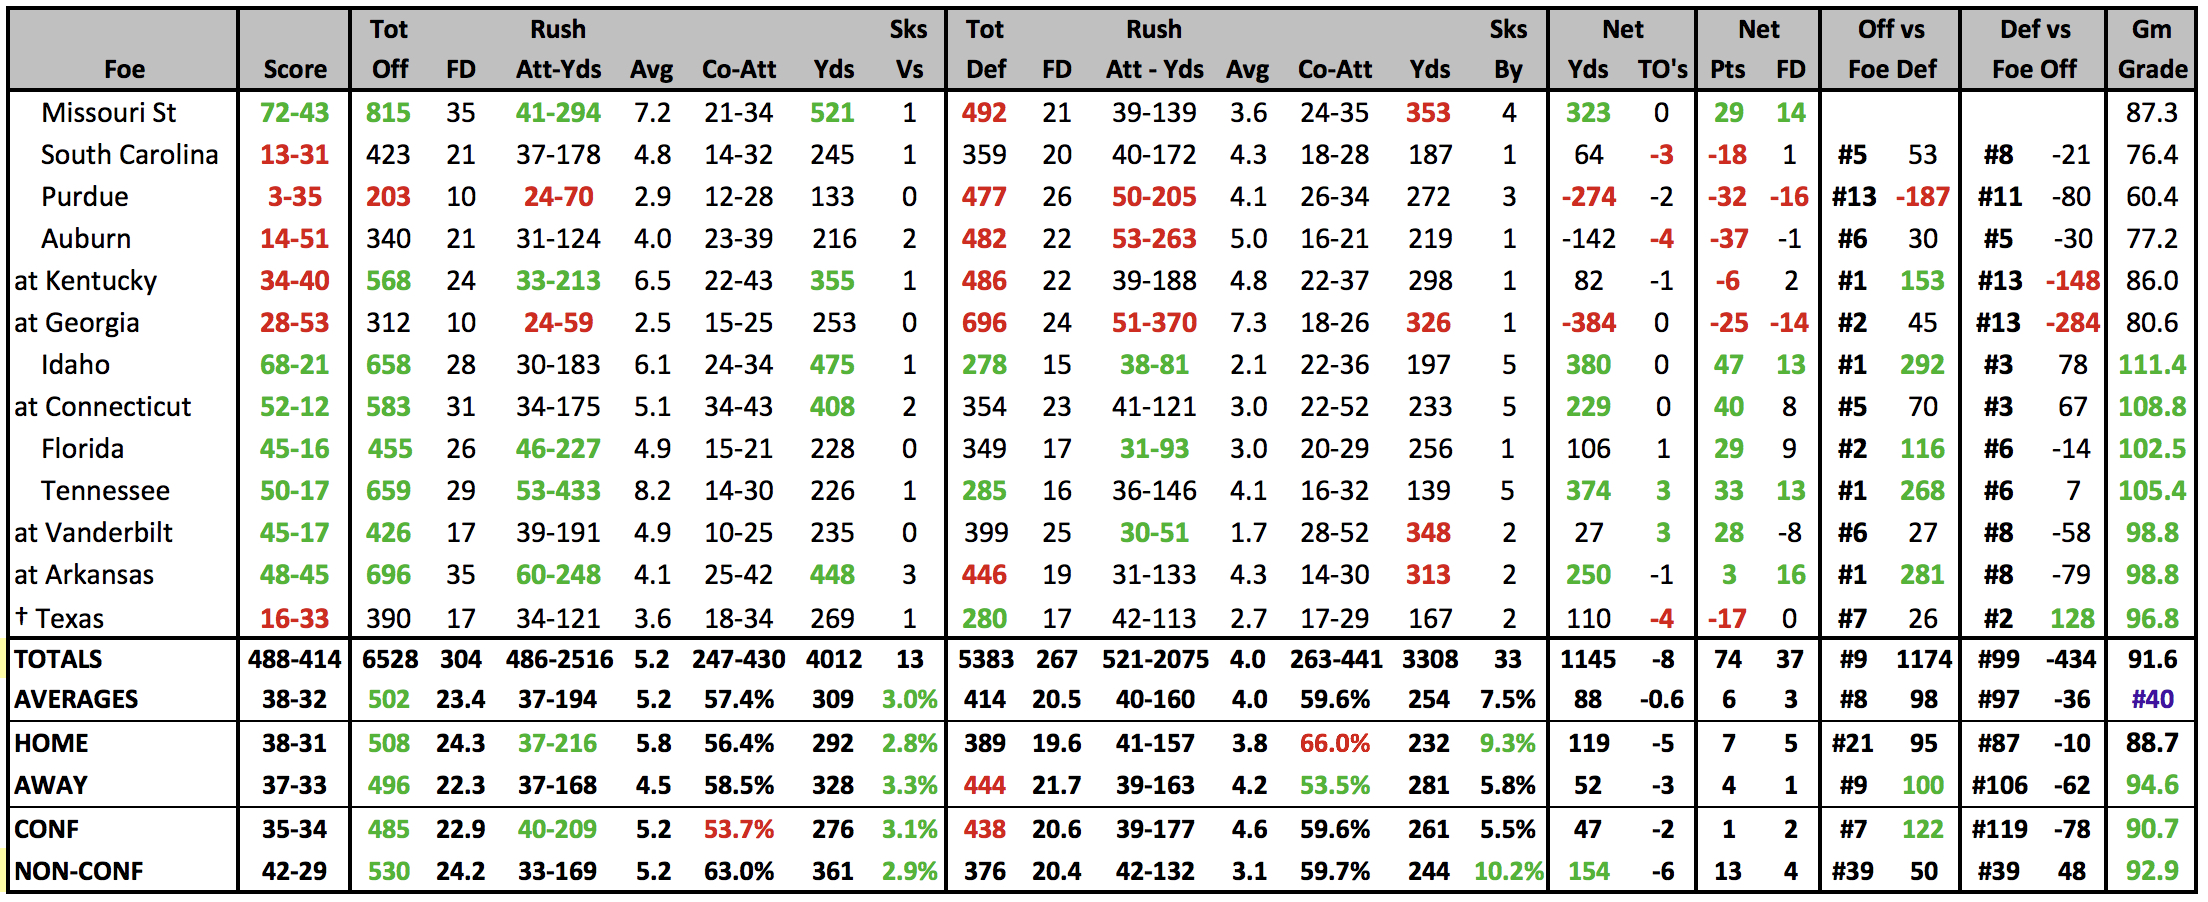
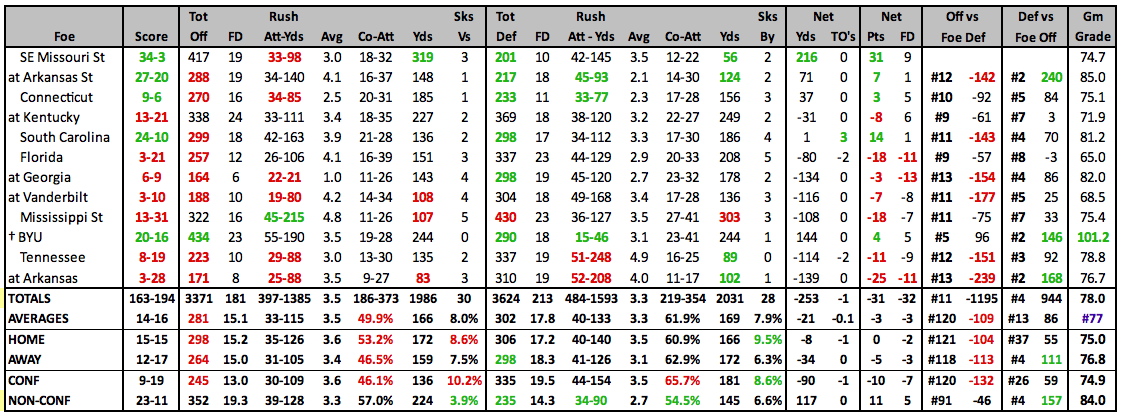
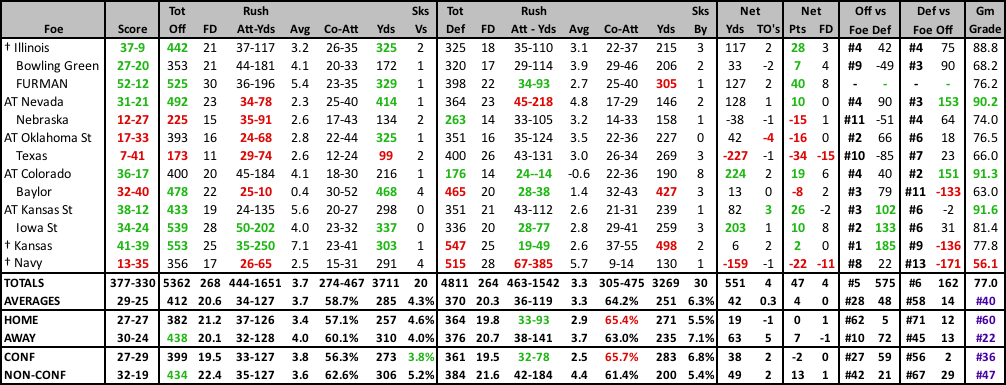
2024 GAME BY GAME STATS |
||||||||||||||||||||||||||||||||||||||||||||||||||||||||||||||||||||||||||||||||||||||||||||||||||||||||||||||||||||||||||||||||||||||||||||||||||||||||||||||||||||||||||||||||||||||||||||||||||||||||||||||||
|
||||||||||||||||||||||||||||||||||||||||||||||||||||||||||||||||||||||||||||||||||||||||||||||||||||||||||||||||||||||||||||||||||||||||||||||||||||||||||||||||||||||||||||||||||||||||||||||||||||||||||||||||
2023 STATISTICAL LEADERS |
2023 GAME BY GAME STATS |
 |
2023 SCHEDULE |
2022 RESULTS |
||||||||||||||||||||||||||||||||||||||||||||||||||||||||||||||||||||||||||||||||||||||||||||||||||||||||||||||||||||||||||||||||||||||||||||||||||||||||||||||||||||||||||||||||||||||||||||||||||||||
|
|
||||||||||||||||||||||||||||||||||||||||||||||||||||||||||||||||||||||||||||||||||||||||||||||||||||||||||||||||||||||||||||||||||||||||||||||||||||||||||||||||||||||||||||||||||||||||||||||||||||||
2022 STATISTICAL LEADERS |
2022 GAME BY GAME STATS |
 |
2022 SCHEDULE |
2021 RESULTS |
||||||||||||||||||||||||||||||||||||||||||||||||||||||||||||||||||||||||||||||||||||||||||||||||||||||||||||||||||||||||||||||||||||||||||||||||||||||||||||||||||||||||||||||||||||||||||||||||||||||
|
|
||||||||||||||||||||||||||||||||||||||||||||||||||||||||||||||||||||||||||||||||||||||||||||||||||||||||||||||||||||||||||||||||||||||||||||||||||||||||||||||||||||||||||||||||||||||||||||||||||||||
2021 STATISTICAL LEADERS |
2021 GAME BY GAME STATS |
 |
2021 SCHEDULE |
2020 RESULTS |
||||||||||||||||||||||||||||||||||||||||||||||||||||||||||||||||||||||||||||||||||||||||||||||||||||||||||||||||||||||||||||||||||||||||||||||||||||||||||||||||||||||||||||||||||||||||||||||||
|
|
||||||||||||||||||||||||||||||||||||||||||||||||||||||||||||||||||||||||||||||||||||||||||||||||||||||||||||||||||||||||||||||||||||||||||||||||||||||||||||||||||||||||||||||||||||||||||||||||
2020 STATISTICAL LEADERS |
2020 GAME BY GAME STATS |
 |
2020 SCHEDULE |
2019 RESULTS |
||||||||||||||||||||||||||||||||||||||||||||||||||||||||||||||||||||||||||||||||||||||||||||||||||||||||||||||||||||||||||||||||||||||||||||||||||||||||||||||||||||||||||||||||||||||||||||||||
|
|
2019 STATISTICAL LEADERS |
2019 GAME BY GAME STATS |
 |
2019 SCHEDULE |
2018 RESULTS |
||||||||||||||||||||||||||||||||||||||||||||||||||||||||||||||||||||||||||||||||||||||||||||||||||||||||||||||||||||||||||||||||||||||||||||||||||||||||||||||||||||||||||||||||||||||||||||||||
|
|
||||||||||||||||||||||||||||||||||||||||||||||||||||||||||||||||||||||||||||||||||||||||||||||||||||||||||||||||||||||||||||||||||||||||||||||||||||||||||||||||||||||||||||||||||||||||||||||||
2018 STATISTICAL LEADERS |
2018 GAME BY GAME STATS |
 |
2018 SCHEDULE |
2017 RESULTS |
|||||||||||||||||||||||||||||||||||||||||||||||||||||||||||||||||||||||||||||||||||||||||||||||||||||||||||||||||||||||||||||||||||||||||||||||||||||||||||||||||||||||||||||||||||||||||||||||||||||||||||||||||||||||||||||||||||||||
|
|
|||||||||||||||||||||||||||||||||||||||||||||||||||||||||||||||||||||||||||||||||||||||||||||||||||||||||||||||||||||||||||||||||||||||||||||||||||||||||||||||||||||||||||||||||||||||||||||||||||||||||||||||||||||||||||||||||||||||
2017 STATISTICAL LEADERS |
2017 GAME BY GAME STATS |
 |
2017 SCHEDULE |
2016 RESULTS |
||||||||||||||||||||||||||||||||||||||||||||||||||||||||||||||||||||||||||||||||||||||||||||||||||||||||||||||||||||||||||||||||||||||||||||||||||||||||||||||||||||||||||||||||||||||||||||||||||||||||||||||||||||||||||||||||
|
|
||||||||||||||||||||||||||||||||||||||||||||||||||||||||||||||||||||||||||||||||||||||||||||||||||||||||||||||||||||||||||||||||||||||||||||||||||||||||||||||||||||||||||||||||||||||||||||||||||||||||||||||||||||||||||||||||
2016 STATISTICAL LEADERS |
2016 GAME BY GAME STATS |
 |
2015 STATISTICAL LEADERS |
2015 GAME BY GAME STATS |
 |
2015 SCHEDULE |
2014 RESULTS |
|||||||||||||||||||||||||||||||||||||||||||||||||||||||||||||||||||||||||||||||||||||||||||||||||||||||||||||||||||||||||||||||||||||||||||||||||||||||||||||||||||||||||||||||||||||||||||||||||||||||||||||||||||||||||||||||||||||||||||||||||||||||||||||||||||
|
|
|||||||||||||||||||||||||||||||||||||||||||||||||||||||||||||||||||||||||||||||||||||||||||||||||||||||||||||||||||||||||||||||||||||||||||||||||||||||||||||||||||||||||||||||||||||||||||||||||||||||||||||||||||||||||||||||||||||||||||||||||||||||||||||||||||
2014 STATISTICAL LEADERS |
2014 GAME BY GAME STATS |
 |
2013 STATISTICAL LEADERS |
| Player | Att | Yds | YPC | TD | Player | Comp | Att | % | Yds | YPA | TD | INT | Rating | Player | Rec | Yds | YPC | TD |
| Henry Josey | 174 | 1166 | 6.7 | 16 | James Franklin | 197 | 318 | 61.9% | 2428 | 7.6 | 19 | 6 | 142.0 | L'Damian Washington | 50 | 893 | 17.9 | 10 |
| Russell Hansbrough | 114 | 685 | 6.0 | 4 | Maty Mauk | 69 | 134 | 51.5% | 1072 | 8.0 | 11 | 2 | 142.8 | Dorial Green-Beckham | 59 | 883 | 15.0 | 12 |
| Marcus Murphy | 92 | 601 | 6.5 | 9 | Bud Sasser | 1 | 1 | 100.0% | 40 | 40.0 | 1 | 0 | 766.0 | Marcus Lucas | 58 | 692 | 11.9 | 3 |
2013 GAME BY GAME STATS |
 |
2013 RESULTS |
2012 RESULTS |
|||||||||||||||||||||||||||||||||||||||||||||||||||||||||||||||||||||||||||||||||||||||||||||||||||||||||||||||||||||||||||||||||||||||||||||||||||||||||||||||||||||||||||||||||||||||||||||||||||||||||||||||||||||||||||||||||||||||||||||||||||||||||||||||||||||||||||||||||||
|
|
|||||||||||||||||||||||||||||||||||||||||||||||||||||||||||||||||||||||||||||||||||||||||||||||||||||||||||||||||||||||||||||||||||||||||||||||||||||||||||||||||||||||||||||||||||||||||||||||||||||||||||||||||||||||||||||||||||||||||||||||||||||||||||||||||||||||||||||||||||
2012 STATISTICAL LEADERS |
| Player | Att | Yds | YPC | TD | Player | Comp | Att | % | Yds | YPA | TD | INT | Rating | Player | Rec | Yds | YPC | TD | ||
| Kedial Lawrence | 200 | 1026 | 5.1 | 12 | James Franklin | 139 | 234 | 59.4% | 1561 | 6.7 | 10 | 7 | 123.6 | Marcus Lucas | 46 | 508 | 11.0 | 3 | ||
| Marcus Murphy | 46 | 252 | 5.5 | 1 | Corbin Berkstresser | 88 | 177 | 49.7% | 1059 | 6.0 | 5 | 7 | 101.4 | L'Damian Washington | 25 | 443 | 17.7 | 2 | ||
| James Franklin | 86 | 141 | 1.6 | 0 | TJ Moe | 0 | 1 | 0.0% | 0 | 0.0 | 0 | 0 | 0.0 | TJ Moe | 40 | 400 | 10.0 | 1 |
| 2012 Individual Player Stats • 2012 Start Chart/Starters lost |
|---|
2012 GAME BY GAME STATS |
 |
2011 STATISTICAL LEADERS |
| Player | Att | Yds | YPC | TD | Player | Comp | Att | % | Yds | YPA | TD | INT | Rating | Player | Rec | Yds | YPC | TD | ||
| Henry Josey | 145 | 1164 | 8.0 | 9 | James Franklin | 239 | 376 | 63.6% | 2879 | 7.7 | 21 | 11 | 140.5 | TJ Moe | 54 | 650 | 12.0 | 4 | ||
| James Franklin | 218 | 964 | 4.4 | 15 | Jimmy Costello | 3 | 4 | 75.0% | 74 | 18.5 | 1 | 0 | 312.9 | Michael Egnew | 50 | 524 | 10.5 | 3 | ||
| Kendial Lawrence | 119 | 585 | 4.9 | 5 | TJ Moe | 2 | 4 | 50.0% | 71 | 17.8 | 1 | 0 | 281.6 | Marcus Lucas | 23 | 414 | 18.0 | 5 |
2011 GAME BY GAME STATS |
2011 RESULTS |
2010 RESULTS |
|||||||||||||||||||||||||||||||||||||||||||||||||||||||||||||||||||||||||||||||||||||||||||||||||||||||||||||||||||||||||||||||||||||||||||||||||||||||||||||||||||||||||||||||||||||||||||||||||||
|
|
|||||||||||||||||||||||||||||||||||||||||||||||||||||||||||||||||||||||||||||||||||||||||||||||||||||||||||||||||||||||||||||||||||||||||||||||||||||||||||||||||||||||||||||||||||||||||||||||||||
2010 STATISTICAL LEADERS |
| Player | Att | Yds | YPC | TD | Player | Comp | Att | % | Yds | YPA | TD | INT | Rating | Player | Rec | Yds | YPC | TD | ||
| De'Vion Moore | 98 | 514 | 5.2 | 8 | Blaine Gabbert | 302 | 477 | 63.3% | 3201 | 6.7 | 16 | 9 | 127.0 | TJ Moe | 92 | 1042 | 11.3 | 6 | ||
| Henry Josey | 75 | 424 | 5.7 | 5 | James Franklin | 11 | 14 | 78.6% | 106 | 7.6 | 1 | 1 | 151.5 | Michael Egnew | 89 | 778 | 8.7 | 5 | ||
| Kendial Lawrence | 73 | 422 | 5.8 | 4 | TJ Moe | 0 | 1 | 0.0% | 0 | 0.0 | 0 | 0 | 0.0 | Jerrell Jackson | 51 | 660 | 12.9 | 3 |
| 2010 Individual Player Stats |
|---|
2010 GAME BY GAME STATS |
2009 STATISTICAL LEADERS |
| Player | Att | Yds | YPC | TD | Player | Comp | Att | % | Yds | YPA | TD | INT | Rating | Player | Rec | Yds | YPC | TD | ||
| Derrick Washington | 179 | 803 | 4.49 | 10 | Blaine Gabbert | 247 | 414 | 59.7% | 3302 | 8.0 | 23 | 7 | 141.6 | Danario Alexander | 107 | 1644 | 15.4 | 13 | ||
| De'Vion Moore | 58 | 234 | 4.03 | 1 | Jimmy Costello | 8 | 15 | 53.3% | 58 | 3.9 | 0 | 2 | 59.1 | Jared Perry | 46 | 696 | 15.1 | 6 | ||
| Blaine Gabbert | 94 | 228 | 2.43 | 3 | Danario Alexander | 1 | 2 | 50.0% | 40 | 20.0 | 1 | 0 | 383.0 | Jerrell Jackson | 37 | 458 | 12.4 | 2 |
| 2009 Individual Player Stats |
|---|
2009 GAME BY GAME STATS |
2009 RESULTS |
2008 RESULTS |
|||||||||||||||||||||||||||||||||||||||||||||||||||||||||||||||||||||||||||||||||||||||||||||||||||||||||||||||||||||||||||||||||||||||||||||||||||||||||||
|
|
|||||||||||||||||||||||||||||||||||||||||||||||||||||||||||||||||||||||||||||||||||||||||||||||||||||||||||||||||||||||||||||||||||||||||||||||||||||||||||